What a Waste: Solid Waste Management in Asia pptx
Bạn đang xem bản rút gọn của tài liệu. Xem và tải ngay bản đầy đủ của tài liệu tại đây (617.58 KB, 45 trang )
What a Waste:
May 1999
Solid Waste
Management
in Asia
Urban Development Sector Unit
East Asia and Pacific Region
Copyright © 1999
The International Bank for Reconstruction
and Development/THE WORLD BANK
1818 H Street, N.W.
Washington, D.C. 20433, U.S.A.
All rights reserved
Manufactured in the United States of America
First printing May 1999
Urban and Local Government Working Papers are published to communicate the results of the Bank's work
to the development community with the least possible delay. The typescript of this paper therefore has not been
prepared in accordance with the procedures appropriate to formal printed texts, and the World Bank accepts no
responsibility for errors. Some sources cited in this paper may be informal documents that are not readily available.
The findings, interpretations, and conclusions expressed in this paper are entirely those of the author(s) and
should not be attributed in any manner to the World Bank, to its affiliated organizations, or to members of its Board
of Executive Directors or the countries they represent. The World Bank does not guarantee the accuracy of the data
included in this publication and accepts no responsibility for any consequence of their use. The boundaries, colors,
denominations, and other information shown on any map in this volume do not imply on the part of the World Bank
Group any judgment on the legal status of any territory or the endorsement or acceptance of such boundaries.
The material in this publication is copyrighted. Request for permission to reproduce portions of it should be
sent to the Urban Development Division at the address in the copyright notice above. The World Bank encourages
dissemination of its work and will normally give permission promptly and, when reproduction is for non-
commercial purposes, without asking a fee.
TABLE OF CONTENTS
Recommendations and Conclusions 1
1. Introduction 3
2. Waste Characterization 4
2.1 Waste Generation Rates 4
2.2 Waste Composition 6
2.3 Waste Trends 7
3.0 Consumer Societies 11
4.0 Business Involvement in Waste Management 12
4.1 Increased Partnerships 12
4.2 Extended product responsibility 12
4.3 Environmental Labelling 14
4.4 Waste exchanges 14
4.5 Pulp and Paper 14
5.0 Environmental and Health Impacts of Improper Solid Waste Management 15
6.0 Integrated Solid Waste Management 16
6.1 Solid Waste Management Costs 17
7.0 Solid Waste Management Common Values 22
References 27
Waste Generation and Composition References 30
Annex 1: Solid Waste Data 33
Annex 2: Waste Generation Rates 35
WHAT A WASTE: SOLID WASTE MANAGEMENT IN ASIA
This paper was prepared by Daniel Hoornweg, researched by Laura Thomas and overseen by Keshav Varma
(EASUR). Information and comments were supplied by many World Bank and UNDP staff, particularly George
N. Plant, L. Panneer Selvam, and Richard W. Pollard, and Carl Bartone of the Transport, Water, and Urban
Development Department. Melissa Fossberg, Gabriela Boyer, Beth Rabinowitz, and Laura Lewis edited and
prepared the paper.
Page 1
WHAT A WASTE: SOLID WASTE MANAGEMENT IN ASIA
WHAT A WASTE:
Solid Waste Management in Asia
RECOMMENDATIONS AND CONCLUSIONS
• Solid waste data is largely unreliable. This report contains one of the most comprehensive
compilations of municipal solid waste data in Asia; yet, due to inconsistencies in data recording,
definitions, collection methods, and seasonal variations, the data can only be considered approximate,
albeit more accurate than most. For planning purposes, however, the data presented in this report
should be sufficient.
• The urban areas of Asia now spend about US$25 billion on solid waste management per year; this
figure will increase to at least US$50 billion in 2025. Today’s daily waste generation rate is about
760,000 tonnes. By 2025, this rate will be increased to about 1.8 million tonnes per day.
• Japan spends about ten times more for waste disposal than collection costs (mostly incineration
costs). Total waste management costs in low income countries are usually
more than 80 percent for collection costs. Lower cost landfilling is usually
a more practical waste disposal option than incineration.
• Municipal governments are usually the responsible agency for solid waste
collection and disposal, but the magnitude of the problem is well beyond
the ability of any municipal government. They need help. In addition to
other levels of government, businesses and the general community need to
be more involved in waste management.
• Generally, solid waste planners place too much emphasis on residential
waste; this waste represents only about 30 percent of the overall municipal
waste stream but often receives the lion’s share of attention.
• The waste components requiring priority attention in Asia are organics and
paper.
• Indonesia and the Philippines as well as parts of China and India are the
Asian countries facing the greatest waste management challenge, based on
projected waste generation rates and relative affluence to deal with the
problem.
• In terms of waste management trends, no region of the world faces a greater need to break the
inextricable link between waste generation rates and affluence than Asia. For example, if Asia
follows life style trends of the US and Canada (as Hong Kong already seems to be doing) versus the
more typical European urban resident, the world would need to supply about 500 million tonnes
more resources in 2025.
• Asia should pursue regional approaches to many solid waste management problems, e.g., packaging
regulations and import/export rules.
• Urban residents generate two to three times more solid waste than their fellow rural citizens.
• Municipalities should charge for waste disposal, and possibly collection, based on generation rates.
• Industrialized countries contain 16 percent of the world’s population but use about 75 percent of
the world’s paper supply. Residents of India, Indonesia, and China, for example, are aspiring to be
as affluent as more industrialized nations. This would require a doubling of the world’s current
level of paper production.
The urban areas
of Asia now spend
about US$25
billion on solid
waste management
per year; this
figure will
increase to about
US$47 billion in
2025.
Page 3
WHAT A WASTE: SOLID WASTE MANAGEMENT IN ASIA
1. Introduction: Solid Waste Management in Asia
As urbanization and economic development increases in Asia, nowhere is the impact more obvious
than in society’s “detritus,” or solid waste. Today, the urban areas of Asia produce about 760,000 tonnes of
municipal solid waste (MSW) per day, or approximately 2.7 million m
3
per day. In 2025, this figure will
increase to 1.8 million tonnes of waste per day, or 5.2 million m
3
per day. These estimates are conservative;
the real values are probably more than double this amount.
Local governments in Asia currently spend about US $25 billion per year on urban solid waste
management. This amount is used to collect more than 90 percent of the waste in high income countries,
between 50 to 80 percent in middle income countries, and only 30 to 60 percent in low income countries.
In 2025, Asian governments should anticipate spending at least double this amount (in 1998 US dollars)
on solid waste management
activities.
To carry out integrated
solid waste management,
local governments need
partners. National
governments must reduce
the externalities of waste by
considering measures such
as full cost accounting,
package deposits,
manufacturer responsibility,
and extended product care.
The general community,
which is probably the most
important stakeholder in
waste management
activities, must also actively
participate in the solutions
by modifying their behavior
patterns. For example, they
need to exert discipline in
separating waste, using
containers in a beneficial way, and exercising environmentally friendly purchasing habits.
This paper reviews the broad trends related to solid waste management in Asia
1
. “The big picture”
projects regional urban MSW quantities and compositions in 2025. The forces of these trends are analyzed,
and preliminary suggestions for reducing the impact of these trends are provided. The paper also briefly
discusses possible policies and budget requirements for dealing with this burgeoning waste stream.
This paper contains one of the most comprehensive collections of solid waste generation data. In
compiling these data, the authors identified shortcomings with terminology used and sampling methods
and built-in problems with consistency. In Annex 1, recommendations are made to help overcome these
limitations and for improving solid waste data collection and presentation. Annex 2 presents waste
generation rates for selected Asian cities.
It is beyond the scope of this paper to venture into the debate on “the limits to growth” vis-a-vis
resource consumption or the negative environmental impacts that will occur from wastes generated by
an increasingly consumeristic one billion urban Asians. The fear about these effects, however, is warranted,
particularly since nearly 95 percent of environmental damage occurs before a product is discarded as
Solid
Waste
“The impact doesn’t look too bad.”
1
Asia in this report is limited to China, Japan, Hong Kong, Republic of Korea, Mongolia, Indonesia, Lao PDR, Malaysia, Myanmar,
Philippines, Singapore, Thailand, Vietnam, Bangladesh, India, Nepal, and Sri Lanka.
Overall
Environmental
Impact
Page 4
WHAT A WASTE: SOLID WASTE MANAGEMENT IN ASIA
solid waste. This paper discusses the concern about environmental effects associated with solid waste
management as well as the escalating costs that solid waste management consumes from local government
budgets and how to handle these increases.
This paper focuses on waste management only as it pertains to urban environments, based on (1)
projections that in 2025 about 52 percent of Asia’s population will reside in urban areas, and (2) evidence
that urban residents generate at least two times more waste per capita than their rural counterparts.
Although urban waste management data may be inconsistent and unreliable, rural solid waste
management data are virtually nonexistent and are derived only from assumptions regarding purchasing
habits. Given these factors, it is clear that solid waste management efforts must target priority urban
areas.
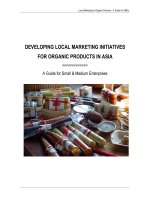
This paper does not review “where the waste goes.” A follow-up study that reviews composting
rates (existing and potential), recycling (existing programs, potential markets), number and working
conditions of waste pickers, would be a valuable contribution to municipal waste management planning.
2. WASTE CHARACTERIZATION
Solid waste streams should be characterized by their sources, by the types of wastes produced, as
well as by generation rates and composition. Accurate information in these three areas is necessary in
order to monitor and control existing waste management systems and to make regulatory, financial, and
institutional decisions.
Annex 1 discusses in detail reliability issues and compositions of waste data. Better consistency in
definition and methodology is needed. Although this paper contains one of the most comprehensive
compilations of MSW data for Asia, readers must exercise caution in interpretating the data. Severe under-
recording of waste quantities is typical, and total waste generation is usually much higher than that
reported by government agencies.
One important observation shown in Annex 1 is that apart from localized anomalies, such as the use
of coal for cooking and heating, urban waste generation rates are generally consistent vis-a-vis local
economic activity and residential wealth. Because waste characterization studies are relatively expensive
to conduct, the general “rules of thumb” provided in this paper should provide sufficient direction for
the purposes of waste management planning.
In the context of this paper, waste is defined as any unwanted material intentionally thrown away for
disposal. However, certain wastes may eventually become resources valuable to others once they are
removed from the waste stream. This definition of waste may differ somewhat from definitions used by
other international data sources.
Knowledge of the sources and types of waste in an area is required in order to design and operate
appropriate solid waste management systems. (See Figure 1.) There are eight major classifications of
solid waste generators: residential, industrial, commercial, institutional, construction and demolition,
municipal services, process, and agricultural.
MSW includes wastes generated from residential, commercial, industrial, institutional, construction,
demolition, process, and municipal services. However, this definition varies greatly among waste studies,
and some sources are commonly excluded, such as industrial, construction and demolition, and municipal
services. Often only residential waste is referred to as MSW, and in high income countries, only 25 percent
to 35 percent of the overall waste stream is from residential sources
2
. It is important to define the
composition of the municipal waste stream in a clear and consistent fashion. For example, if this municipal
waste stream includes construction and demolition waste, the quantity of waste is doubled. Far too often,
2
Personal Communication: Region of Vancouver, 25 percent residential (Linda Shore); Copenhagen, 30 percent residential (Helmer
Olsen); Toronto, 35 percent residential (excluding construction and demolition - Tim Michael); Osaka, 37 percent residential
(excluding industrial waste - Mr. Sawachi).
Page 5
WHAT A WASTE: SOLID WASTE MANAGEMENT IN ASIA
waste management decisions are based disproportionately on residential waste, which accounts for an
increasingly small fraction of the waste stream as an area industrializes.
2.1 WASTE GENERATION RATES
Waste generation rates are affected by socioeconomic development, degree of industrialization, and
climate. Generally, the greater the economic prosperity and the higher percentage of urban population,
the greater the amount of solid waste produced. Figure 2 gives urban MSW generation rates, as a weighted
average of the waste data available from various cities. Waste generation rates for various Asian cities are
in Annex 2.
Figure 1: Sources and Types of Solid Wastes
Source Typical waste generators Types of solid wastes
Residential Single and multifamily dwellings Food wastes, paper, cardboard, plastics, textiles, leather, yard wastes, wood,
glass, metals, ashes, special wastes (e.g., bulky items, consumer electronics,
white goods, batteries, oil, tires), and household hazardous wastes
Industrial Light and heavy manufacturing, Housekeeping wastes, packaging, food wastes, construction and
fabrication, construction sites, demolition materials, hazardous wastes, ashes, special wastes
power and chemical plants
Commercial Stores, hotels, restaurants, markets, Paper, cardboard, plastics, wood, food wastes, glass, metals, special wastes,
office buildings, etc. hazardous wastes
Institutional Schools, hospitals, prisons, Same as commercial
government centers
Construction and demolition New construction sites, road repair, Wood, steel, concrete, dirt, etc.
renovation sites, demolition of buildings
Municipal services Street cleaning, landscaping, parks, Street sweepings; landscape and tree trimmings; general wastes from parks,
beaches, other recreational areas, beaches, and other recreational areas; sludge
water and wastewater treatment plants
Process Heavy and light manufacturing, refineries, Industrial process wastes, scrap materials, off-specification products, slag,
chemical plants, power plants, mineral tailings
extraction and processing
All of the above should be included as “municipal solid waste.”
Agriculture Crops, orchards, vineyards, dairies, Spoiled food wastes, agricultural wastes, hazardous wastes (e.g., pesticides)
feedlots, farms
Page 6
WHAT A WASTE: SOLID WASTE MANAGEMENT IN ASIA
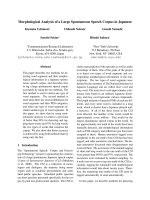
Figure 2: Waste Composition of Low, Middle, and High Income Countries
Note: Approximate scale only.
Low Income Countries: Year 2025
Total waste=480,000,000 tonnes per year
Paper
15%
Plastic
6%
Glass
3%
Organic
60%
Others
12%
Metal
4%
Middle Income Countries: Year 2025
Total waste=111,000,000 tonnes per year
Paper
20%
Metal
5%
Glass
3%
Plastic
9%
Others
13%
Organic
50%
High Income Countries: Year 2025
Total waste=86,000,000 tonnes per year
Paper
34%
Glass
7%
Others
11%
Plastic
10%
Metal
5%
Organic
33%
Low Income Countries: Current
Total waste=158,000,000 tonnes per year
Others
47%
Glass
2%
Plastic
4%
Metal
1%
Paper
5%
Organic
41%
Middle Income Countries: Current
Total waste=34,000,000 tonnes per year
Paper
15%
Glass
2%
Metal
3%
Plastic
11%
Others
11%
Organic
58%
2025 Waste Quantities and Composition
Current Waste Quantities and Composition
Organic
Paper
Plastic
Glass
Metal
Others
28%
36%
9%
7%
8%
12%
High Income Countries: Current
Total waste = 85,000,000 tonnes per year
Page 7
WHAT A WASTE: SOLID WASTE MANAGEMENT IN ASIA
Low income countries have the
lowest percentage of urban
populations and the lowest waste
generation rates, ranging between
0.4 to 0.9 kg per capita per day. All
of the countries that have a GNP per
capita less than US $400 produce
under 0.7 kg per capita per day. As
GNP increases toward the middle
income range, the per capita waste
generation rates also increase,
ranging from 0.5 to 1.1 kg per day.
As predicted, the high income
countries show the greatest
generation rates, which vary from
1.1 to 5.07 kg per capita per day.
Hong Kong generates enormous
quantities of construction and
demolition waste, which explains
their exceptionally high per capita
MSW generation rate in comparison
to other countries. Hong Kong’s
waste generation rate better reflects
the true quantities of waste
produced by all activities within the
municipality than some of the other
countries. Although Singapore and
Japan report significantly lower
generation rates than other high and
middle income countries, the
figures for these countries do not
represent all municipal solid wastes.
The Singapore generation rate
considers only residential wastes,
whereas the Japanese data include
only wastes produced from
households and general wastes from business activities. For both countries, total waste quantities would
be much higher if industrial, commercial, institutional, construction and demolition, and municipal services
wastes were also included.
Comparing generation rates for various countries is problematic. As demonstrated by Hong Kong,
Singapore, and Japan, global inconsistencies in the way municipal solid waste is defined and quantified
can lead to significant differences among the “official” waste generation rates.
As mentioned previously, very little information about rural waste generation rates in Asian countries
is available; however, one can assume that rural populations will generate less waste because these areas
have lower per capita incomes. Urbanization and rising incomes, which lead to more use of resources
and therefore more waste, are the two most important trends that factor into rising waste generation
rates. Figure 4 exemplifies this trend. Individuals living in Indian urban areas use nearly twice as many
resources per capita than those living in a rural setting. Because they consume and generate more solid
Figure 3: Current Urban Municipal Solid Waste Generation
Country GNP Per Capita
1
Current Urban Current Urban
(1995 US $) Population MSW Generation
(% of Total)
2
(kg/capita/day)
Low Income 490 27.8 0.64
Nepal 200 13.7 0.50
Bangladesh 240 18.3 0.49
Myanmar 240* 26.2 0.45
Vietnam 240 20.8 0.55
Mongolia 310 60.9 0.60
India 340 26.8 0.46
Lao PDR 350 21.7 0.69
China 620 30.3 0.79
Sri Lanka 700 22.4 0.89
Middle Income 1,410 37.6 0.73
Indonesia 980 35.4 0.76
Philippines 1,050 54.2 0.52
Thailand 2,740 20.0 1.10
Malaysia 3,890 53.7 0.81
High Income 30,990 79.5 1.64
Korea, Republic of 9,700 81.3 1.59
Hong Kong 22,990 95.0 5.07
Singapore 26,730 100 1.10
Japan 39,640 77.6 1.47
1
World Bank, 1997b See Figure 7 for comparison to 2025.
2
United Nations, 1995
*estimated GNP
Page 8
WHAT A WASTE: SOLID WASTE MANAGEMENT IN ASIA
waste, the Indian urban population is expected to produce far more waste per capita than its rural
population. This difference between rural and urban waste generation rates also exists in other Asian
countries, such as in Bangladesh, where the rural population generates only 0.15 kg per capita per day,
while their urban counterparts generate 0.4 to 0.5 kg per capita per day (World Bank, 1998a).
2.2 WASTE COMPOSITION
Waste composition is also influenced by external factors, such as geographical location, the population’s
standard of living, energy source, and weather. Figure 3 presents the current average urban waste
compositions for low, middle, and high income Asian countries. The percentages are based on a weighted
average of the compositions for individual
countries, which are located in Annex 2.
Although the definitions and
methodologies for determining
composition were rarely discussed in
waste studies, the compositions for
municipal solid waste are assumed to be
based on wet weight.
Generally, all low and middle income
countries have a high percentage of
compostable organic matter in the urban
waste stream, ranging from 40 to 85
percent of the total. China and India
diverge from this trend because they
traditionally use coal as a household fuel
source. The ash that is subsequently
produced is very dense and tends to
dominate the waste stream in terms of
weight. Ash is included in the “others”
category and makes up 45 and 54 percent
of India and China’s waste composition,
respectively. Figure 5 shows the degree to
which the preference of coal over gas in a
Chinese city increases the percentage of
inorganics in the waste stream. This
increase obviously has considerable
implications for these countries as income
levels increase.
Figure 2 shows
that the
compostable
fraction in high
income countries,
which ranges
between 25 and 45
percent, is
significantly lower
than for low and
Figure 4: Direct and Indirect Per Capita Consumption in India,
1989—90, Rupees/annum
Commodities Rural per capita Urban per capita
consumption consumption
Sugarcane 84.34 79.34
Cotton 58.34 94.00
Coal and lignite 33.73 81.69
Crude petroleum and natural gas 60.34 162.03
Iron ore 0.37 0.81
Other metallic minerals 2.23 5.23
Cement 4.08 7.88
Iron and steel 43.15 95.48
Electricity, gas, and water supply 121.53 296.69
All commodities 4996.95 9720.20
Population (in millions) 606.6 204.6
Percentage of population 74.8 25.2
(Parikh et al., 1991. Cited in Hammond, 1998)
Figure 5: Waste Composition Among Different Types of Households in Dalian, China
Households Waste Content Percentage
Type Percentage Organic Inorganic Other
Cooking with gas Individual heating with coal 35.3 70.1 19.3 10.6
Cooking with coal Central heating with coal 46.5 66.6 25.5 7.9
Cooking with coal Individual heating with coal 18.2 38.3 60 2.7
(Dalian Environment and Sanitation Department (DESMB), 1990. Cited in Ecology and
Environment, Inc., 1993)
Page 9
WHAT A WASTE: SOLID WASTE MANAGEMENT IN ASIA
middle income countries. The percentage of consumer packaging wastes increases relative to the
population’s degree of wealth and urbanization. The presence of paper, plastic, glass, and metal becomes
more prevalent in the waste stream of middle and high income countries.
2.3 WASTE TRENDS
Waste quantities are inextricably linked to economic activity and resource consumption. Over the
next 25 years, poverty in Asia is expected to continue declining (despite recent economic performance). If
the pace of capital accumulation and productivity growth continues, then the wages of unskilled workers
in all countries and regions are expected to increase substantially (World Bank, 1997c). Besides economic
growth, Asian countries are also experiencing urban growth rates of approximately 4 percent per year; a
trend that is expected to continue for several decades. By 2025, the Asian population is projected to be
about 52 percent urban. Cities in developing countries are experiencing unprecedented population growth
because they provide, on average, greater economic and social benefits than do rural areas (World Resources
Institute, 1996). In fact, rural-to-urban migration is estimated to account for 40 to 60 percent of annual
urban population growth in the developing world (McGee and Griffiths, 1994).
The economic and population growth experienced by many Asian countries follows similar material
consumption trends as those found in the United States and other industrialized countries over the past
century. As shown in Figure 22, the overall consumption rates in the United States dramatically increased
as the economy prospered, despite periods where Americans experienced economic hardships such as
the Great Depression in the
early 1930’s and the energy
crisis of the mid-1970’s.
Japan has experienced
waste trends comparable to
the United States over the
past two decades. Waste
quantities were rising until
1970, declined temporarily
after the 1973 energy crisis,
and then rose again slightly.
As the economy prospered
in the late 1980’s, waste
quantities increased sharply.
However, since 1990,
generation rates have
stabilized due to an
economic slow-down and
the implementation of
waste reduction policies
(Japan Waste Management
Association, 1996).
China is also
experiencing rapid
population and economic
growth. Consequently,
municipal solid waste is
increasing in excess of 10
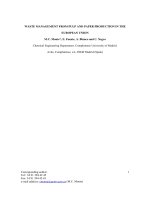
Figure 6: Variations in Waste Generation and Composition
by Affluence: Beijing, China
Waste quantities and compositions vary not only between countries, but also between individual cities,
and communities within a city. The figure below illustrates the differences between the waste composi-
tions of two different residential areas in Beijing. The wealthier households produce significantly
higher percentages of paper, plastic, metal, and glass wastes, most likely from packaging materials.
Compostable matter, such as food, horticultural, and ash waste, are predominant in single-story resi-
dential waste streams. The high ash and dirt content is from coal since gas is not yet as widespread
among the population (Beijing Environmental Sanitation Administration, 1996).
0
10
20
30
40
50
60
Metal Glass Paper Plastic Organic Ash and dirt
Percen
t
Single-story poorer residential areas Wealthier residential area
Page 10
WHAT A WASTE: SOLID WASTE MANAGEMENT IN ASIA
percent per year. Wuhan City, the
capital of Hubei province, with a
population of more than 6.8
million, has an extensive industrial
base comprised of metallurgical
industries, manufacturing, textiles,
transport manufacturing, oil
processing, pharmaceuticals,
electrical equipment, construction
materials, and food industries.
According to the Environmental
Protection Department for Wuhan
City, MSW quantities have
increased from 1.19 million tonnes
in 1985 to 1.50 million tonnes in
1993 (Wei et al, 1997). Not only are
the quantities of waste increasing
commensurate with the growing
economy and expanding
population; the composition is also
shifting towards plastic and paper
packaging (see Figure 21), a
reflection of improved living
standards.
Historical waste generation
patterns of both developed and
developing countries, economic
trends, and population
predictions, and per capita
municipal solid waste generation
rates and compositions are
estimated for Asian countries in
2025. (See Figure 7.) These
estimates are conservative, but
they demonstrate that most Asian countries, particularly the low and middle income countries, will have
to deal with enormous quantities of urban waste with a changing composition in the years to come.
Figure 2 compares and contrasts the urban waste composition and the total amount of waste generated
by the current and future populations for these same countries.
The urban per capita waste generation rate for most of the low income countries will increase by
approximately 0.2 kg per day because these countries have relatively high annual GNP growth rates and
urban population growth rates. As China, India, and Mongolia become more prosperous and move away
from coal as the traditional fuel, the ash composition will greatly decrease and the percentage of
compostable organic matter will increase slightly. Packaging wastes, such as paper, plastic, and glass, will
become more predominant in the waste stream as the economies increase and the population becomes
more urbanized.
By contrast, the middle income countries should anticipate a per capita increase of about 0.3 kg per
day since their economies are predicted to grow at the highest rates and will experience significant
Figure 7: 2025 Urban Per Capita Municipal Solid Waste Generation
Country GNP Per Capita 2025 Urban 2025 Urban
in 2025 Population MSW Generation
(1995 US $) (% of Total)
1
(kg/capita/day)
Low Income 1,050 48.8 0.6-1.0
Nepal 360 34.3 0.6
Bangladesh 440 40.0 0.6
Myanmar 580 47.3 0.6
Vietnam 580 39.0 0.7
Mongolia 560 76.5 0.9
India 620 45.2 0.7
Lao PDR 850 44.5 0.8
China 1,500 54.5 0.9
Sri Lanka 1,300 42.6 1.0
Middle Income 3,390 61.1 0.8-1.5
Indonesia 2,400 60.7 1.0
Philippines 2,500 74.3 0.8
Thailand 6,650 39.1 1.5
Malaysia 9,400 72.7 1.4
High Income 41,140 88.2 1.1-4.5
Korea, Republic of 17,600 93.7 1.4
Hong Kong 31,000 97.3 4.5
Singapore 36,000 100.0 1.1
Japan 53,500 84.9 1.3
1
United Nations, 1995 See Figure 3 to compare to current rates.
Page 11
WHAT A WASTE: SOLID WASTE MANAGEMENT IN ASIA
0.00
500,000.00
1,000,000.00
1,500,000.00
2,000,000.00
2,500,000.00
3,000,000.00
Low income Middle income High income
Current 2025
0.00
200,000.00
400,000.00
600,000.00
800,000.00
1,000,000.00
1,200,000.00
1,400,000.00
Low income Middle income High income
Current 2025
Figure 8: Total Waste Quantities and Volumes Generated by Low, Middle and High Income Countries (per day)
population growth in the urban sector. Indonesia and the Philippines will be producing significant
quantities of waste, which will require management with a still relatively small per capita GNP. Although
Thailand and Malaysia will have the highest per capita waste production rates, they should have stronger
economies and more resources to begin implementing integrated solid waste management plans. Overall,
the waste composition is predicted to become even more variable as the percentage of compostable matter
declines, and packaging wastes, especially paper and plastic, increase.
As a whole, urban populations from low and middle income countries will triple their current rate of
municipal solid waste generation over the next 25 years. Nepal, Bangladesh, Myanmar, Vietnam, Lao
PDR, and India can each expect their urban waste quantities to increase by about four to six times the
current amount. By 2025, the low income countries will generate more than twice as much municipal
waste than all of the middle and high income countries combined—approximately 480 million tonnes of
waste per year. Such a dramatic increase will place enormous stress on limited financial resources and
inadequate waste management systems.
The per capita municipal solid waste generation rate in high income countries is expected to remain
stable or even decrease slightly due to the strengthening of waste minimization programs. The total amount
of waste generated in 2025 will increase by a relatively small amount—about 1 million tonnes per day—
compared to the current waste quantities. Construction activity in Hong Kong is expected to continue.
No immediate proposals are underway regarding how to reduce construction and demolition wastes.
Thus, wastes from this sector will remain high and keep contributing significantly to the municipal waste
generation rate. Singapore and Japan both have the lowest waste generation rates of all the high income
countries and even some of the middle income countries. However, their rates may reflect definition
inconsistencies rather than waste minimization practices. Although these two countries have implemented
integrated solid waste management plans, it is unlikely that they will significantly reduce their waste
quantities below current levels. The overall MSW composition for high income countries is predicted to
be relatively stable; only a slight decrease is expected in metal and glass wastes and increases should
occur in plastic, paper and compostable wastes.
A different trend emerges when comparing waste amounts in terms of volume. Figure 8 shows average
waste densities of 500 kg/m3, 300 kg/m3, and 150 kg/m3 were used to calculate the volume of waste
generated for low, medium, and high income countries, respectively. Whereas the low income countries
Volume (m
3
) Mass (tonnes)
Page 12
WHAT A WASTE: SOLID WASTE MANAGEMENT IN ASIA
currently produce the highest quantity of waste on a mass basis, the high income countries generate the
most waste on a volumetric basis. This increase in
volume is a result of paper, plastics, bulky wastes, and
other multi-material packaging prevalent in the waste
streams of wealthier and more urbanized countries.
Low and middle income countries have a larger
percentage of high density organic matter and ash
residues in their waste streams which weigh more, but
do not take up as much space, as discarded packaging
materials and household goods.
In 2025, the high income countries are expected to
generate about the same quantity of wastes, in terms
of both mass and volume. Low income countries will
be the largest generator of wastes on a mass basis, and
will also surpass the total volume of waste produced
by the high income countries. The increasing
percentage of plastic and paper materials in the waste
stream will contribute to the growing waste volume.
In the next 25 years, both low and middle income
countries will experience about a three-fold increase
in their overall waste quantities and volumes, while
South Korea, Hong Kong, Singapore, and Japan will
stay relatively constant.
There is little doubt that the low and middle income
countries of Asia are following a development path
similar to the United States. (See Figure 2.)
Compounding this is the fact that much of Asia’s urban
growth is occurring in very large cities, which
exacerbates waste disposal and collection problems.
3.0 CONSUMER SOCIETIES
Industrialized countries comprise only 16 percent
of the world’s population, but they currently consume
approximately 75 percent of global paper production.
As shown in Figure 9, India, Indonesia, and China are
three of the world’s four most populous countries and
among the lowest consumers of paper per capita.
However, as their GNP and urban populations grow,
their paper consumption and related packaging wastes
will also increase. If they follow industrialized
countries, their paper requirements will be enormous.
According to a 1992 study by the Indonesian Environmental Forum (Djuweng, 1997), Indonesian per
capita paper consumption rose by 11.2 percent between 1981 and 1989. To meet local and international
market demands and to fulfill its intention of becoming the world’s largest pulp and paper producer,
Figure 9: Global Paper Consumption Rates (1995)
Country Per capita Per capita GNP
2
Paper Consumption
1
(1995 US $)
(kg/year)
USA 313 26,980
Japan 225 39,640
Hong Kong 220 22,990
Germany 190 27,510
United Kingdom 170 18,700
Australia 152 18,720
South Korea 128 9,700
Malaysia 62 3,890
Chile 39 4,160
Poland 31 2,790
Russia 30 2,240
Thailand 30 2,740
Brazil 28 3,640
Bulgaria 20 1,330
China 17 620
Egypt 11 790
Indonesia 10 980
Nicaragua 4 380
India 3 340
Nigeria 3 260
Ghana 1 390
Lao PDR 1 350
Vietnam 1 240
1
Djuweng, 1997
2
World Bank, 1997b
Page 13
WHAT A WASTE: SOLID WASTE MANAGEMENT IN ASIA
Figure 10: 1996 Per Capita Coca-Cola Consumption
and Market Populations
Market Population Per capita
(millions) consumption*
Indonesia is planning to produce 13.2 million tonnes of pulp and 32.7 million tonnes of paper annually by
2000.
As countries become richer and more urbanized, their waste composition changes. The substantial
increase in use of paper and paper packaging is probably the most obvious change. The next most significant
change is a much higher proportion of plastics, multimaterial items, and “consumer products” and their
related packaging materials.
More newspapers and magazines (along with corresponding increases in advertising), fast-service
restaurants, single-serving beverages, disposable diapers, more packaged foods, and more mass produced
products are all byproducts of widespread increases in local “disposable incomes.” A negative side of
greater affluence is that it brings with it more waste, of higher volume (making waste more expensive to
collect). Often, increased use of plastic waste and food packaging results in a related rise in the amount of
litter.
The rate of change in MSW quantities and composition in Asia is unprecedented. As lifestyles rapidly
change, the related conveniences and products—mobile phones, electronics , polyvinyl chloride plastic
(PVC) plastic, disposable diapers— pose special waste disposal challenges. Even more problematic is the
fact that in most low and middle income countries, development of waste management systems woefully
lags behind the realities of a quickly changing waste stream.
In addition, newly mobilized consumers and their market-savvy suppliers rarely consider the potential
waste management problems that go hand in hand with changing lifestyles. The Coca-Cola Company is
one telling example of how a multinational company may endeavor to increase its market share— in
this case in China, India, and Indonesia. (See Figure
10). In its 1996 Annual Report, Coca-Cola reported to
shareholders that two of its four key objectives were to
increase volume and expand its share of beverage sales
worldwide by “ investing aggressively to ensure our
products are pervasive, preferred.…”
In another part of the report, the President of the
company was quoted as saying “When I think of
Indonesia—a country on the Equator with 180 million
people, a median age of 18, and a Moslem ban on
alcohol— I feel I know what Heaven looks like” (Barnet
and Cavanagh, 1994). If the per capita consumption of
Coca-Cola goes up by just one serving a year in China,
India, and Indonesia, 2.4 billion containers would be
added to the waste stream.
McDonald’s Corporation has a similar expansion
goal:
“The sun never sets on McDonald’s, whether we’re
serving customers in the world’s great metropolitan
centers or near the picturesque rice fields carved into
the landscape of the Indonesia island of Bali,
McDonald’s is at home everywhere.” (McDonald’s
Corporation, 1997 Annual Report). In fact, McDonald’s
is actively expanding in Asia, and the company
announced plans to triple its presence in China over
the next three years. (See Figure 11.)
China 1,234 5
India 953 3
United States 266 363
Indonesia 201 9
Brazil 164 131
Japan 125 144
Philippines 69 117
Thailand 59 67
Korea, Republic of 45 72
Australia 18 308
Chile 14 291
*8-ounce servings of Company beverages per person per
year (excludes products distributed by The Minute Maid
Company)
(Coca-Cola Company, 1997)
Page 14
WHAT A WASTE: SOLID WASTE MANAGEMENT IN ASIA
4.0 B
USINESS INVOLVEMENT IN WASTE MANAGEMENT
4.1 INCREASED PARTNERSHIPS
McDonald’s and Coca Cola were mentioned previously as examples of companies that represent the
overall shift toward a “consumer society.” In pursuit of expansion, multinational corporations, with global
marketing programs, undoubtedly change and increase the overall waste stream. On the positive side,
many of the larger multinational corporations—such as McDonald’s, Coca-Cola, and Unilever—often
have progressive programs that address their specific, as well as the overall, waste stream.
By contrast, however, local national firms (e.g., bottled water vendors in Indonesia) are often even
more prolific waste generators than their international counterparts. However, the larger multinational
companies, with their global expertise, can also become powerful allies to local governments in the fight
against waste. CEMPRE, which originally started in Brazil, is a good example of this type of collaborative
partnership. (See Figure 12.)
More and more, governments are realizing that they can not handle waste management alone. To
respond to the call, many progressive companies are working as equal partners with governments in
developing comprehensive waste management programs.
4.2 EXTENDED PRODUCT RESPONSIBILITY
Extended product responsibility (EPR) is a voluntary measure, which places the onus upon the
manufacturer to reduce the environmental impacts of their product at each stage of the product’s life
cycle—that is from the time the raw materials are extracted, produced and distributed, through the end
use and final disposal phases. EPR does not consider only the manufacturers accountable for environmental
impacts; this responsibility is extended to all those involved in the product chain, from manufacturers,
suppliers, retailers, consumers, and disposers of products.
0
20
40
60
80
100
120
140
Hong Kong China Singapore Malaysia Indonesia Thailand India
Number of restaurants in 1991 Number of restaurants in 1996
Figure 11: Number of McDonald’s Restaurants, 1991 and 1996
(McDonald’s Corporation, 1997)
Page 15
WHAT A WASTE: SOLID WASTE MANAGEMENT IN ASIA
In the last few years, the governments of Germany, the Netherlands, and Sweden have each begun to
develop comprehensive frameworks for EPR. In Germany, the Ecocycle Waste Act of 1994 sets general
environmental goals for manufacturers. It provides guidelines for goods that are long-lived as well as
those that can be re-used: regarding their reusability and recyclability; for using secondary materials in
production; for indicating when products contain hazardous materials; and for returning products to
suppliers at the end of their useful lives. The Dutch government implemented a new policy that requires
distribution of life cycle assessment information at each stage for manufactured products. In 1994, Sweden
designed a new law to promote more efficient use of resources in the production, recovery, and reuse of
waste. The Swedish Ministry of the Environment and Natural Resources issued ordinances requiring
increased return and recycling of consumer packaging, scrap paper, old automobiles, and used tires. In
addition, Swedish battery manufacturers have voluntarily agreed to develop a recycling program for
nickel-cadmium batteries (Davis et al., 1997).
4.3 ENVIRONMENTAL LABELING
Environmental labeling of consumer products has helped raise environmental consciousness and
momentum throughout Organisation for Economic Co-operation and Development (OECD) countries.
Under environmental labeling programs, businesses voluntarily label their products to inform consumers
and promote products determined to be more environmentally friendly than other functionally and
competitively similar products. Environmental labeling can help achieve a number of goals, including
improving the sales or image of a labeled product; raising consumers’ environmental awareness; providing
accurate, complete information regarding product ingredients; and making manufacturers more
accountable for the environmental impacts of their products. Labeling programs are becoming more
popular. These programs have been established in numerous OECD countries: Germany, Canada, Japan,
Norway, Sweden, Finland, Austria, Portugal, and France (OECD, 1991).
In practice, however, the operation of labeling programs is more difficult than initially anticipated.
Problems include the difficulty in assessing the entire life cycle of the product in a comprehensive way;
becoming self-financed; or establishing product categories. Despite these difficulties, labeling of consumer
Figure 12: CEMPRE - Business Involvement in Municipal Solid Waste
The Brazilian Business Commitment for Recycling (CEMPRE) is a non-profit trade association that promotes recycling as a component of integrated
waste management. Established in 1992, CEMPRE’s members include a wide range of local and international companies, i.e., Brahma, Coca-Cola,
Danone, Entrapa, Gessy-Lever, Mercedes-Benz, Nestle, Paraibuna, Procter & Gamble, Souza Cruz, Suzano, Tetra Pak, and Vega. The companies
came together to ensure that their perspective on solid waste (particularly packaging issues) was considered by waste planners, and to help local
governments in their waste management efforts.
CEMPRE educates the general public about waste and recycling through technical research, newsletters, data banks, and seminars. In addition, the
organization provides, via the World Wide Web, tips on how to sell recyclable material; economic indicators on, and technical aspects of, waste
collection and recycling; and a database on packaging and the environment (ECODATA). CEMPRE’s programs are directed principally at mayors,
directors of companies, academics, and non-governmental organizations. Active members have also promoted, and been granted, ISO 14001
certification, the international environmental certification system; and the Center for Packaging Technology works in partnership with the govern-
ment and the private sector to improve packaging systems.
CEMPRE’s involvement has extended beyond Brazil. Recently, the Latin American Federation of Business Associations for the Promotion of Inte-
grated Solid Waste Management was created to exchange information among its members. The Association for the Defense of the Environment and
Nature (ADAN) in Venezuela, CEMPRE/Brazil, CEMPRE/Uruguay, the Industry and Commerce Pro-Recycling Organization (ICPRO) in Puerto Rico,
and Sustenta in Mexico, have formed a partnership.
Homepage: www.cempre.org.br
Page 16
WHAT A WASTE: SOLID WASTE MANAGEMENT IN ASIA
products has grown among countries and may potentially serve as an effective tool for environmental
protection. To date, no studies quantify the effect of environmental labels on product sales or the subsequent
environmental impact. However, a qualitative study of the German labeling program conducted by
Environmental Data Services, Inc., in 1988 concluded that the environmental label fostered environmental
awareness among consumers, expanded consumers’ choice of environmentally friendlier products,
stimulated the development of products with lesser environmental impact, and thus reduced waste,
pollution, and domestic waste quantities (OECD, 1991).
4.4 WASTE EXCHANGES
Waste exchanges provide another practical way for businesses and industries to divert waste from
disposal to a beneficial use. More than 50 waste exchanges exist in major centers across North America—
such as New York, Chicago, and Toronto—and in most cases are provided as a free service to industries.
Waste lists are published three to four times a year, some are updated monthly, and most exchanges have
web sites on the Internet with links to other exchanges. Through waste exchanges, companies save
thousands of dollars in avoided disposal costs or in obtaining raw materials at reduced prices. According
to Dr. Bob Laughlin, former director of the oldest waste exchange in North America, the Canadian Waste
Materials Exchange, materials listed on the exchange have a 20 percent chance of becoming diverted for
useful purposes. It is also clear that Internet exposure is helping to increase the exchange rates (Buggeln,
1998).
Waste exchanges and industry response to projected waste quantities suggest that East Asian countries
may benefit from working cooperatively in establishing secondary materials markets and from instituting
consistent product and packaging design standards.
4.5 PULP AND PAPER
Perhaps the next most important area for strengthened partnerships between business and government
is in the pulp and paper industry. Businesses are undoubtedly aware of the huge potential Asian market.
The pulp and paper industry should not be expected
to reduce the growth of their products voluntarily;
indeed, these industries have a natural desire to expand
their markets. To meet the needs of business, Asian
governments should aim for judicious use of legislation
and market reforms to reduce resource consumption
and waste generation rates, without impinging on
economic growth. Paper is a good place to start.
Countries such as China, Indonesia, and the
Philippines are well positioned to adopt more
progressive tax measures because their government
revenue bases are still relatively new. For example, in
the United States, (a country that has a more established
tax regime that is more difficult to modify), every tax
dollar that is shifted from income and investment and
placed toward resource use and pollution generation
enables the economy to gain an additional 45 to 80 cents
beyond the revenue replaced in the form of additional
work and investment and in environmental damage
averted (Sitarz, 1998).
Figure 13: Results of Survey Asking Whether
Respondents Felt That Their Health Was Affected
by Environmental Problems
Country Percentage of respondents
who said a great deal or a fair amount
India 94
China 93
Hungary 92
Chile 88
South Korea 88
Peru 87
Poland 84
Italy 83
Ukraine 80
(Anderson and Smith, 1997)
Page 17
WHAT A WASTE: SOLID WASTE MANAGEMENT IN ASIA
51
39
30
23
15
23
21
27
13
18
30
41
47
52
60
50
44
29
42
19
India
Peru
China
Italy
South Korea
United States
Chile
Ukraine
Poland
Hungary
Percent who strongly agree Percent who somewhat agree
Figure 14: Results of Survey Question Asking Whether Respondents
Would Contribute Part of Their Income if They Were Certain the Money
Would be Used to Prevent Environmental Pollution
(Anderson and Smith, 1997)
Urban regions in Asia
should begin to view their
“urban ore” as an opportunity,
as much as the disposal
liability it now represents. For
example, the Beijing or Jakarta
regions in 2025 will produce
more paper and metal than
the world’s largest
manufacturing facilities.
Robust, fair, and long-term
partnerships should be sought
with receptive resource
manufacturers to incorporate
these materials.
5.0 ENVIRONMENTAL
AND
HEALTH
IMPACTS OF
IMPROPER SOLID
WASTE
MANAGEMENT
Improper solid waste
management causes all types
of pollution: air, soil, and
water. Indiscriminate
dumping of wastes
contaminates surface and
ground water supplies. In
urban areas, solid waste clogs
drains, creating stagnant
water for insect breeding and
floods during rainy seasons.
Uncontrolled burning of wastes and improper incineration contributes significantly to urban air pollution.
Greenhouse gases are generated from the decomposition of organic wastes in landfills, and untreated
leachate pollutes surrounding soil and water bodies. These negative environmental impacts are only a
result of solid waste disposal; they do not include the substantial environmental degradation resulting
from the extraction and processing of materials at the beginning of the product life cycle. In fact, as much
as 95 percent of an item’s environmental impact occurs before it is discarded as MSW.
Health and safety issues also arise from improper solid waste management. Human fecal matter is
commonly found in municipal waste. Insect and rodent vectors are attracted to the waste and can spread
diseases such as cholera and dengue fever. Using water polluted by solid waste for bathing, food irrigation,
and drinking water can also expose individuals to disease organisms and other contaminants. The U.S.
Page 18
WHAT A WASTE: SOLID WASTE MANAGEMENT IN ASIA
Public Health Service identified 22 human diseases that are linked to improper solid waste management
(Hanks, 1967. Cited in Tchobanoglous et al., 1993). Waste workers and pickers in developing countries
are seldom protected from direct contact and injury; and the co-disposal of hazardous and medical wastes
with municipal wastes poses serious health threat. Exhaust fumes from waste collection vehicles, dust
stemming from disposal practices, and open burning of waste also contribute to overall health problems.
People know that poor sanitation affects their health, and nowhere is this link more apparent than in
low income countries. Perhaps surprisingly, low income countries are also the most willing to pay for
environmental improvements. Environics International Ltd. surveyed 24 countries, asking whether
respondents believed that their health was affected by environmental problems. (See Figure 14.) India,
China, and South Korea ranked among the top five countries that indicated their health was affected a
great deal or a fair amount, with a response of 94, 93, and 88 percent, respectively. (Other Asian countries
were not included in the survey). Figure 14 shows that these same countries also showed the highest
positive response to the question of whether they would agree to contribute part of their income if they
were certain the money would be used to prevent environmental pollution.
6.0 INTEGRATED SOLID WASTE MANAGEMENT
Integrated solid waste management (ISWM) is defined by Tchobanoglous et al. (1993) as the selection
and application of appropriate techniques, technologies, and management programs to achieve specific
waste management objectives and goals. Understanding the inter-relationships among various waste
activities makes it possible to create an ISWM plan where individual components complement one another.
The UNEP International Environmental Technology Centre (1996) describes the importance of viewing
solid waste management from an integrated approach:
• Some problems can be solved more easily in combination with other aspects of the waste system
than individually;
• Adjustments to one area of the waste system can disrupt existing practices in another area, unless
the changes are made in a coordinated manner;
• Integration allows for capacity or resources to be completely used; economies of scale for equipment
or management infrastructure can often only be achieved when all of the waste in a region is managed
as part of a single system;
• Public, private, and informal sectors can be included in the waste management plan;
• An ISWM plan helps identify and select low cost alternatives;
• Some waste activities cannot handle any charges, some will always be net expenses, while others
may show a profit. Without an ISWM plan, some revenue-producing activities are “skimmed off”
and treated as profitable, while activities related to maintenance of public health and safety do not
receive adequate funding and are managed insufficiently.
Waste hierarchies are usually established to identify key elements of an ISWM plan. The general
waste hierarchy accepted by industrialized countries is comprised of the following order:
• reduce
• reuse
• recycle
• recover waste transformation through physical, biological, or chemical processes (e.g., composting,
incineration)
• landfilling
Page 19
WHAT A WASTE: SOLID WASTE MANAGEMENT IN ASIA
Figure 15: Comparison Of Typical Solid Waste Management Practices
Activity Low income Middle income High income
Source reduction No organized programs, but reuse and Some discussion of source reduction, Organized education programs are
low per capita waste generation rates but rarely incorporated in to any beginning to emphasize source reduction
are common. organized program. and reuse of materials.
Collection Sporadic and inefficient. Improved service and increased Collection rate greater than 90 percent.
Service is limited to high visibility collection from residential areas. Compactor trucks and highly mechanized
areas, the wealthy, and businesses Larger vehicle fleet and vehicles are common.
willing to pay. more mechanization.
Recycling Most recycling is through the Informal sector still involved, Recyclable material collection services
informal sector and waste picking. some high technology sorting and high technology sorting
Mainly localized markets and imports and processing facilities. and processing facilities.
of materials for recycling. Materials are often imported Increasing attention towards long-term
for recycling. markets.
Composting Rarely undertaken formally even Large composting plants are Becoming more popular at both backyard
though the waste stream has a high generally unsuccessful, and large-scale facilities. Waste stream
percentage of organic material. some small-scale composting has a smaller portion of compostables than
projects are more sustainable. low and middle income countries.
Incineration Not common or successful because Some incinerators are used, Prevalent in areas with high land costs.
of high capital and operation costs, but experiencing financial and Most incinerators have some form of
high moisture content in the waste, operational difficulties; environmental controls and
and high percentage of inerts. not as common as high income some type of energy recovery system.
countries.
Landfilling Low-technology sites, usually Some controlled and sanitary landfills Sanitary landfills with a combination of
open dumping of wastes. with some environmental controls. liners, leak detection, leachate collection
Open dumping is still common. systems, and gas collection and treatment
systems.
Costs Collection costs represent 80 Collection costs represent 50 to 80 Collection costs can represent
to 90 percent of the municipal percent of the municipal solid waste less than 10 percent of the budget.
solid waste management budget. management budget. Waste fees Large budget allocations to
Waste fees are regulated by some are regulated by some local and intermediate waste treatment
local governments, but the fee national governments, more facilities. Upfront community
collection system is very inefficient. innovation in fee collection. participation reduces costs and increases
options available to waste planners (e.g.,
recycling and composting).
Page 20
WHAT A WASTE: SOLID WASTE MANAGEMENT IN ASIA
Despite progress in a few countries, fundamental environmental, financial, institutional and social
problems still exist within all components of the waste systems in low and middle income countries of
Asia. Recognizing that each country, region, and municipality has its own unique site-specific situations,
general observations are delineated in Figure 15.
Common to all countries is an increasing awareness about the linkages between waste generation and
resource consumption vis-a-vis sustainable development; greater involvement of the business community
in recycling; and the increasing awareness of the value of source separation and marketability of good
quality compost. Incineration is mainly used for volume reduction and its high costs will continue to
inhibit its use. Siting for landfills is difficult, which often causes sites to be established in inferior locations.
In addition, increasing attention is focused on reducing greenhouse gas emissions from waste.
6.1 SOLID WASTE MANAGEMENT COSTS
MacFarlane (1998) highlights a relationship between per capita solid waste management costs and
per capita GNP. As shown in Figure 16, cities in both developing and industrialized countries generally
do not spend more
than 0.5 percent of
their per capita
GNP on urban
waste services. The
0.5 percent GNP
value can be used
by low and middle
income countries as
a general guideline
to prepare waste
management
budgets and for
planning. These
costs, however, are
only about one-
third of the overall
total. Additional
costs are paid by
businesses and
residents, exclusive
of municipal taxes
and fees,
Hoornweg (1992).
In Japan,
municipal
governments are
responsible for
solid waste
management
services and spent
about 2,280 billion
Figure 16: Municipal Urban Waste Services Expenditures
City, Country Year Per Capita Per capita GNP % GNP
Expenditure on SWM (US $) Spent on SWM
(US $)
New York, USA 1991 106 22,240 0.48
Toronto, Canada 1991 67 20,440 0.33
Strasbourg, France 1995 63 24,990 0.25
London, England 1991 46 16,550 0.28
Kuala Lumpur, Malaysia 1994 15.25 4,000 0.38
Budapest, Hungary 1995 13.80 4,130 0.33
São Paulo, Brazil 1989 13.32 2,540 0.52
Buenos Aires, Argentina 1989 10.15 2,160 0.47
Tallinn, Estonia 1995 8.11 3,080 0.26
Bogota, Colombia 1994 7.75 1,620 0.48
Caracas, Venezuela 1989 6.67 2,450 0.27
Riga, Latvia 1995 6 2,420 0.25
Manila, Philippines 1995 estimate 4 1,070 0.37
Bucharest, Romania 1995 2.37 1,450 0.16
Hanoi, Vietnam 1994 predict 2 250 0.80
Madras, India 1995 1.77 350 0.51
Lahore, Pakistan 1985 1.77 390 0.45
Dhaka, Bangladesh 1995 1.46 270 0.54
Accra, Ghana 1994 0.66 390 0.17
(MacFarlane, 1998)
Page 21
WHAT A WASTE: SOLID WASTE MANAGEMENT IN ASIA
yen in 1993 on general waste services, accounting for approximately 5 percent of general municipal budgets.
The breakdown of the country’s waste expenditures is shown in Figure 17. Approximately 45 percent of
the total budget is spent on intermediate treatment facilities, namely, incineration plants, compared to
only 4 percent allocated towards collection and 6 percent for final disposal.
Compared to high income countries, municipalities in low and middle income countries allocate the
majority of their solid waste management budget to collection and transportation services. Final disposal
costs are minimal because disposal is usually accomplished through open dumping. In Malaysia, about
70 percent of the MSW budget is spent on the waste collection (Sinha, 1993). The City of Ahmedabad,
India, spends about 86 percent of its solid waste budget on collection, 13 percent on transportation, and
only 1 percent on final disposal (Jain and Pant, 1994). Typically, 90 percent of Indonesian solid waste
management budgets is allocated for activities related to collection: street sweeping, transportation, and
vehicle operation and maintenance. If a sanitary landfill is used for final disposal, collection costs decrease
to about 80 percent (Cointreau-Levine et al., 1994).
Per capita and per ton waste management expenses of municipal governments have increased every
year in Japan, as shown in Figure 18. According to a 1992 Japanese survey of about 3,250 municipalities,
35 percent of the respondents imposed charges for general waste management services and 636 municipal
governments have adopted a fee structure, whereby the charges increase in relation to the amount of
waste disposed. Revenues from waste fees cover only 4 percent of the total management expenses.
In low and middle income countries, some municipalities attempt to directly charge residents and
commercial enterprises for waste services. Waste fees are often regulated by the local government and
officially collected through a variety of forms, such as a general household sanitation fee, environment
fee, or included in the water and electricity bill. Household and commercial waste service fees vary between
cities and countries, as shown in Figure 19. Certain cities collect fees based on the amount of waste
generated. Others only charge a flat rate per month or year. By contrast, some cities do not collect any fees
at all; they completely subsidize solid waste services through general funds. Even when waste fees or
taxes are imposed by the local government, waste managers often complain that fees are inadequate to
cover the costs of waste services, the fee collection system is inefficient or unsupervised and subject to
Figure 17: Japanese Expenditures for Solid Waste Management Services (1993)
Construction and repair expenses Operation and maintenance expenses
Intermediate Final Collection Intermediate Final Purchase Consignment Others
treatment disposal and treatment disposal of
Facilities plants Others Research Personnel transportation vehicles, etc.
828,712 108,300 26,274 18,672 619,482 85,545 190,419 39,474 18,646 281,327 66,494
(Japan Waste Management Association, 1996)
Figure 18: Japan’s Solid Waste Management Expenses
1986 1987 1988 1989 1990 1991 1992 1993
Expenses per capita (yen/capita/year) 8,554 8,898 9,419 10,257 11,112 12,795 14,818 18,272
Expenses per disposal amount (yen/ton/year) 24,253 24,165 24,583 25,949 28,107 31,924 37,591 46,280
(Japan Waste Management Association, 1996)
Page 22
WHAT A WASTE: SOLID WASTE MANAGEMENT IN ASIA
illegal practices, or that
collected money is not
transferred directly to the
waste management
department, or that money is
used for purposes other than
solid waste management.
All residential areas in
Jakarta are required to pay
for primary waste collection,
even if wastes are not
adequately or regularly
collected. The waste
collection fees are
configured based upon the
community’s affluence as
well as the desired quality of
service. The system places
poorer residents at a
disadvantage because the
quality of their primary
collection service suffers
from the small revenues
generated. Local
governments also collect
retribution fees to cover the
costs of transportation and
final disposal. Although
regulations are in place to
mandate the amounts to be
paid by various waste-
generating sources, the
retribution fees actually
collected are very low. In
Figure 19: Solid Waste Management Fees for Various Cities and Countries
City, Country Household and Commercial Fees
Ulaanbaatar, Mongolia
1
US $0.15 to 0.25/apartment/month US $0.50 to 0.85/peri-urban
household/month Two main hotels each pay $8.10 and $18.77 per
month per occupant, average 30 occupants
Hanoi, Vietnam
2
US $0.55/person/year
Dhaka, Bangladesh
3
Less than US $0.63/person/year, residents pay a Conservancy Tax
for solid waste management
Vientiane, Lao
4
US $12 to 216/household/year US $360 to 960/non-governmental
commercial organization/year
Chennai (Madras), India
5
Residents and businesses do not pay any direct waste fees, pay only
property tax. Some households pay NGOs about Rs 15 to 20 per month
for primary collection services.
Delhi, India
5
Proposed system where homeowner has to pay a fixed amount of Rs
15 to 20 per month for collection services.
Beijing, China
6
US $3 to 7.20/household/year
Shanghai, China
6
Residents do not pay any direct waste fees.
Hong Kong
6
Private and commercial establishments do not pay any direct waste
fees.
Jakarta, Indonesia
6
US $1.80 to 9.60/household/year
Denpasar, Indonesia
6
US $6/household/year
Yangon, Myanmar
7
Waste disposal tax is paid.
Thailand
8
Public Health Act (1992) empowers local authorities to set up solid
waste collection fees for households, commercial enterprises, markets,
and industry according to fees announced in the Act.
1
World Bank, 1998c
2
URENCO, 1995
3
World Bank, 1998a
4
UNDP/World Bank Water and Sanitation Program, 1998
5
Environmental Resource Management (ERM) India, 1998
6
Johannessen, 1998
7
Tin et al., 1995
8
Public Health Act (1992) B.E. 2535, Thailand
Page 23
WHAT A WASTE: SOLID WASTE MANAGEMENT IN ASIA
Jakarta, only 1 percent of the waste fees is transferred to the Cleansing Agency. To make up the difference
in missing fees, the city uses its general fund to pay for this stage of waste management. The Cleansing
Agency tries to collect door-to-door, but the system is seriously flawed because:
• collectors are few and part-time
• collectors lack incentive
• money passes through the hands of at least six agencies
• Cleansing Agency does not automatically keep the revenues (Porter, 1996)
Even if fees are imposed on the public for waste management services, they are usually priced on the
basis of direct costs for limited activities, such as collection and landfill operations. Full cost accounting
attempts to cover externalities and includes all waste management costs that are often only partially
accounted for, or altogether ignored, such as:
1984
1988
2.00
0
0.50
1.00
1.50
1983 1985
1986
1987
1989
1990
1991
Waste Generation Rate
(kg/capita/day)
Tipping Fees
(Can $/tonne)
0
20
40
60
80
100
Guelph municipal solid waste generation rates and landfill tipping fees
(City of Guelph, 1991)
Figure 20: Reducing Waste Quantities Through User Fees
The City of Guelph, Canada increased its landfill tipping fees gradually from no charge in 1985 to Can $92 per tonne in 1991. The figure below
shows a corresponding decrease in the waste generation rates as the residents attempted to avoid disposal fees. Illegal tipping was not a cause of
the reduction; rather, a greater awareness and corresponding change in business practices were the main reasons quantities decreased. The City of
Date-shi, Japan reported a similar decrease of municipal waste quantities once disposal fees were introduced. The purpose of the new system was
to gain financial resources to build new disposal facilities. Initially the authorities met with public opposition, but are now receiving cooperation
from the local residents who have succeeded in reducing their waste quantities.
(Japan Waste Management Association, 1996)
Waste Generation Rate
(kg/capita/day)
Tipping Fees
(Can$/tonne)