- Trang chủ >>
- Khoa Học Tự Nhiên >>
- Vật lý
comparative study of nanocrystalline sno2 materials for gas sensor application
Bạn đang xem bản rút gọn của tài liệu. Xem và tải ngay bản đầy đủ của tài liệu tại đây (1.06 MB, 7 trang )
Sensors and Actuators B 137 (2009) 637–643
Contents lists available at ScienceDirect
Sensors and Actuators B: Chemical
journal homepage: www.elsevier.com/locate/snb
Comparative study of nanocrystalline SnO
2
materials for gas sensor application:
Thermal stability and catalytic activity
R.G. Pavelko
a,∗
, A.A. Vasiliev
a
, E. Llobet
a
, X. Vilanova
a
, N. Barrabés
b
, F. Medina
b
, V.G. Sevastyanov
c
a
University Rovira i Virgili, Department of Electronic, Electrical and Automatic Control Engineering (DEEEA), 43007 Tarragona, Spain
b
University Rovira i Virgili, Chemical Engineering Department (DEQ), Tarragona, Spain
c
N.S. Kurnakov Institute of General and Inorganic Chemistry RAS, Moscow, Russian Federation
article info
Article history:
Received 3 October 2008
Received in revised form
26 November 2008
Accepted 10 December 2008
Available online 24 December 2008
Keywords:
Gas sensor
SnO
2
Long-term stability
Thermal stability
Impurity level
Crystallite growth
abstract
In this paper we discuss thermal stability of tin dioxide nanoparticles and long-term stability of the
SnO
2
-based gas sensors. Relying on laser-spark element analysis and XRD analysis we compare crystallite
growth kinetics of synthesized and commercial (Sigma–Aldrich) SnO
2
with different impurity level. We
found that commercial SnO
2
nanopowder has lower thermal stability in comparison with synthesized
one, resulting in higher crystallite growth rate and poly-dispersed particle size after annealing. A special
attention is drawn to discussion of catalytic activity of the nanocrystalline materials. Using IR spectroscopy
we studied chemical composition of the annealed materials, which allowed us to reveal in the synthesized
SnO
2
intensive formation of Sn–OH bonding during annealing. We performed temperature programmed
reduction (TPR) analysis to compare the catalytic activity of the materials with and without deposited Pd
on SnO
2
. Long-term stability of the sensors made on the basis of synthesized and commercial SnO
2
was
measured as a sensor signal deviation during 590 h of operation in 0.2, 0.6 and 1.0 vol. % of propane in air
(50% RH at 20
◦
C).
© 2008 Elsevier B.V. All rights reserved.
1. Introduction
During last decades, the development of thick film materials for
tin dioxide based gas sensors enabled the fabrication of sensitive
and relatively selective gas sensors. However, long-term stability
of the sensors remains an important problem, which restricts the
application of such devices in industrial and residential gas and
fire alarm systems, electronic noses, etc. [1,2]. The attempts to
solve this problem by chemical modification of the sensing material
showed thatthis approach gives hard to predict gas-sensing proper-
ties, because each nanoparticle of SnO
2
contains only few atoms of
dopant. As a result, the number of admixture atoms is random and
can be very far from the one calculated using average concentration
values.
In this research, we apply a completely dif ferent approach
that consists of synthesizing a very pure tin dioxide material
with extremely low level of sodium, chlorine, and sulfur contam-
ination. Using different techniques (laser-spark element analysis,
thermal X-ray diffraction, temperature programmed reduction and
IR spectroscopy) we study both home-made and commercial SnO
2
nanopowders to estimate the influence of the impurities on crys-
∗
Corresponding author. Tel.: +34 977 558764; fax: +34 977 559605.
E-mail address: (R.G. Pavelko).
tallite growth rate during isothermal annealing at 700
◦
C, as well
as the catalytic activity and surface composition of SnO
2
materials.
These results are compared with the ones on long-term stability of
the sensors fabricated using the same SnO
2
materials. The role of
the impurities in the long-term stability of SnO
2
-based sensors is
discussed.
2. Experimental
2.1. Synthesis and characterization of the nanomaterials
As a precursor for the synthesis of tin dioxide nanopowder, we
used tin (IV) acetate (Sigma–Aldrich) solution in acetic acid. Tin
oxide was synthesized by the precipitation from this solution by
drop-by-drop addition of anaqueous NH
3
solution. Af ter theprecip-
itation, the sample was centrifuged and washed several times with
deionized water. Then the powder was dried carefully at 150
◦
C and
annealed at 300
◦
C for 12 h. As a reference material SnO
2
nanopow-
der fabricated by Sigma–Aldrich (p/n 549657) was used.
The impurity content in both materials was measured by
laser-spark mass-spectrometry (EMAL-2). Transmission electron
microscopy (TEM) was used to establish the morphology and to
evaluate the particle size distributions (Jeol JEM 1011, operating at
100 kV). FTIR spectra were recorded using JASCO 680 Plus spec-
trometer (absorption mode, scan times—32, resolution—2 cm
−1
)at
0925-4005/$ – see front matter © 2008 Elsevier B.V. All rights reserved.
doi:10.1016/j.snb.2008.12.025
638 R.G. Pavelko et al. / Sensors and Actuators B 137 (2009) 637–643
room temperature. The samples were mixed with KBr powder and
pressed into self-supporting disks.
The crystallite growth kinetics was studied by means of Siemens
D5000 diffractometer (Bragg-Brentano parafocusing geometry, ver-
tical  −  goniometer, Ni-filtered CuK␣ radiation) equipped with
an Anton-Paar HTK10 heating platform (TXRD). The data were
recorded during isothermal annealing at 700
◦
C after 1, 6, 18 and
30 h.Crystallite size was determined using the Fundamental Param-
eters Approach convolution algorithm implemented in the program
TOPAS 3.0 [3]. It was assumed for all samples that only crystallite
size affects the XRD peak broadening and no effects of microstrains
were observed in the XRD line width. For the calculation of the crys-
tallite size, we used three diffraction peaks corresponding to 110,
101, 121 planes of SnO
2
cassiterite structure. The calculations were
performed according to the Scherrer’s law from the net integral
width of the peaks.
Temperature programmed reduction (TPR) study of synthesized
and commercial SnO
2
was performed using a ThermoFinnigan
TPD/R/O 1100 instrument equipped with a thermal conductivity
detector (TCD). Before the TPR experiments, the samples (100 mg
of each material) were dried for 24 h in helium flow (20 ml/min) at
120
◦
C. After that, the reduction process in the reducing gas mix-
ture flow (5% H
2
in argon, flow rate was equal to 20 ml/min) was
started at room temperature and finished at 800
◦
C at a heating rate
of 10
◦
C/min. Hydrogen consumption was measured using thermal
conductivity detector. The TPR study was carried out for pure oxides
and for the oxides with deposited catalyst (1 wt. % of Pd).
N
2
physisorption adsorption–desorption isotherms at 77 K was
measured using Micromeritics ASAP 2010 surface analyzer. Before
analysis, all the samples were degassed in vacuum at 393 K for 6 h.
2.2. Sensor fabrication
Both synthesized and commercial SnO
2
materials were impreg-
nated with water solution of palladium complex Pd(NH
3
)
4
(NO
3
)
2
.
Then, the powders were dried at 110
◦
C, calcined at 300
◦
C for 10 h
and annealed at 500
◦
C in order to achieve the Pd complex decom-
position. The preset catalyst to carrier ratio was equivalent for all
sensing materials: w
Pd
= 1wt. %. Then the powders were mixed with
the solution of ethyl cellulose in terpineol to form printable ink. The
ink was deposited on sensor microheater platform, dried for 15 min
at 150
◦
C and annealed at 700
◦
C for 15 min to reach the stabilization
of the material.
The sensor platforms were made of screen-printed refractory
glass, platinum heaters and electrodes, assembled in TO-8 package.
The details can be found elsewhere [4].
2.3. Sensor characterization
The sensor responses were measured in 0.2, 0.6 and 1.0 vol. %
of propane in synthetic air at 50% RH. The gas concentrations and
gas humidification were prepared with gas mixing system Envi-
ronics 4000 at 20
◦
C. Before the measurements all sensors were
stabilized at operation temperature 450
◦
C during 100 h. The first
measurements, taken for zero point, were carried out after the sen-
sor stabilization, then after 330, 460 and 590 h of operation. The
sensors were exposed to the target gas during 10 min, which was
followed by 10 min exposition to pure carrier gas (synthetic air, 50%
RH). The sensor signal was defined as a ratio R
air
/R
gas
, where R
gas
is the sensing layer resistance in target gas atmosphere and R
air
is the resistance in pure carrier gas. Long term stability was esti-
mated as a total deviation of sensor signal after certain periods
of time and was defined as ((S
n
− S
n−1
)/S
n−1
) × 100%, where S
n
is sensor signal after 330, 460 or 590 h and S
n−1
is the previous sen-
sor (e.g. (S
330
− S
0
)/S
0
, where S
0
and S
330
are sensor signals after the
stabilization and 330 h of operation respectively).
Table 1
Concentration of main impurities in SnO
2
materials.
SnO
2
material Impurity content (wt. %)
Na Cl S
Synthesized 0.010 0.009 0.001
Commercial 0.228 0.328 0.011
3. Results and discussion
3.1. Material properties
The impurity level of synthesized and commercial SnO
2
was
estimated by means of laser spark mass-spectrometry for more
than 20 widespread elements. It was found that commercial mate-
rial is highly contaminated with Na and Cl ions (Table 1). High level
of contaminations is related, probably, with the use of tin chlo-
ride and sodium compounds asprecursor and precipitating reagent,
respectively, in the preparation process of tin dioxide nanopowder
used by Sigma–Aldrich. The material did not become notably purer
even after six-fold washing in hot deionized water. Therefore, we
can conclude that byproducts of the SnO
2
synthesis are partially
incorporated in the crystalline lattice or tight pores of the material
and could not be removed completely using conventional chemical
methods.
Synthesized and commercial SnO
2
have BET surface area of
148 m
2
/g and 17m
2
/g, respectively, which corresponds to parti-
cle sizes of 3 nm for synthesized and 26 nm for commercial SnO
2
(calculated assuming spherical particle shape).
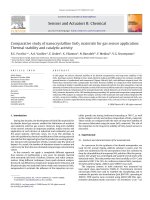
TEM investigation of the oxides shows that synthesized SnO
2
consists of uniform particles with mean diameter 3–5 nm (Fig. 1).
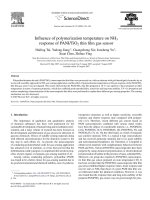
Particles of commercial SnO
2
are polydisperse: the least diameter
is ∼10 nm, while the largest is ∼70 nm (Fig. 2a). These results are in
good agreement with BET area of the materials.
Both materials have cassiterite type crystalline structure. The
mean crystallite size of SnO
2
nanopowders before heat treatment,
calculated using TOPAS sof tware, was equal to 1.3 and 30 nm for
synthesized and commercial SnO
2
, respectively. The temperature
range for TXRD study of crystallite growth kinetics was chosen
by several reasons. The usual process of formation of metal oxide
sensing layers in semiconductor and thermocatalytic gas sensors
requires annealing at 700–800
◦
C [5]. This could be used not only
to remove carbon traces of organic vehicle, but for catalyst activa-
tion and to stabilize phases as well. The latter sometimes requires
Fig. 1. TEM image of synthesized SnO
2
(Jeol, JEM 1011).
R.G. Pavelko et al. / Sensors and Actuators B 137 (2009) 637–643 639
Fig. 2. TEM images of commercial SnO
2
before (a) and after (b) annealing at 700
◦
C
for 1 h.
several hours of annealing. In addition, the experimental error in
crystallite size calculation for commercial material was equal to
5.6% at 700
◦
C, which increases significantly at lower temperatures
due to fewer changes in crystallite size.
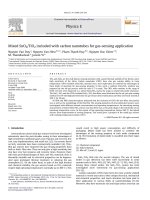
Fig. 3 shows the results of the simulation of the crystalline
growth during annealing at 700
◦
C. The simulation was performed
using a commonly assumed parabolic law describing isothermal
crystallite growth:
D
N
− D
N
= Kt, (1)
where D
0
is the initial crystallite size, D the current crystallite size,
K the rate constant, N the grain growth exponent factor and t the
annealing time.
The difference between both materials becomes more evident,
if we compare their integral crystallite growth rate. The integral
rate, calculated as D/t (where D the change in crystallite size
for 30 h of annealing and t the annealing time in hours) was found
equal to 0.026 and 0.14 nm/h for synthesized and commercial SnO
2
,
respectively. The main contribution to high integral growth rate of
commercial SnO
2
was made during the first 2 h of annealing when
the rate was by a factor of 7 higher than for the synthesized SnO
2
.
Fig. 3. Crystallitesizeofsynthesized and commercialSnO
2
as a function of annealing
time at 700
◦
C.
The difference in crystallite growth rates could be explaine d
by several factors. First, the materials have different morphology,
which complicates the comparison of the results. According to
[6] for example, porosity of nanomaterials plays significant role
in crystallite growth kinetics. The nitrogen physisorption revealed
that commercial SnO
2
has lower porosity in comparison with syn-
thesized material by a factor of ∼2.5 (pore volume equals 0.16
and 0.06 cm
3
/g for synthesized and commercial SnO
2
respectively),
which is believed should decrease thermal stability. However, the
most drastic difference between two materials is related to their
chemical composition. The Na
+
and Cl
−
content in commercial SnO
2
is more than by 20 times higher in comparison with synthesized
one. And it is well known that admixtures (especially with high dif-
fusion coefficient like Na
+
and Cl
−
) in a quantities as low as 10
−6
to
10
−4
at. % could notably favor grain growth by increasing the defect
density of the crystalline lattice [7].
After 30 h of isothermal annealing, TEM particle size for synthe-
sized SnO
2
equals ∼7 nm and particles remain uniform in shape,
while for commercial SnO
2
the particles are inthe range 20–150 nm.
The change in the particle size affects the electrical properties of the
material and this will have negative impact on long-term stability
of the sensor [8].
In addition, we found that after 1 h of isothermal annealing, a
new phase appears on the surface of commercial SnO
2
particles
(Fig. 2b). This new phase is a result of the thermal migration of
impurities (Na and Cl ions), which presence on the surface can lead
to inhibition of catalytic processes [9].
FTIR spectroscopy of nanomaterials can provide useful informa-
tion about chemical modification of the solid. The spectra were
recorded on JASCO 680 Plus spectrometer at room temperature
for SnO
2
samples, which undergone isothermal annealing at 700
◦
C
during 1, 6, 18 and 30 h. The spectra of commercial and synthesized
powders are shown in Fig. 4.
While the spectrum of commercial SnO
2
is quite simple with
only one intense band between 400 and 800 cm
−1
, the spectrum
of synthesized SnO
2
shows several intense bands: a broad one
between 400 and 850 cm
−1
, a peak around 1620 cm
−1
, and another
broad band at 2000–3650 cm
−1
. The first band is assigned to dif-
ferent stretching vibration of Sn–O bond and during isothermal
annealing. The maximum of the band shifts to the higher wave
numbers that is from 590 to 630 cm
−1
after 30 h of annealing at
700
◦
C. The right shoulder of the peak also becomes less intense.
The similar phenomenon is observed for commercial material. A
weak shoulder near 510 cm
−1
looses intensity with annealing time,
while the peak at ∼650 cm
−1
becomes more intense.
The shoulder in the region 520–560 cm
−1
corresponds to ter-
minal vibration of Sn–O bond, whereas vibrations at higher wave
numbers can be ascribed to bridged ones [10]. Thus, a decrease
in adsorption band at around 500 cm
−1
could be a result of ter-
minal group lessening. This allows us to conclude that either
chemical modification of the surface or growth processes occur
during isothermal annealing. The following discussion will show
that the chemical modification of the surface is more signifi-
cant.
The bands in the range of 2000–3650 cm
−1
can be assigne d
to hydroxyl stretching vibrations
OH
(Sn–OH) of both, terminal
and bridged groups, and to stretching vibration in hydrogen bond
OH···O. During the annealing, the band becomes more intense and
several shoulders appear on the right and on the lef t side of the
band maximum, located at 3416 cm
−1
. The latter, together with
a small left shoulder around 3230 cm
−1
, should be ascribed to
stretching vibrations of bridged Sn–OH bond. The right shoulder
around 3545 cm
−1
is related, probably, to stretching vibrations of
terminal Sn–OH group [10]. The maximum of the band does not
shift during annealing, which indicates that new types of hydroxyl
bonding do not take place on the surface. Commercial SnO
2
has a
640 R.G. Pavelko et al. / Sensors and Actuators B 137 (2009) 637–643
Fig. 4. FTIR spectra in the range 400–4000 cm
−1
of synthesized (a) and commercial
(b) SnO
2
after drying and after isothermal annealing at 700
◦
C for 1, 6, 18 and 30 h.
peak in the same range 3250–3650 cm
−1
with much lower inten-
sity, which is an evidence of lower concentration of hydroxyl groups
on the surface. The broad nature of the band indicates that OH
groups are bonded by several modes, including Sn–OH (termi-
nal groups), Sn–(OH)–Sn (bridged groups) and hydrogen bonding
Sn–O···HO–Sn.
The band around 1620 cm
−1
corresponds to the bending mode
of ligand-bonded molecular water (Fig. 5a). It is known that
monomeric, dimeric and polymeric water molecules have their
deformation modes at 1600, 1620 and 1633 cm
−1
, respectively [11].
The evolution of the peak shape with annealing time indicates that,
after approximately 6 h, there are mostly dimers and polymers of
water molecules on the SnO
2
surface (1616 and 1635 cm
−1
). The
same situation is observed with commercial material. The weak
peak at 1620 cm
−1
is a superposition of two peaks at 1616 and
1635 cm
−1
. However, the quantity of adsorbed water increases with
annealing time only in the case of synthesized SnO
2
, whereas com-
mercial material loses molecular water during annealing (decrease
in peak intensity).
In a range of 900–1250 cm
−1
, a broad intense band appears after
1 hof annealing (Fig. 5b). According to numerous investigations, this
band corresponds to the deformation mode ı
OH
(Sn–OH) of termi-
nal OH groups [10]. It is remarkable that the spectrum of the SnO
2
powder dried after wet synthesis does not have any corresponding
vibration mode. The intensity of the band increases with annealing
time. The band maximum at 1040–1045 cm
−1
does not shift during
heat treatment.
Fig. 5. FTIR spectra in the range 1300–1900 cm
−1
(a) and 850–1300 cm
−1
(b) of syn-
thesized SnO
2
after drying and after isothermal annealing at 700
◦
C for 1, 6, 18 and
30 h.
Summarising, the FTIR spectra manifest that surfaces of synthe-
sized and commercial SnO
2
are very different from the chemical
point of view. The change in spectrum shape of synthesized SnO
2
is
mostly due to the intensive formation of Sn–OH groups and accu-
mulation of molecular water during annealing. Taking into account
that desorption of chemisorbed water in the range of 280–400
◦
C
results in formation of catalytically active oxygen species (e.g. O
2
−
,
O
−
and O
2−
) the synthesized SnO
2
probably will demonstrate in the
same temperature range high catalytic activity in oxidation reaction
and as a result higher sensitivity to reducing gases [12].
To investigate the oxidation activity of synthesized and com-
mercial materials, we performed TPR study of SnO
2
with and
without Pd (Fig. 6). TPR profile of the synthesized SnO
2
displays
one broad intense peak at 360
◦
C, followed by the onset of bulk
reduction (that is the reduction of SnO
2
particle bulk) starting from
550
◦
C. Commercial SnO
2
shows a different profile with small peak
around 200
◦
C and bulk reduction starting from 450
◦
C. The low
temperature reduction peak can be attributed to the reduction of
surface and subsurface of SnO
2
, while the bulk reduction of SnO
2
is observed at higher temperature (>500
◦
C). From the results one
can easily see that synthesized SnO
2
demonstrates a higher surface
reduction compared with the commercial one. This indicates the
presence of high amount of active oxidation species, which prob-
ably form due to thermal desorption of chemisorbed water. The
presence of the latter in the synthesized SnO
2
was proved by FTIR
studies.
R.G. Pavelko et al. / Sensors and Actuators B 137 (2009) 637–643 641
Fig. 6. TPR profiles of pure (dash line) and with deposited Pd catalyst SnO
2
(bold
line).
Whereas the deposition of 1% of Pd does not affect significantly
the reduction profile of the commercial SnO
2
(a slight increase in
the reduction of surface species is observed), the profile of syn-
thesized Pd-SnO
2
solid shows a clear shift to lower temperatures.
This reduction peak is shifted from 360
◦
Cto200
◦
C. However,
the reduction peak for bulk SnO
2
species remained constant. The
H
2
oxidation already starts at 100
◦
C and goes on up to 400
◦
C,
demonstrating significant decrease in activation energy of oxi-
dation processes. This fact is only observed for the synthesized
samples.
Thus, the TPR study has proved our assumption about high cat-
alytic activity of synthesized SnO
2
and it becomes apparent that
high content of chemisorbed water could be an evidence for high
oxidation ability of material at elevated temperatures.
3.2. Sensor characterization
Long-term stability measurements were performed for 590 h.
All sensors underwent phase stabilization at operating tempera-
ture 450
◦
C during 100 h. Then sensors were exposed to different
propane concentrations: 0.2, 0.6 and 1.0 vol. % in humid air (50%
RH at RT). The first measurement was carried out just after stabi-
lization, which is considered as zero point for long-term stability
experiment, then after 330, 460 and 590 h. We used sensing mate-
rials on the basis of synthesized and commercial SnO
2
with 1 wt. %
of Pd.
As it can be seen from Fig. 7, the responses of the sensors differ
greatly with sensing materials. Sensors on the basis of synthesized
SnO
2
have thehighest resistance in humid air, which suggests lower
concentration of free charge carries in the bulk material. The lat-
ter could be a result of high surface population with the electron
acceptors like oxygen species: O
2
−
and O
−
which is a result of
chemisorbed water desorption. On the other hand, the resistance
under target gas is of the same order of magnitude as the resistance
of the sensors on the basis of commercial SnO
2
The use of synthesized SnO
2
results in the highest signals
(defined as R
air
/R
gas
) to all propane concentrations. For example,
the signal to 0.4% of propane in synthetic air at 50% RH after sensor
stabilization is equal to 42 for synthesized SnO
2
and 4.5 for com-
mercial SnO
2
. The drastic difference between both materials can be
explained by higher catalytic activity and high specific surface of
the synthesized material.
A distinctive feature of commercial SnO
2
is that the signals to all
propane concentrations increase with operation time. The crystal-
Fig. 7. Sensor layer resistance of synthesized (a) and commercial (b) SnO
2
with 1 wt.
% of Pd to 0.4% of propane in synthetic air at 50% RH.
lite growth cannot lead to this phenomenon. We explain this relying
on TEM results, which demonstrated the formation of a new phase
on the SnO
2
surface (Fig. 2b). After 100 h of phase stabilization at
450
◦
C, chlorine impurities, known as catalyst inhibitor, cover the
surface causing poor sensitivity to target gas [9]. This inhibitor, in
its turn, takes part in the oxidation processes and vacates the sur-
face with oxidation byproducts. The elimination of the inhibitor (Cl)
from the surface leads to the signal increment.
Unlike the previous, the sensing material on the basis of synthe-
sized SnO
2
demonstrates a slight decrease in signal value during
the operation. We suppose that signal decrease is a result of crys-
tallite thermal growth and surface diminution, which takes place,
without any doubts, in both sensing materials. The difference is that
impurities, apart from causing higher crystallite growth rate, lead
to the ambiguity in the surface chemistry by interacting with target
gas and its oxidation products.
Fig. 8 shows results of long-term stability measurements. The
plot reflects total signal drift defined as (S
n
− S
n−1
/S
n−1
) × 100%
(where S
n−1
is previous and S
n
is current signal after a cer-
tain operation time) against operating time for different propane
concentrations. The highest signal drift is obtained for sensing
materials on the basis of commercial SnO
2
. The highest contribu-
tion to the signal deviation for both types of sensors was observed
after 330 h of sensor operation. The total signal drift after 590 h
varies (depending on the target gas concentration) from 0.7% to
1.4% for synthesized SnO
2
and from 16% to 25% for commercial
642 R.G. Pavelko et al. / Sensors and Actuators B 137 (2009) 637–643
Fig. 8. Total signal drift depending on propane concentration against operation time
of the sensors.
SnO
2
in the concentration range under investigation. The high
stability of the synthesized material can be explained only by ther-
mal stability of nanoparticles which is a result of low impurity
content.
4. Conclusion
XRD crystallite size and TEM particle size analysis indicate the
remarkable thermal stability of synthesized SnO
2
with low impu-
rity level. On the other hand commercial SnO
2
with Na and Cl
impurities has poor thermal stability resulting in higher crystallite
growth rate and poly-dispersed particle size after annealing. It was
shown that during isothermal annealing, impurities tend to form
individual phase on the particle surface of commercial SnO
2
.
FTIR results manifest significant difference in chemical compo-
sition of the synthesized and commercial materials which mostly
due to the intensive formation of Sn–OH groups and accumulation
of molecular water after annealing. This fact can be explained by
high density of surface defect due to low particle size of synthesized
SnO
2
.
TPR experiments manifest that the synthesized material has
high catalytic activity even without deposited catalyst. This indi-
cates that desorption of chemisorbed water in the range of
280–400
◦
C results in formation of numerous oxygen species (e.g.
O
2
−
,O
−
and O
2−
), which are known as catalytically active ones in
oxidation processes.
As a result of high oxidation activity and high specific surface
area sensors made on the basis ofsynthesized SnO
2
have the highest
signals to different propane concentrations. The low impurity level
of the synthesized materials results in the lowest signal drift.
We found that crystallite growth causes signal decrease by 1%
during 590 h of operation for this material. On the other hand,
high impurity concentration in commercial material leads to signal
increase by 25% after 590 h. This indicates that, apart from crys-
tallite growth (resulting in signal decrease), impurities take part
in surface oxidation processes causing inhibition of the propane
oxidation and remarkable signal drift.
Acknowledgments
This work has been funded in part by CICyT under Grant
no. TEC2006-03671. R. Pavelko gratefully acknowledges a Ph.D.
scholarship from URV. Also authors would like to thank Dr. F.
Gispert—Guirado from the Laboratory of X-Ray Diffraction (URV,
Spain) for his contribution to XRD experiments and spectra
processing.
References
[1] Y. Ozaki, S. Suzuki, M. Morimitsu, M. Matsunaga, Enhanced long-term stability
of SnO
2
-based CO gas sensors modified by sulfuric acid treatment, Sens. Actuat.
B: Chem. 62 (2000) 220–225.
[2] C. Pijolat, B. Riviere, M. Kamionka, J.P. Viricelle, P. Breuil, Tin dioxide gas sensor
as a tool for atmospheric pollution monitoring: problems and possibilities for
improvements, J. Mater. Sci. 38 (21) (2003) 4333–4346.
[3] TOPAS. General profile and structure analysis software for powder diffraction
data. V 3.1, Bruker AXS GmbH, Karlsruhe, Germany.
[4] A.A. Vasiliev, Physical and chemical principles of the design of gas sensors
based on metal oxides and structures metal/solid electrolyte/semiconductor.
Dissertation, Doctor of Science Degree, Moscow, 2004.
[5] A.A. Vasiliev, R.G. Pavelko, S.Y. Gogish-Klushin, D.Y. Kharitonov, O.S. Gogish-
Klushina, A.V. Sokolov, A.V. Pisliakov, N.N. Samotaev, Alumina MEMS platform
for impulse semiconductor and IR optic gas sensors, Sens. Actuat. B: Chem. 132
(1) (2008) 216–223.
[6] L. Wang, X.Y. Qin, W. Xiong, L. Chen, M.G. Kong, Thermal stability and grain
growth behavior of nanocrystalline Mg
2
Si, Mater. Sci. Eng. A Struct. Mater.
Properties Microstruct. Process. 434 (1–2) (200 6) 166–170.
[7] F.J. Humphreys, M. Haterly, Recrystallization and Related Annealing Phenom-
ena, Elsevier, 2004.
[8] M.E. Franke, T.J. Koplin, U. Simon, Metal and metal oxide nanoparticles in
chemiresistors: does the nanoscale matter? Small 2 (1) (2006) 36–50.
[9] P. Gelin, M. Primet, Complete oxidation of methane at low temperature over
noble metal based catalysts: a review, Appl. Catal. B: Environ. 39 (1) (2002)
1–37.
[10] D. Amalric-Popescu, F. Bozon-Verduraz, Infrared studies on SnO
2
and Pd/SnO
2
,
Catal. Today 70 (2001).
[11] E.W. Thornton, P.G. Harrison, Tin oxide surfaces. Part 1. Surface hydroxyl groups
and the chemisorption of carbon dioxide and carbon monoxide on tin(IV) oxide,
J. Chem. Soc., Faraday Trans. 1 (71) (1975) 461–472.
[12] J.F. McAleer, P.T. Moseley, J.W. Norris, D.E. Williams, Tin dioxide gas sensors, J.
Chem. Soc., Faraday Trans. 1 (83) (1987) 1323–1346.
Biographies
Roman G. Pavelko graduated from People’s Friendship University of Russia
(Moscow) in 2003, obtained his PhD in Chemistry in 2007 at the Institute of General
and Inorganic Chemistry, (Russian Academy of Science, Moscow). At present he is
PhD student in University Rovira i Virgili (Tarragona, Spain) in the Electronic Engi-
neering Department. His research interests concern synthesis of dispersed materials,
material science, experimental and theoretical study of surface processes related to
metal oxide gas sensors.
Alexey A. Vasiliev graduated from Moscow Institute of Physics and Technology in
1980, obtained his PhD in 1986 for the “Study of the kinetics of low-temperature
reactions of atomic fluorine by ESR method”. Gained his Dr. of Science degree (habil-
itation) in solid state microelectronics in 2004 for the investigation of “Physical and
chemical principles of design of gas sensors based on metal oxide semiconductors
and MIS structures with solid electrolyte layer”. Recently he is working in Sensor
group of the University Rovira i Virgili (Tarragona, Spain) and at Russian research
center Kurchatov Institute (visiting position). Research interests are related with
the study of the kinetics and mechanisms of heterogeneous processes related with
chemical sensing, kinetics and mechanisms of electrochemical processes in liquid
and solid electrolytes.
Eduard Llobet graduated in telecommunication engineering from the Universitat
Politècnica de Catalunya (UPC), (Barcelona, Spain) in 1991, and received his PhD in
1997 from the same university. He is currently an associate professor in the Elec-
tronic Engineering Department at the Universitat Rovira i Virgili (Tarragona, Spain).
His main areas of interest are in the design of semiconductor and carbon nanotube
based gas sensors and in the application of intelligent systems to complex odor
analysis.
Xavier Vilanova graduated in telecommunication engineering from the Universi-
tat Politècnica de Catalunya (UPC), (Barcelona, Spain) in 1991, received his PhD in
1998 from the same university. He is currently an associate professor in the Elec-
tronic Engineering Department at the Universitat Rovira i Virgili (Tarragona, Spain).
His research activities are related to semiconductor gas sensors development and
characterization, as well as, gas sensors systems design.
Noelia Barrabés received MS from Chemical Engineering Department in Rovira i
Virgili University in 2006. She is currently finishing the PhD degree in chemical
engineering, working in catalysis, at the Rovira i Virgili University.
R.G. Pavelko et al. / Sensors and Actuators B 137 (2009) 637–643 643
Francesc Medina is a professor in the Department of Chemical Engineering at the
University Rovira I Virgili of Tarragona. His research interest is in the areas of mate-
rials science, catalysis, reactor design and chemical engineering.
Vladimir G. Sevastyanov is graduated from Mendeleyev University of Chemi-
cal Technology of Russia in 1964. He is a professor, head of the Department of
Physical Chemistry of Sensor Materials in the N.S. Kurnakov Institute of Gen-
eral and Inorganic Chemistry (Moscow, Russia). His research activity is related to
synthesis and investigation of volatile coordination compounds of wide range of ele-
ments (including actinides), ultra pure chemical compounds, dispersed oxides and
carbides.