- Trang chủ >>
- Khoa Học Tự Nhiên >>
- Vật lý
decoration of tio2 nanotube layers with wo3 nanocrystals for high - electrochromic activity
Bạn đang xem bản rút gọn của tài liệu. Xem và tải ngay bản đầy đủ của tài liệu tại đây (774.32 KB, 5 trang )
Decoration of TiO
2
nanotube layers with WO
3
nanocrystals
for high-electrochromic activity
A. Benoit
1
, I. Paramasivam, Y C. Nah, P. Roy, P. Schmuki
*
Department of Materials Science, WW4-LKO, University of Erlangen-Nuremberg, Martensstrasse 7, D-91058 Erlangen, Germany
article info
Article history:
Received 14 January 2009
Accepted 20 January 2009
Available online 24 January 2009
Keywords:
TiO
2
nanotubes
WO
3
nanoparticle
Electrochromism
abstract
We report a simple approach to decorate ordered TiO
2
nanotube (TiNT) layers with tungsten trioxide
nanocrystallites by the controlled hydrolysis of a WCl
6
precursor. These WO
3
nanocrystallites, when
formed, are amorphous, but can be annealed to a monoclinic crystal structure. The WO
3
crystallites on
the TiO
2
nanotube skeleton are electrochemically active, and hence ion insertion reactions are possible.
As a result, the decorated nanotube layers show remarkable enhancement of the electrochromic proper-
ties. In particular, a significantly lower threshold voltage and an increased electrochromic contrast can be
achieved compared with unloaded (neat) TiO
2
nanotube layers.
Ó 2009 Elsevier B.V. All rights reserved.
1. Introduction
Over the last years the anodic formation of ordered TiO
2
nano-
tube (TiNT) layers has created significant scientific interest (see
Refs. [1,2] for an overview). The application of these nanotube lay-
ers has been explored for example in photocatalysis [3], photo-
chromism [4], or biomedicine [5]. Due to the tubular nature and
large surface area, they were used as hosts for insertion of H
+
or
Li
+
ions [6,7], and considerably high-electrochromic contrast can
be obtained due to the nanotubular architecture. This electrochro-
mic effect is based on the fact that when electrons and ions are in-
jected under cathodic polarization, the electronic structure of TiO
2
is modified. It was reported [8,9] that the reduced form of Ti
3+
by
electron injection leads to local electronic states 0.7 eV under the
conduction band, which results in an absorption in the visible
range. TiO
2
based devices are mostly built with nanoparticulate
systems to shorten the solid-state diffusion path and time [10]. Re-
cently, we reported that this solid-state diffusion step can be dras-
tically accelerated by widening of the host TiO
2
lattice by doping
with Nb
2
O
5
[11] which also allows for the insertion of Na
+
ions.
However, other transition metal oxides, in particular WO
3
, are
typically more efficient electrochromic materials than TiO
2
, i.e.
typical electrochromic criteria such as coloration efficiency and
threshold voltage are reported to be better [12–14]. Recently our
group investigated WO
3
nanoporous structures that show a drasti-
cally enhanced electrochromic contrast, and a faster switching re-
sponse than the compact anodic WO
3
layers [15]. However, a key
drawback of pure W is that up to now no highly defined tubular
structures could be grown [15,16], and thus the full electrochromic
potential of WO
3
based nanotubular systems could not be
exploited. We showed that one strategy to overcome this problem
is anodizing Ti–W alloys [16]. By suitable substrate alloying, highly
defined mixed oxide TiO
2
–WO
3
nanotubes with strongly enhanced
electrochromic properties could be grown.
In this work, we explore another approach to combine the out-
standing WO
3
electrochromic properties with the defined mor-
phology of TiO
2
nanotubes. We show a facile route to decorate
the TiO
2
nanotubes with WO
3
nanocrystallites and demonstrate
that these decorated tubes have significantly enhanced electro-
chromic characteristics.
2. Experimental
TiO
2
nanotube layers were grown by anodic oxidation of tita-
nium foils with 99.6% purity (from Goodfellow, England) of
0.1 mm thickness. Prior to the experiments the titanium foils were
sonicated in acetone, isopropanol and methanol (for 3 min each)
followed by rinsing with deionized water and then dried in a nitro-
gen stream. Anodization was carried out using a high-voltage
potentiostat Jaissle IMP 88 using an electrolytic mixture of glycerol
(1, 2, 3-propanetriol) and water (60:40 vol%) + 0.27 M NH
4
F [17] at
30 V for 3 h. Ti samples were pressed against an O-ring in an elec-
trochemical cell where 1 cm
2
was open to the electrolyte. The set-
up [18] consisted of a three electrode configuration with a Pt gauze
as counter electrode and a Haber-Luggin capillary with Ag/AgCl as
reference electrode. The anodization process forms nanotube lay-
ers with a tube length of $1.4
l
m and a diameter of $100 nm
1388-2481/$ - see front matter Ó 2009 Elsevier B.V. All rights reserved.
doi:10.1016/j.elecom.2009.01.024
* Corresponding author. Tel.: +49 9131 852 7575; fax: +49 9131 852 7582.
E-mail address: (P. Schmuki).
1
On leave from: Université de Nantes, Nantes Atlantique Universités, Poly-
tech’Nantes, Materials Science Department, Rue Christian Pauc, BP 50609, F-44306
Nantes Cedex 3, France.
Electrochemistry Communications 11 (2009) 728–732
Contents lists available at ScienceDirect
Electrochemistry Communications
journal homepage: www.elsevier.com/locate/elecom
[17]. The TiO
2
nanotube layers were then annealed in air using a
thermal treatment in a Rapid Thermal Annealer – Jipelec JetFirst,
at 450 °C for 1 h with heating and cooling rate of 30 °C min
À1
to
form an anatase structure [17].
For WO
3
nanocrystallite deposition, WCl
6
(Aldrich 99.9%) in
powder form was dissolved in ethanol (>99.9% Purity, Sigma–Al-
drich) to obtain 0.1 M of stock solution and then further diluted
to obtain a 0.001 M solution. In this solution tungsten is very sen-
sitive to moisture (hydrolysis) and oxygen present in atmosphere.
Therefore, a fresh solution was used for each new experiment. In
order to preserve the solutions and minimize contact with air, vials
with septa and syringe are used for storage handling and dilution
of the solutions.
For tube decoration, annealed TiNT layers are placed in a beaker
containing 10 mL of the fresh 0.001 M WCl
6
solution. The color of
the solution is at this moment light green to yellow (if the solution
is fresh). Five milliliters of a mixed solution of water and ethanol
(50:50) is added to the stirred 0.001 M WCl
6
solution using a syr-
inge and the color turns to dark blue. Finally, the closed beaker is
placed in water bath. The temperature is raised slowly from
20 °Cto70°C and afterwards it is kept for 1 h at 70 °C. Now the
color turns from dark to light blue. The sample is slightly rinsed
in ethanol and dried in a nitrogen stream. The WO
3
decorated
tubes are then re-annealed at 450 °C, 1 h in the rapid thermal
annealer.
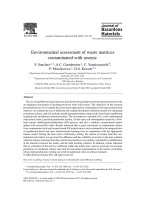
A Scanning Electron Microscopy, HITACHI SEM FE S4800, was
used to acquire micrographs of the tube morphology. The chemical
composition of the deposited materiel was analyzed using X-ray
photoelectron spectroscopy (PHI 5600 XPS Spectrometer) with Al
K
a
radiation at an incident angle of 45° to the surface normal.
XRD measurements were performed using a Philips X’Pert PRO dif-
fractometer with monochromatic Cu K
a
radiation. To characterize
the electrochemical and electrochromic behaviour of the TiO
2
nanostructures with and without WO
3
decoration, a conventional
three electrode system was used. Samples were pressed against
an O-ring with a Cu plate in an electrochemical cell. A platinum
plate and a Haber-Luggin capillary with Ag/AgCl (1 M KCl) were
used as a counter and a reference electrode, respectively. The elec-
trolyte was 0.1 M HClO
4
. The wall of the cell opposite to the sample
surface consists of a quartz glass window to allow optical measure-
ments during electrochemical cycling. Reflectance measurements
were carried out using USB 2000 Fiber Ocean Optics Spectrometer.
The cyclic voltammograms and chronoamperometric measure-
ments were performed using an Autolab PGSTAT30 Potentiostat/
Galvanostat. Optical images were recorded using a CCD camera.
3. Results and discussion
Fig. 1 shows the top view of the TiO
2
nanotube layers used in
this work before (Fig. 1a) and after the decoration with WO
3
nano-
crystallites (Fig. 1b–d). From the images after the WCl
6
treatment it
can be seen that some of the tubes are covered with a hazy very
thin layer (Fig. 1b) but most of the surface area shows open and ni-
cely decorated tubes (Fig. 1c and d) where individual WO
3
nano-
particles have a diameter of $5 nm. XRD investigations were
carried out with the decorated tubes before and after additional
annealing at 450 °C. Before annealing the XRD spectra only reveal
TiO
2
anatase peaks, after annealing clearly peaks of monoclinic
WO
3
could be detected (most characteristic at h =23°). This indi-
cates that the as deposited WO
3
crystallites are amorphous and
only the annealing treatment converts them to the crystalline
material.
In order to investigate the chemical composition and oxidation
state of WO
3
on the decorated and annealed nanotubes, XPS mea-
Fig. 1. SEM images showing top views of TiO
2
nanotubes (TiNT): (a) as grown by
anodization in a mixture of glycerol and water (60:40 vol%) + 0.2 M NH
4
F at 30 V for
3 h, (b–d) after decoration with WO
3
(WO
3
/TiNT).
A. Benoit et al. /Electrochemistry Communications 11 (2009) 728–732
729
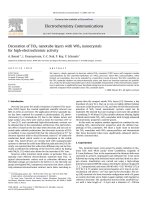
surements were performed. Fig. 2b shows an XPS survey spectrum
that indicates that the WO
3
/TiNT composite material contains Ti,
W, O and some traces of carbon. Fig. 2c shows the high resolution
XPS spectra of the W4f peak with W4f
7/2
and W4f
5/2
at 35.3 eV and
37.4 eV, respectively. Even though the determination of the exact
position of W4f was difficult because of a partial overlap with
Ti3p peak, their positions are in line with the peak positions of pure
WO
3
[19].
In order to explore ion insertion properties of the samples, elec-
trochemical and optical characterization was performed. Fig. 3a
displays the cyclic voltamograms (CVs) of TiNT, WO
3
/TiNT as-
formed and annealed at 450 °C carried out in a 0.1 M HClO
4
solu-
tion. Peaks I and II in the CVs can be ascribed to proton insertion
and extraction into and out from the host lattice [20,15]. This
insertion process can either take place into the TiO
2
or the WO
3
and may be described as TiO
2
+xe
À
+xH
+
? TiOOH or WO
3
+xe
À
+
xH
+
? H
x
WO
3
, respectively. In both cases it is associated with a
change in color of the material. Compared with neat TiNT, the
WO
3
decorated nanotubes show significantly larger current densi-
ties, which reflect the fact that proton insertion/extraction is much
more favorable in the decorated structures than in the neat tubes.
Insertion into neat nanotubes occurs under the same experimental
conditions only at potentials negative to À1.0 V [6]. For annealed
WO
3
decorated samples, the current densities are smaller than
for the ones where the WO
3
is present as amorphous material. This
indicates that the crystalline phase formed after annealing at
450 °C, shows a lower ion uptake efficiency – which is in line with
literature reports for pure WO
3
[16]. Furthermore, the onset poten-
tial for the cathodic reaction for WO
3
/TiNT (with amorphous WO
3
)
is located at $0.3 V while for annealed WO
3
/TiNT (crystalline WO
3
)
it is at $0 V. This means that insertion can be achieved at signifi-
cantly lower applied voltage for amorphous sample. It also means
that the underneath anatase skeleton of TiO
2
is sufficiently conduc-
tive to allow electrochemical switching of the WO
3
.
Fig. 3b shows the current density response with time when a
cycling pulse potential is applied between À0.5 V and 1.0 V. The
integrated current density with time (charge density) is indicative
of the amount of protons incorporated during the reactions. When
comparing the charge exchanged during cathodic and anodic reac-
tions for TiNT and WO
3
/TiNT (as-formed) – compiled in Table (in-
set in Fig. 3b) – it is clear that the WO
3
/TiNT show much higher
values in charge density. Again, after annealing at 450 °C, the
charge density is slightly decreased due to the crystallinity of the
material.
Fig. 3c shows the electrochromic effects for TiNT, WO
3
/TiNT
as-formed, and WO
3
/TiNT annealed (450 °C) during potential
switching between À0.5 V and 1.0 V. To quantify the electrochro-
mic effects, reflectance spectra were acquired. Compared with
Fig. 2. XRD patterns of annealed TiNT and WO
3
/TiNT annealed at 450 °C (a); XPS survey spectra of as-formed WO
3
/TiNT (b); detail of the W4d peak for WO
3
/TiNT (c).
730 A. Benoit et al. /Electrochemistry Communications 11 (2009) 728–732
TiNT, the decorated WO
3
/TiNT shows a strong effect as apparent
from the reflectance difference (
D
R). At a wavelength of 600 nm,
for neat TiO
2
nanotube structures only a 3% change could be ob-
tained whereas for the WO
3
loaded systems 45% for the as-formed,
and 21% for the annealed structure can be achieved. It is interesting
to note that the bleached state of annealed sample does not abso-
lutely recover to the original state after the first potential pulsing.
These findings indicate that a higher crystallinity not only affects
the insertion amount but also the electrochemical reversibility.
The response time for the as-formed WO
3
/TiNT is 3.6 s and 2.8 s
for the coloration and the bleaching, respectively, while for an-
nealed WO
3
/TiNT the values are 11.4 s and 10.1 s for coloration
and bleaching, respectively. This again is in accord with literature
that proton movement is faster in amorphous than in crystalline
WO
3
[16].
It may be noteworthy that the switching threshold voltage of
the WO
3
is in the range of À0.3 V
Ag/AgCl
. This is very close to the
flatband potential for the underneath TiO
2
(anatase) nanotubes
[21]. This means that the threshold voltage for WO
3
to a certain ex-
tent may be dominated by the switching of the underneath (n-
type) material from depletion to accumulation conditions; in other
words, electron supply (conductivity) over the TiO
2
nanotube skel-
eton may determine the switching threshold voltage. However, the
results in Fig. 3a show that a significant onset of the electrochem-
ical reaction in the WO
3
occur even at a potentials of $0V
Ag/AgCl
which shows that the nanotubes at this voltage are not entirely
in a current blocking state; i.e. are still sufficiently conducting to
allow switching of the WO
3
crystallites.
In summary, this work demonstrates how TiO
2
nanotubes can
be decorated with WO
3
nanocrystallites. The decoration signifi-
cantly enhances the contrast and insertion capacity of a TiO
2
nano-
tube based electrochromic system. Decoration of the nanotubes
with WO
3
may also have a significant impact on other TiO
2
nano-
tube applications.
Acknowledgements
The authors would like to greatly acknowledge DFG for financial
support. We extend our sincere thanks to Helga Hildebrand and
Ullrike Marten-Jahns for XPS and XRD measurements and also
to Hans Rollig and Martin Kolacyak for their valuable technical
help.
References
[1] J.M. Macak, H. Tsuchiya, A. Ghicov, K. Yasuda, R. Hahn, S. Bauer, P. Schmuki,
Curr. Opin. Solid State Mater. Sci. 11 (2007) 3.
[2] A. Ghicov, P. Schmuki, Chem. Commun., submitted for publication.
[3] I. Paramasivam, J.M. Macak, P. Schmuki, Electrochem. Commun. 10 (2008) 71.
[4] I. Paramasivam, J.M. Macak, A. Ghicov, P. Schmuki, Chem. Phys. Lett. 445
(2007) 233.
Fig. 3. Electrochromic measurements of as-formed WO
3
on TiNT, monoclinic WO
3
on TiNT and TiNT (reference): (a) Cyclic voltammograms of the samples performed
between À0.5 V and 1 V with a scan rate of 50 mV in 0.1 M HClO
4
electrolyte; (b) current–density time curves acquired by chronoamperometry measurement applied
between À0.5 V and 1 V with 30 s duration; (c) optical images of the electrochromic effect of the different samples; (d) in situ reflectance measurements of the samples
obtained during chronoamperometry measurement of Fig. 3b.
A. Benoit et al. /Electrochemistry Communications 11 (2009) 728–732
731
[5] H. Tsuchiya, J.M. Macak, L. Muller, J. Kunze, F. Muller, P. Greil, S. Virtanen, P.
Schmuki, J. Biomed. Mater. Res. Part A, doi:10.1002/jbm.a30677.
[6] A. Ghicov, H. Tsuchiya, R. Hahn, J.M. Macak, A.G. Munoz, P. Schmuki,
Electrochem. Commun. 8 (2006) 528.
[7] R. Hahn, A. Ghicov, H. Tsuchiya, J.M. Macak, A.G. Munoz, P. Schmuki, Phys. Stat.
Sol. (a) 204 (2007) 1281.
[8] D.C. Cronemeyer, Phys. Rev. 87 (1952) 876.
[9] D.C. Cronemeyer, Phys. Rev. 113 (1939) 1222.
[10] A. Hagfeldt, N. Vlachopoulos, M. Graetzel, J. Electrochem. Soc. 141 (1994)
L82.
[11] A. Ghicov, M. Yamamoto, P. Schmuki, Angew. Chem., Int. Ed. 47 (2008) 1.
[12] K. Deb, Philos. Mag. 27 (1973) 801.
[13] M.S. Monk, R.J. Mortimer, D.R. Rosseinsky, Electrochromism: Fundamentals
and Applications, VCH, Weinheim, 1995.
[14] G. Granqvist, Handbook of Inorganic Electrochromic Materials, Elsevier,
Amsterdam, 1995.
[15] Y C. Nah, A. Ghicov, D. Kim, P. Schmuki, Electrochem. Commun. 10 (2008)
1777.
[16] Y C. Nah et al., J. Am. Chem. Soc. 130 (2008) 16154.
[17] J.M. Macak, H. Tsuchiya, S. Aldabergerova, P. Schmuki, Angew. Chem., Int. Ed.
44 (2005) 7463.
[18] L.V. Taveira, J.M. Macak, H. Tsuchiya, L.F.P. Dick, P. Schmuki, J. Electrohcem.
Soc. 152 (2005) B405.
[19] P. Cheng, C. Deng, X. Dai, D. Liu, J. Xu, J. Photochem. Photobiol. A – Chem. 195
(2008) 144.
[20] J.M. Macak, B.G. Gong, M. Hueppe, P. Schmuki, Adv. Mater. 19 (2007) 3027.
[21] L. Taveira, A. Sagües, J.M. Macak, P. Schmuki, J. Electrochem. Soc. 155 (6)
(2008) C293.
732 A. Benoit et al. / Electrochemistry Communications 11 (2009) 728–732