- Trang chủ >>
- Khoa Học Tự Nhiên >>
- Vật lý
growth, structure and electrical conduction of wo3 nanorods
Bạn đang xem bản rút gọn của tài liệu. Xem và tải ngay bản đầy đủ của tài liệu tại đây (619.83 KB, 4 trang )
Growth, structure and electrical conduction of WO
3
nanorods
M. Gillet
a,
*
, R. Delamare
a
, E. Gillet
b
a
Universite
´
Paul Ce
´
zanne, Aix-Marseille III, Faculte
´
des Sciences et Techniques, 52 Avenue Escadrille Normandie-Niemen,
13397 Marseille Cedex 20, France
b
Department of Electronics and Vacuum physics,Faculty of Mathematics and Physics, Charles University,
V Holesovickach 2, 180 00 Prague, Czech Republic
Available online 20 July 2007
Abstract
We present a very simple method to obtain tungsten trioxide nanorods. The nanorods are epitaxially grown on a mica substrate in low
supersaturation conditions. Investigations of morphology, crystallographic structure and chemical composition of the nanorods allow us to propose
a growth model in which the potassium ions of the substrate play a major role inducing the one-dimensional structure. The nanorod growth is
initiated by the formation of a hexagonal tungsten bronze (HTB) epitaxially oriented on the mica. By using a conductive atomic force microscopy
technique, we characterise the electrical conduction of WO
3
networks.
# 2007 Elsevier B.V. All rights reserved.
PACS : 81.07 Bc; 61.46Hk
Keywords: Tungsten oxide; Nanorods; Epitaxial growth; Conductive nanostructure network
1. Introduction
In the recent past years, tungsten trioxide has attracted
attention as candidate for chemical semiconductor-based
sensors. The mechanism of the electrical conductivity change
of the oxide surface under gas exposure is understood in term of
adsorption–desorption reactions involving surface oxygen
vacancies. Consequently, the sensing response of oxide films
is highly dependent on their surface structure and morphology. A
lot of sensing tests towards various gas molecules where carried
out on WO
3
polycrystalline thin films [1–3], they evidenced that
the sensing response steeply increases when the grain size
decreases. In more recent studies tungsten nanostructures
(nanowires, nanobelts and nanorods) were investigated [4–15]
and some of them were tested as chemical sensing material. Due
to their wide surface to volume ratio and to their small
dimensions compared to the Debye length,they promise to have a
high sensitivity and to be good candidate for future chemical
sensors working at low temperature and even at room
temperature. Of special interest are the synthesis and the
structural and electrical characterisation of such one-dimen-
sional WO
3
nanostructures which is the aim of the present paper.
2. Experimental procedure
Tungsten oxide nanorods are synthesized by vapour
deposition on a mica cleavage in a low supersaturation regime
[16]. The vapour source is a WO
3
thin film (10 nm thick) heated
in atmospheric pressure at a temperature T
1
= 590 8C, the
sublimated species are condensed on the mica substrate located
at 3 mm above the vapour source and maintained at
T
2
= 360 8C. After cooling at room temperature the deposits
are examined by atomic force microscopy (AFM) in taping
mode and then taken off their substrate by a carbon replica for
observation in selected area electron diffraction (SAED) and
high resolution transmission electron microscopy (HRTEM).
The chemical composition of the nanorods is determined by
Energy dispersive X-ray spectroscopy (EDX).
Conductive AFM (CAFM) investigates the electrical
conduction of WO
3
nanorods. The measurements are carried
out in air using the Digital Instruments microscope ‘‘Nano-
scope III’’ equipped with a conductive tip operating in contact
mode. The nanorods are partially embedded in a gold thin film
acting as a grounded electrode and the tip as a second mobile
www.elsevier.com/locate/apsusc
Applied Surface Science 254 (2007) 270–273
* Corresponding author. Tel.: +33 04 9166 1460.
E-mail address: (M. Gillet).
0169-4332/$ – see front matter # 2007 Elsevier B.V. All rights reserved.
doi:10.1016/j.apsusc.2007.07.124
electrode providing two terminal electrical measurements. This
technique allows obtaining simultaneously a classical topo-
graphic image of the nanorod and a representation of the special
current distribution. It is also possible to record I(V)
characteristics curve in single point mode.
3. Results
3.1. Structure and composition of the WO
3
nanorods
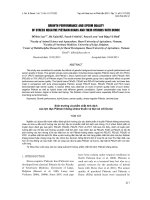
The Fig. 1a and b are typical images acquired on tungsten
oxide nanorods in taping AFM and CAFM mode, respectively.
The topographical image of Fig. 1a shows that the nanorods are
organised into a network with two preferential growth
directions at 608 that suggests an epitaxial orientation in
accordance with the six fold symmetry of the (0 0 0 1) mica
surface. For deposition time varying between 30 and 90 min the
nanorods dimensions lies in the 1–30 mm, 10–200 nm, 1–
50 nm, ranges for length, width and thickness, respectively.
Generally, the thickness and width of the nanorods depend on
the deposition time that does not influence their length and
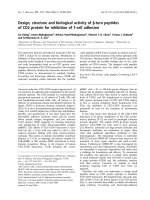
density. The image in Fig. 2 presents the thickness profile in of
nanorod by mean of cross-sections according to the transversal
AB and longitudinal CD profiles. The investigated thicknesses,
correspond to one, two or several monolayers of oxide if one
assumes that the lattice constant c value of the WO
3
monoclinic
structure represents the thickness of one monolayer. These
observations suggest a layer by layer growth mode. In addition
to the rods, there is evidence for the growth of 3-D aggregates,
their density is inversely proportional to the density of the rods.
This evidences that the formation of the nanorods results of a
competition between the both 1-D and 3-D growth processes.
Figs. 3 and 4 illustrate the structure investigations carried out
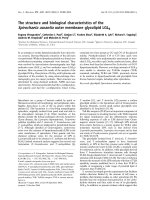
on two different thickness nanorods by SAED. The Fig. 3 is the
electron diffraction pattern of a nanorod with a thickness e
%1.9 nm It exhibits a rectangular basic cell from which we
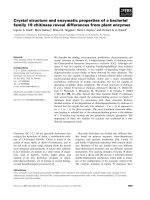
Fig. 1. Topographic image (left) and electrical (right) images simultaneously obtained on tungsten oxide nanorods. On the electrical image we have reported the
resistance values measured on somes points of the nanorod network.
Fig. 2. HRTEM image (a) and cross-sections of tungsten oxide nanorods; (b) cross-section along the line AB; (c) cross-section along the line CD.
M. Gillet et al. / Applied Surface Science 254 (2007) 270–273 271
deduce interatomic distances d
1
= 0.62 nm and d
2
= 0.38 nm
corresponding to d(1 0 0) = 0.634 nm and d(0 0 2) = 0.831 nm
of the WO
3
hexagonal lattice (a = b = 0.73 nm and c = 0.77 nm).
The HRTEM image (not shown) exhibits a rectangular unit mesh
with dimensions of 0.625 and 0.383 nm corresponding to the
atomic distances in the (1 0 0) plane of the hexagonal structure.
The nanorod surface is parallel to the (1 0 0) plan and the length
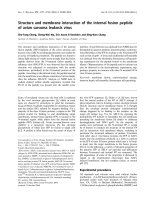
direction lies in the [0 0 1] axis. The Fig. 4 depicts the SAED
pattern obtained on a nanorod 7 nm thick, it indicates that in this
case the nanorod has a monoclinic single crystalline structure
with lattice parameters: a = 0.77 nm, b = 0.75 nm, c = 0.73 nm,
b = 90 and with a (0 0 1) plane parallel to the surface The length
direction lies in the [0 1 0] axis. In the HRTEM image (not
shown) two sets of parallel fringes are visible, with spacing of
0.38 and 0.37 nm in accordance with the (0 0 2) and the (0 2 0)
planes of the monoclinic structure. These results indicate that the
very thin nanorods (one to four monolayers) have a hexagonal
structure which transforms in the monoclinic structure for thicker
nanorods.
The chemical composition of the nanorods was analysed by
EDX. The EDX spectra evidence that the nanorod contained
potassium in addition to tungsten and oxygen atoms. However,
the relative concentration of potassium decreases when the
thickness of the nanorod increases; this result suggests that the
detected potassium is concentrated in the first monolayers due
to the growth of a thin layer of tungsten bronze (KxWO
3
). In
effect, the mica surface is potassium terminated so that
hexagonal tungsten bronze HTB can nucleate and grow on the
substrate. The small misfit ( f = 0.5) in the [0 1 0] direction of
the growing HTB favours the growth in this direction.
3.2. Growth model
Considering the results relative both to the structure and to
the composition we propose the following growth model for
WO
3
nanorods on the mica substrate: In a first step one layer
thick HTB nanorods are formed on the mica surface. The HTB
nanorods are epitaxially oriented on the substrate, the length
direction corresponds to the best accommodation of the HTB
on the mica. The second step concerns the growth of some
monolayers of hexagonal WO
3
which perfectly matches with
the underlying HTB. Finally, the nanorod grows in thickness by
deposition of WO
3
monoclinic on the top of the hexagonal
WO
3
. In this last step the hexagonal phase can be transform into
a monoclinic one by a topotactic transformation [17].
4. Electrical conduction
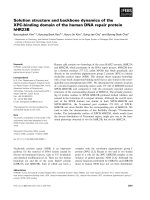
Fig. 5 illustrates a current–voltage measurement obtained on
a nanorod by ramping the bias voltage from V
tip
= À3to+3V.
The amplitude of the I (V) characteristics strongly depends on
Fig. 3. Electron diffraction pattern of a tungsten oxide nanorod (thickness
e = 1.9 nm). The basic rectangular cell of the hexagonal structure is shown.
Fig. 4. Electron diffraction pattern of a tungsten oxide nanorod (thickness
e = 7 nm). The basic square cell of the monoclinic structure is shown.
Fig. 5. Current–voltage characteristics obtained on a nanorod by ramping the
bias voltage from V
tip
= À3to+3V.
M. Gillet et al. / Applied Surface Science 254 (2007) 270–273272
the value of the nanostructure resistance. The shape of the curve
was elucidated in terms of electrical contacts [18]. In such a
two-probe method, the electrical contacts play an important
role, in particular the contact between the AFM tip and the
nanorod. Fig. 1b shows an electrical image obtained on a net of
nanorods. We have reported the resistance values for some
points on the nanorods, the measurements are evidently
affected by the tip contact, however, they prove that the
nanorods are well electrically connected each other’s.
5. Summary
Tungsten oxide nanorods have been epitaxially grown on a
mica substrate using a very simple vapour–solid growth
process. The WO
3
vapour source is heated at a low temperature
as compared to the high temperatures generally used in similar
nanorod synthesises. It results that the growth proceeds in low
sursaturation conditions. The investigations of the morphology,
structure and chemical composition allow us to propose a
growth model that involves in the formation of a very thin
epitaxial hexagonal tungsten bronze compound on the
potassium terminated surface of the mica. The accommodation,
with a small misfit, of the potassium ions of the mica lattice
with the potassium sites in the HTB induces a fast growth
towards one direction giving a rod shape nanostructure. The
further growth proceeds by the formation layer by layer of a
hexagonal and monoclinic tungsten trioxide successively. The
conductive atomic force microscopy is well suitable to
investigate the electrical conduction of such nanostructures
allowing either to obtain simultaneously the topographic image
and the spatial current distribution or to record the current–
voltage characteristics in a given point of the nanorod. The
nanorods are electrically connected each others in a well
organised network which therefore, could be used for chemical
sensing measurements.
References
[1] I.M. Teoh, J. Hung, W.H. Shieh, M.H. Lai, Hon, Electrochem. Solid-State
Lett. 6 (2003) G108.
[2] E. Llobet, G. Molas, P. Molina
`
s, J. Calderer, X. Vilanova, J. Brezmes, J.E.
Sueiras, X. Correig, J. Electrochem. Soc. 147 (2000) 776.
[3] J.L. Solis, A. Hoel, L.B. Kish, C.G. Granqvist, S. Saukko, V. Lantto, J.
Am. Ceram. Soc. 84 (2004) 1504.
[4] Y.Q. Zhu, W.B. Hu, W.K. Hsu, M. Terrones, Chem. Phys. Lett. 309 (1999)
327.
[5] Y. Koltypin, S.I. Nikitenko, A. Guedanken, J. Mater. Chem. 12 (2002)
1107.
[6] J.G. Liu, Y. Zhao, Z.J. Zhang, J. Phys., Condens. Matter. 15 (2003) L435.
[7] N. Shankar, M.F. Yu, S.P. Vanka, N.G. Glumac, Mater. Lett. 60 (2006) 771.
[8] X.L. Li, J.F. Liu, Y.D. Li, Inorg. Chem. 42 (2003) 921.
[9] K.K. Zhu, H.Y. He, S.H. Xie, X. Zhang, W.Z. Zhou, S.L. Jin, B. Yue,
Chem. Phys. Lett. 377 (2003) 317.
[10] Y.B. Li, Y. Bando, D. Golberg, Adv. Mater. 15 (2003) 1294.
[11] M. Gillet, R. Delemare, E. Gillet, Eur. Phys. J. D 34 (2005) 291.
[12] J. Zhou, Y. Ding, Z.S.Z. Deng, L. Gong, N.S. Xu, Z.Y. Wang, Adv. Mater.
17 (2005) 2107.
[13] K. Lee, W.S. Seo, J.T. Park, J. Am. Chem. Soc. 125 (2003) 3408.
[14] X.W. Lou, H.C. Zeng, Inorg. Chem. 42 (2003) 921.
[15] Z.D. Xiao, L.D. Zhang, X.K. Tian, X.S. Fang, Nanotechnology 16 (2005)
2647.
[16] Y. Xia, P. Yang, Y. Sun, Y. Wu, B. Mayers, B. Gates, Y. Yin, F. Kim, H.
Yan, Adv. Mater. 15 (2003) 353.
[17] M. Figlarz, B. Dumont, B. Gerand, B. Beaudoin, J. Microsc. Electron 7
(1982) 371.
[18] P. Guaino, M. Gillet, R. Delamare, E. Gillet, Surf. Sci. 61 (2007) 2684.
M. Gillet et al. / Applied Surface Science 254 (2007) 270–273 273