- Trang chủ >>
- Khoa Học Tự Nhiên >>
- Vật lý
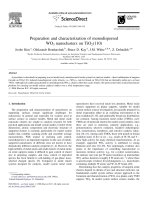
preparation and characterization of monodispersed wo3 nanoclusters on tio2(110)
Bạn đang xem bản rút gọn của tài liệu. Xem và tải ngay bản đầy đủ của tài liệu tại đây (1.05 MB, 10 trang )
Preparation and characterization of monodispersed
WO
3
nanoclusters on TiO
2
(110)
Jooho Kim
a
, Oleksandr Bondarchuk
b
, Bruce D. Kay
a
, J.M. White
a,b,
*
, Z. Dohna
´
lek
a,
*
a
Pacific Northwest National Laboratory, Institute for Interfacial Catalysis and Fundamental Sciences Directorate,
Richland, WA 99352, USA
b
Center for Materials Chemistry, Texas Materials Institute, University of Texas, Austin, TX 78712, USA
Available online 28 August 2006
Abstract
A procedure is described for preparing a novel model early transition metal oxide system for catalysis studies—direct sublimation of tungsten
trioxide on TiO
2
(110). Isolated monodispersed cyclic trimers, i.e., (WO
3
)
3
, can be formed on TiO
2
(110) that are thermally stable up to at least
750 K. Although not readily generalizable to monodispersed (WO
3
)
x
clusters other than cyclic trimers, this protocol provides an ideal nanocluster
platform for carrying out model system catalysis studies over a wide temperature range.
# 2006 Elsevier B.V. All rights reserved.
Keywords: Nanoclusters; TiO
2
(110); Cyclic trimers
1. Introduction
The preparation and characterization of nanoclusters on
supporting surfaces remain significant challenges for
nanoscience in general and especially for systems used in
surface science as catalyst models. Metal and metal oxide
nanoscale clusters are sought in catalysis research for both
practical applications and model system studies. Control of the
dimensions, atomic composition and electronic structure of
supported clusters is essential, particularly for model system
studies that combine scanning probe and ensemble average
measurements. With respect to realizing such control,
monodispersity is an important requisite. In the case of metals,
supported nanoclusters of different sizes are known to have
dramatically different catalytic properties [1–4]. However, the
high mobility of metal atoms and small clusters of metal atoms
on oxide supports makes it difficult to gain control of cluster
size in preparing samples, and mass control of deposited
species has been limited to soft-landing of gas-phase mass-
selected charged species [5]. Compared to metal cluster
systems designed for catalysis, model system metal oxide
nanoclusters have received much less attention. Metal oxide
clusters supported on planar supports, suitable for model
system surface science investigation, are typically prepared via
metal evaporation either in an oxidizing environment or by
post-oxidation [6–15], and undesirably broad size distributions
are common. Among transition metal oxides (TMOs), early
TMOs are of particular interest for model system studies, since
these are used in numerous catalytic applications, e.g.,
polymerization, selective oxidation, oxidative dehydrogena-
tion, isomerization, metathesis, and selective catalytic reduc-
tion [16–21]. Among early TMOs, those with metals in formal
oxidation states of five or six – e.g., oxides of W, M, and V –
show high activity for many chemical transformations. As an
example, supported WO
x
activity is attributed to strong
Brønsted acid sites [22–25]. Not surprisingly, evidence also
points to the importance of controlling nanostructure to
maximize intrinsic activity; e.g., for o-xylene isomerization,
the intrinsic rate (rate per W atom) maximizes at intermediate
WO
x
surface densities (roughly 8 W atoms nm
À2
) where there
is spectroscopic evidence for polytungstates, i.e., nanoclusters
containing multiple W atoms and W–O–W bonds [25].
Determining how the catalytic properties of tungsten oxide
clusters depend on details of size and structure motivates our
fundamental, model system surface science approach to the
formation and characterization of WO
x
on a planar, early TMO
support, TiO
2
. In model system surface science studies, the
www.elsevier.com/locate/cattod
Catalysis Today 120 (2007) 186–195
* Corresponding authors.
E-mail addresses: (J.M. White),
(Z. Dohna
´
lek).
0920-5861/$ – see front matter # 2006 Elsevier B.V. All rights reserved.
doi:10.1016/j.cattod.2006.07.050
TiO
2
(110) surface has achieved prototypical status [26] as a
reliably reproducible single crystal early TMO substrate that is
amenable to study in ultrahigh vacuum using electron-based
methods, including atomically resolved scanning tunneling
microscopy.
In this paper, we describe a procedure for preparing a novel
model early TMO system for catalysis studies: direct sublimation
of tungsten trioxide on single crystal titania. Based on scanning
tunneling microscopy (STM), X-ray photoelectron spectroscopy
(XPS), temperature programmed desorption (TPD), and quartz
crystal microbalance (QCM) mass measurements, we show that
isolated monodispersed cyclic trimers, i.e., (WO
3
)
3
,canbe
formed on TiO
2
(110) that, after annealing, are thermally stable
up to at least 750 K. Although not readily generalizable to
monodispersed clusters other than trimers, this system, (WO
3
)
3
on TiO
2
(110), provides an ideal platform for carrying out
model surface chemistry catalysis studies over a wide
temperature range.
2. Experimental
The experiments were performed in two ultrahigh vacuum
(UHV) chambers. The first is equipped with Auger electron
spectroscopy (AES), XPS, low energy electron diffraction
(LEED), and quadrupole mass spectrometry (QMS). An
important feature is provision for molecular beam dosing of
adsorbates at temperatures as low as 30 K where, for example,
N
2
monolayers, but not multilayers, accumulate on oxides. The
use of geometrically well-defined beams minimizes adsorption
on vacuum system surfaces other than the substrate. In the work
reported here, TPD data were gathered at a heating rate of
1Ks
À1
in line-of-sight geometry. In this instrument, TiO
2
(110)
substrates (10 mm  10 mm  1 mm) were mounted with
good thermal contact on a 1.25 cm diameter Mo holder
composed of a 1 mm thick base-plate with a square
(10 mm  10 mm) recession 0.25 mm deep machined into it.
The TiO
2
(110) single crystal sample is seated in this recession
and covered by a 0.1 mm thick retaining ring having a 8 mm
diameter clear opening in its center. The Mo retaining ring and
the captured sample are secured to the base plate by four Mo
screws. The temperature of the substrate was measured using a
W–5%Re/W–26%Re thermocouple cemented to the back of
the sample using a ZrO
2
-based ceramic adhesive (Aremco
Ultra-Temp 516). The thermocouple leads passed through a
small hole machined in the center of the Mo base plate.
Resistive heating of the Mo plate was varied under computer
control. An absolute temperature calibration was performed
using the multilayer desorption of various gases (N
2
,Ar,O
2
,
and H
2
O) [27]. We estimate the resulting uncertainty in the
absolute temperature reading to be Æ2 K. For typical TPD
experiments, N
2
and CH
3
OH were dosed at 30–40 K.
The scanning tunneling microscopy (STM) experiments
were carried out in a second UHV chamber equipped for STM
(Omicron variable temperature), AES, and QMS. All STM
images (tunneling into empty states of the sample) were taken
at room temperature under current–voltage conditions typically
used for TiO
2
(110) (0.1–0.2 nA, +1.0 to 1.7 V). The W STM
tips (Custom Probe Unlimited) were cleaned by Ne
+
sputtering
and UHV thermal annealing. The TiO
2
(110) rutile single
crystal (10 mm  3mm 1 mm) was mounted on a standard
Omicron single plate tantalum holder and heated radiatively
with a tungsten filament heater located behind the sample plate.
The sample temperature was correlated with heater power in a
separate experiment using a TiO
2
(110) crystal with a chromel–
alumel thermocouple glued directly to the crystal surface.
In both systems, well-ordered TiO
2
(110) surfaces were
prepared using repeated cycles of Ne
+
ion sputtering and UHV
annealing at 900 K. Order was verified by either LEED or STM.
The WO
3
was deposited by direct sublimation of WO
3
powder
(99.95%, Aldrich) onto TiO
2
(110), typically at 300 K, using a
high temperature effusion cell (CreaTec) operated between
1118 and 1148 K. The deposition mass flux (0.2–1.4 ng/s cm
2
)
and mass added were monitored with a quartz crystal
microbalance (QCM, Inficon). Since the results indicate
deposition of species with O:W ration of 3:1, the graphs
below plot the deposited mass in units of WO
3
nm
À2
. After
deposition, the surface was analyzed before (as-dosed) and after
thermal annealing to selected temperatures up to 900 K.
3. Results and discussion
3.1. Characterization of as-dosed material
To characterize the atomic composition of the as-dosed
material, we relied, with a few exceptions noted below, on XPS.
For doses thick enough to attenuate fully the TiO
2
substrate
photoelectrons, the O
1s
/W
4f
XPS intensity ratios, after account-
ing for relative sensitivities, give an O/W atomic ratio of 3 (not
shown). Based on X-ray diffraction (XRD) examination of thick
(between 50 and 200 layers) deposits, crystalline WO
3
is formed
on TiO
2
. Consistent with these results, in preliminary experi-
ments involving large doses onhighly oriented pyrolytic graphite
(HOPG) at 650 K, crystalline needles of WO
3
form (not shown).
These crystallites (typically, 1 mm long with an aspect ratio of
25) were characterized by STM, atomic force microscopy
(AFM), scanning electron microscopy (SEM) and X-ray
diffraction (XRD).
Fig. 1 shows that for all doses, the XPS W
4f7/2
binding energy
(BE) for as-deposited material is 35.6 Æ 0.2 eV, characteristic of
fully oxidized W, i.e., WO
3
[28] and significantly higher than
either metallic W (31.0 eV) measured in our instrument (Fig. 1)
or WO
2
(32.9 eV) reported in the literature [28]. For doses
between 0 and 7 WO
3
nm
À2
,theW
4f7/2
XPS intensity and the
W
NVV
/Ti
LMM
AES intensity ratio both grow linearly with the
mass of material deposited, Fig. 2, consistent with 2D growth
dominating. However, in the range from 0.7 to 7 WO
3
nm
À2
,the
STM evidence presented below indicates that increasing
numbers of 3D clusters are present, at least after annealing.
The XPS and AES results accord with mass spectrometry
literature [29]; the W-containing species subliming from solid
WO
3
are oligomers of tungsten trioxide, i.e., (WO
3
)
x
,2 x 8.
Among the oligomers, x = 3 predominates by an order of
magnitude. Based on the foregoing evidence, we conclude that
the as-deposited material, regardless of dose (submonolayers to
J. Kim et al. / Catalysis Today 120 (2007) 186–195 187
thick multilayers), is comprised predominantly of WO
3
oligomers.
On as-deposited WO
3
, the TPD of N
2
physisorbed at 40 K is
also revealing (Fig. 3). Reproducing earlier work [30], TPD of a
saturation dose of physisorbed N
2
on clean TiO
2
(110), pre-
annealed to 900 K, is characterized by two local maxima
positioned on broadly distributed intensity profiles that extend
from 40 to 140 K (see Fig. 3a). The higher temperature
maximum (100 Æ 5 K) is attributed to physisorption on Ti
4+
cations and the second maximum (45 Æ 5 K) is ascribed to N
2
physisorption on O
2À
anions. On as-deposited WO
3
, the TPD
intensity of physisorbed N
2
attributable to adsorption on Ti
4+
cations is monotonically suppressed as the WO
3
dose increases
(Fig. 3b–d). This is underscored by plotting the integrated
intensity in the region between 70 and 140 K (inset of Fig. 3):
there is no intensity in this region that is attributable to N
2
physisorbed on the WO
3
deposit. At lower temperatures,
between 30 and 70 K, the N
2
integrated intensity increases upon
adding 1.4 WO
3
nm
À2
but then remains roughly constant over
the range studied (up to 7 WO
3
nm
À2
).
As shown below using STM images, adding WO
3
blocks
Ti
4+
sites; thus, suppression of desorption from Ti
4+
is not
surprising. Interestingly, however, the WO
3
species themselves
do not bind N
2
that is detectable in TPD between 70 and 140 K.
Since the intensity distribution shifts down in temperature when
WO
3
is added, the interaction between N
2
and WO
3
more
nearly resembles the O
2À
component than the Ti
4+
component
of the substrate. Evidently, and unlike the cation–anion
resolution for N
2
on the TiO
2
substrate, the physisorption
potential between as-deposited WO
3
and N
2
either does not
distinguish between Wand O sites or W sites are not accessible.
Typical STM images for clean and WO
3
-dosed TiO
2
(110) are
shown in Fig. 4. Compared to an image of clean TiO
2
(110),
Fig. 4a, tunneling into unoccupied energy levels of as-deposited
material (0.7 WO
3
nm
À2
), Fig. 4b, differs in the following ways:
(1) As shown within the white oval, there are dark unresolved
regions at various locations along the typically bright atomically
resolved Ti
4+
rows of the substrate, i.e., along the [001] direction.
(2) These altered regions typically involve at least two Ti
4+
rows
and extend over distances much larger than the spacing between
neighboring Ti
4+
cations (3 nm). (3) Along the O
2À
cation rows
(dark rows in Fig. 4a), the tunneling intensity typically increases
in regions adjacent to the dark regions. (3) Finally, after dosing
there are a few ($1 per 100 nm
2
) quite bright spots centered on
the bridging oxygen atom rows. We return to a discussion of these
features after presenting some STM results for surfaces annealed
to 600 K after dosing.
J. Kim et al. / Catalysis Today 120 (2007) 186–195188
Fig. 1. The W
4f
core level XPS spectra for (from bottom to top): 1.4 as-
deposited WO
3
nm
À2
, 7.0 as-deposited WO
3
nm
À2
, 70 as-deposited WO
3
nm
À2
and metallic W.
Fig. 2. Linear correlation of W
NVV
/Ti
LMM
AES ratio and W
4f
intensity with
amount of deposited WO
3
, the latter is plotted in units of WO
3
nm
À2
based
QCM measurement of mass added.
Fig. 3. TPD of N
2
dosed to saturation at 40 Æ 2 K on TiO
2
(110) precovered
with the following amounts of as-deposited WO
3
nm
À2
: (a) 0.00, (b) 1.4, (c) 3.5
and (d) 7.0. The heating rate was 1 K s
À1
. The inset shows the TPD area above
70 K plotted as a function of WO
3
nm
À2
.
3.2. Characterization of anneal ed material
With the above results for as-deposited material in mind, we
turn to results gathered by XPS, STM and TPD after annealing
as-deposited material to selected temperatures in the 450–
900 K range and re-cooling to base temperatures of 300 K
(STM) and/or $35 K (TPD, XPS).
As shown in Fig. 5, the W
4f7/2
BE (35.6 eV) is not altered by
annealing to temperatures between 300 and 900 K. Regardless
of the coverage between 0.7 and 7.0 WO
3
nm
À2
, the dominant
formal oxidation state of tungsten remains (6+). The only
noticeable difference in the line shape occurs upon annealing
higher coverages to between 700 and 900 K. For example, after
annealing 3.5 WO
3
nm
À2
to 900 K, Fig. 5(b), there is a shoulder
(marked with arrow) on the low BE side of the W
4f
profile, and
the 4
f5/2
–4
f7/2
spin-orbit splitting is less well-defined. This is
taken as evidence for modest loss of oxygen coordination to W,
i.e., a local reduction to WO
x
(x < 3), for a small fraction of the
deposited WO
3
. These changes are not evident for samples
annealed to 600 K, regardless of WO
3
coverage, and are not
evident up to 900 K for low WO
3
coverages, e.g., Fig. 5(a). As
Fig. 6 illustrates, the integrated W
4f
intensity, normalized to the
Ti
2p
intensity, does not change when as-dosed material is
annealed to 900 K. In passing, we note that annealing
7.0 WO
3
nm
À2
to 900 K did not alter the Ti
3d
signal from
the support; compared to XPS for the as-deposited material,
neither the 3d intensity nor the 3d peak shape was detectably
altered (not shown). These XPS results show evidence for no
more than minimal loss or restructuring of tungsten, titanium
and oxygen within the XPS sampling depth ($6 nm).
Whereas XPS reveals negligible changes upon annealing,
the TPD and STM results, on the other hand, indicate that
J. Kim et al. / Catalysis Today 120 (2007) 186–195 189
Fig. 4. STM images of (a) clean TiO
2
(110) and (b) 0.73 nm
À2
of as-deposited WO
3
. The white oval marks a dark region that spans eight atoms along a Ti
4+
row and
disrupts order along the adjacent Ti
4+
row.
Fig. 5. W
4f
XPS spectra for WO
3
dosed on TiO
2
(110) and annealed to the indicated temperature for 10 min and cooled nominally to 300 K prior to taking spectra.
Panel (a) is data for a low dose of 1.4 WO
3
nm
À2
while panel (b) is for 3.5 WO
3
nm
À2
. The shoulder marked in panel (b) for 900 K annealing is attributed to local loss
of oxygen in some of the WO
3
clusters.
annealing does lead to discernable surface restructuring. As
shown in Fig. 7, TPD of physisorbed N
2
dosed at 30 K (10 K
lower than in Fig. 3 allowing a higher saturation N
2
coverage)
after deposition of 3.5 WO
3
nm
À2
is markedly altered upon
annealing the WO
3
. Compared to results for the as-dosed
(300 K) material, a new relatively high temperature local
maximum (near 110 K) appears after annealing at 450 K.
Assuming a symmetric desorption peak associated with this
maximum, the intensity is about half the total found between 70
and 150 K. While a detailed site assignment cannot be made,
the peak at 110 K is definitely due to the addition and annealing
of WO
3
. Annealing to higher temperatures (up to 750 K) does
not further alter the integrated (70–150 K) N
2
TPD intensity or
its distribution. When annealed at 900 K, however, the peak
shape changes slightly; the peak at 110 K is more pronounced,
and there is some suppression of intensity around 90 K.
A second TPD change results from annealing. While the
leading edges of the low temperature desorption peaks (45 K)
of Fig. 7 are not measurably altered, annealing suppresses
intensity on the high temperature side of the peak. For example,
the N
2
TPD intensity at 50 K does not change for samples
annealed to 450 K but drops by 30% and 40% for samples
annealed at 750 and 900 K, respectively. The N
2
intensity at
60 K is altered somewhat differently: a local maximum appears
between 55 and 60 K for the sample annealed at 900 K, but not
750 K. We postpone discussion of the effects of annealing on
TPD of physisorbed N
2
until the STM results are presented.
The TPD of CH
3
OH is also interesting. Fig. 8 compares
doses of CH
3
OH on two 30 K surfaces, TiO
2
(110) with 0.0 and
3.5 WO
3
nm
À2
, the latter annealed to 600 K before dosing
J. Kim et al. / Catalysis Today 120 (2007) 186–195190
Fig. 6. Variation of the ratioed W
4f
/Ti
2p
XPS signals with annealing tempera-
ture for doses of WO
3
between 1.4 and 7.0 WO
3
nm
À2
.
Fig. 7. TPD of a saturation dose of N
2
on as-deposited and annealed WO
3
. For
this experiment, 3.5 WO
3
nm
À2
was deposited on clean TiO
2
(110) at 300 K,
annealed to the indicated temperature for 10 min and cooled to 35 Æ 2 K for
adsorption and TPD of N
2
. The TPD heating rate was 1 K s
À1
.
Fig. 8. TPD of CH
3
OH dosed at 30 K on: (a) clean TiO
2
(110) and (b) TiO
2
(110)
covered with 3.5 WO
3
nm
À2
and annealed to 600 K. The heating rate was
1Ks
À1
. The CH
3
OH coverage range extends from submonolayer to multilayer,
the latter characterized by a sharp peak at 145 K. The bold line curves in each
panel denote the largest coverage of CH
3
OH that does not exhibit a multilayer
peak.
CH
3
OH. There is no evidence for oxidation on either surface;
the only desorbing species is CH
3
OH. When no WO
3
is present,
the lowest dose gives a peak at 375 K, attributed to adsorption
on exposed Ti
4+
cations. As the CH
3
OH coverage increases,
this peak shifts monotonically to lower temperatures and stalls
at 300 K. At this coverage, the TPD intensity between 275 and
450 K approaches saturation, a fact interpreted as completely
filling the Ti
4+
sites. The relatively wide desorption regime
extending from 250 to 400 K, is taken to indicate weak
molecular chemisorption with significant inter-adsorbate
repulsion. For higher CH
3
OH coverages, added TPD intensity
grows in below 250 K and is attributed to desorption from
oxygen-terminated sites. A shoulder appears between 225 and
250 K, followed by a resolved peak at 175 K. The latter shifts
with increasing coverage to 165 K (thick curve) and is then
overwhelmed by unsaturable multilayer CH
3
OH desorption
with an onset at 125 K and a peak near 150 K. Excluding
multilayer desorption, roughly half the CH
3
OH desorbs from
Ti
4+
and half from oxygen-terminated binding sites.
There are several points to be made regarding TPD of
CH
3
OH from the WO
3
-covered surface. First, dosed CH
3
OH is
the only detected desorbate, and it is completely removed
below 450 K. Thus, adding WO
3
provides no evidence for
adding sites where CH
3
OH dissociates between the dosing
temperature 30 and 450 K. Second, while adding WO
3
does not
alter the qualitative features of CH
3
OH TPD spectra, there are
readily identifiable changes in the intensity distributions. The
high temperature peak saturates at much lower CH
3
OH
coverages and never shifts below 340 K. In addition, a low
temperature peak is resolved at 220 K and shifts monotonically
to 170 K (thick curve) before being overwhelmed by multilayer
desorption. As for N
2
physisorption, only a small fraction of the
original Ti
4+
binding sites remain accessible, but unlike TPD of
N
2
from annealed WO
3
, there is no evidence for a high
temperature contribution in the TPD of CH
3
OH. Overall, from
aCH
3
OH monolayer-saturated surface, desorption is domi-
nated by sites resembling oxygen-terminated sites on TiO
2
.
When interpreting these CH
3
OH and N
2
TPD results, it should
be kept in mind that, while added WO
3
sterically blocks Ti
4+
sites (see STM images below), it may also perturb the local
charge distribution and its polarizability in ways that weaken
binding to accessible Ti
4+
sites.
As Fig. 9 illustrates, STM results gathered after annealing to
600 K differ strikingly compared to those gathered before
annealing (compare Figs. 4 and 9a). The differences include:
(1) the dark unresolved regions vanish and are replaced by spots
with uniform dimensions and intermediate brightness. (2)
Unlike the dark regions of Fig. 4, the new spots are individually
resolved and, as discussed in detail below, each spot extends
over distances equal to the twice the spacing between
neighboring Ti
4+
cations along the [001] direction. (3) The
enhanced tunneling intensity in regions adjacent to the dark
regions is no longer evident. On the other hand, the surface
density of quite bright spots is about the same before and after
annealing.
The areal density of the spots of intermediate brightness
varies linearly with the mass deposited, based on QCM data
(Fig. 10). To within 10%, the least squares slope is consistent
with (WO
3
)
x
, x = 3 and provides a central conclusion; over the
range of Fig. 10 and excepting a few very bright spots, annealed
WO
3
takes the form (WO
3
)
3
, i.e., the bright spots are
monodispersed trimer clusters.
Detailed analysis of the data of Fig. 9a shows that, for line
scans along the [001] direction, the apparent cluster height is
0.15 nm and the diameter is 0.6 nm (not shown). Along this
direction, the spacing between nanoclusters is never less that
twice the spacing between neighboring Ti
4+
, i.e., 2 Â 0.296 nm
in perfect TiO
2
(110). This is most likely the result of steric
repulsions due to the cluster size. Rather, the clusters are
positioned with respect to each other according to the relation
D
[001]
= 0.6 + n  0.3 nm, where n = 0–2, etc. This ‘‘digital’’
separation places the (WO
3
)
3
clusters at equivalent positions
with respect to the supporting Ti
4+
cations. In some images, the
Ti
4+
positions in rows alongside given clusters are resolved (not
shown). Using these resolved cation positions as references, the
bright regions attributed to clusters are centered over a pair of
adjacent Ti
4+
cations.
Orthogonal to [001], i.e., along the ½1
¯
10 direction, the
rows of Ti-aligned (WO
3
)
3
are separated according to the
relation D
½1
¯
10
¼ m  0:65 nm, where m is an integer. These
J. Kim et al. / Catalysis Today 120 (2007) 186–195 191
Fig. 9. STM of TiO
2
(110) surfaces covered with annealed WO
3
(600 K): (a) 0.7 nm
À2
WO
3
nm
À2
(corresponding image for as-deposited WO
3
is given in Fig. 4b),
(b) 3.5 WO
3
nm
À2
and (c) 5.0 WO
3
nm
À2
.
observations can be used to define a monolayer (ML) coverage
scale in terms of a hypothetical structure that would fully cover
the TiO
2
(110) substrate with trimers. Since there are 5.2 Ti
4+
cations nm
À2
in a perfect (110) surface, a perfect monolayer
would contain 2.6 (WO
3
)
3
nm
À2
, i.e., one (WO
3
)
3
cluster for
every pair of Ti
4+
along the [001] direction. With this definition,
deposition of 7.8 nm
À2
of WO
3
corresponds to 1 ML of trimers.
Although each trimer centered on Ti
4+
rows occupies a well-
defined local position with respect to the Ti
4+
cations of the
substrate, evidence is lacking for long-range ordering either
along the ½1
¯
10 or [001] directions. In our experiments,
complete ordered monolayers of trimers centered on Ti
4+
rows
never form. Even at the coverage of Fig. 9a, 0.7 WO
3
nm
À2
,
20–30% of the trimers are centered between the Ti
4+
rows, i.e.,
along the O
2À
rows. Typical STM images for higher coverages
are shown in Fig. 9b and c. At intermediate coverage,
3.5 WO
3
nm
À2
, Fig. 9b, a number of 3D aggregates appear
alongside large regions covered with isolated trimers. Upon
increasing the coverage to 5 WO
3
nm
À2
, Fig. 9c, monodis-
persed clusters remain, but most of the added WO
3
is accounted
for by increasing the size of the 3D clusters rather than adding
to the monolayer of trimers.
Many images of 600 K annealed samples exhibit strong
tunneling current variations within each cluster (Fig. 11). We
suppose that day-to-day variations in the ‘‘sharpness’’ of the
tunneling tip determine whether or not the internal cluster
structure is resolvable and, as illustrated by the two examples
described in Fig. 11, account for quantitative differences in the
intensity distributions associated with each cluster. The images
of Fig. 11a and b are qualitatively similar; each trimer image
comprises a dark region, surrounded by a region of higher, but
non-uniform, intensity. When referenced to the Ti
4+
(bright
rows) of the support, the dark areas are typically centered over
the dark rows of the support, i.e., over the O
2À
rows, and make
tangential contact with the bright stripes that mark Ti
4+
rows.
Along the ½1
¯
10 direction, the surrounding asymmetric brighter
regions extend across two adjacent bright rows of Ti
4+
and the
brightest portions take one of two directions with roughly
equal probability; the highest intensity lies to the left or right
side of the dark core along the ½1
¯
10 direction. For example, in
Fig. 11a the brightest region of cluster A lies to the left side of
J. Kim et al. / Catalysis Today 120 (2007) 186–195192
Fig. 10. Correlation of the mass deposited per unit area with the number of
bright spots per unit area of STM images. The mass units (y-axis) are normal-
ized in units of the mass of WO
3
. The dashed line is a least squares linear fit that
passes through the origin. The slope determines the number of WO
3
units in
each bright spot, i.e. trimers. The inset schematically illustrates the structure and
dimension of gas phase trimers.
Fig. 11. Panels (a) and (b). Pair of STM images for tunneling into unoccupied
orbitals of annealed (WO
3
)
3
nanoclusters. Tunneling intensity variations within
each cluster are clearly evident. In the panel (a), the local coverage is
0.86 WO
3
nm
À2
or 0.06 ML of trimers using the monolayer definition described
in the text. The dashed lines mark centerlines of Ti
4+
rows. Panel (c): schematic
of proposed geometry of tilted cyclic trimers, (WO
3
)
3
, adsorbed on TiO
2
(110).
Trimers A and B of panel (a) are indicated.
the dark core, whereas for cluster B, the brightest region lies to
the right side. Quantitatively, there are differences from day to
day that we attribute to unknown variations in the details of the
tip. For example, in Fig. 11a, the dark cores evidence three-fold
symmetry whereas those of Fig. 11b are not as well defined.
There are 12 clusters in the 42 nm
2
image of Fig. 11a, i.e., a
local coverage of 0.86 WO
3
nm
À2
(0.06 ML of (WO
3
)
3
). The
bright lobes of all clusters are centered on Ti
4+
rows. Since the
sample is placed under positive bias to acquire this image,
tunneling occurs into unoccupied orbitals of the clusters. The
three-fold symmetry of the central dark region suggests,
consistent with spectroscopy and calculations on gas phase
clusters [31], that the trimers are cyclic as diagrammed in the
inset of Fig. 10. Based on photoelectron spectroscopy (PES)
and density functional theory (DFT) calculations [31,32], gas
phase (WO
3
)
3
trimers are cyclic with D
3h
symmetry [31].
Calculated low lying unoccupied orbitals for gas phase cyclic
(WO
3
)
3
are W 5d-based and three-fold symmetric with very
little density at the oxygen atoms.
Assuming that empty orbitals calculated for the gas phase
cyclic (WO
3
)
3
provide a reasonable approximation for the
adsorbed clusters, the angular intensity variation surrounding
the dark triangle and the tilt in two directions with respect to
the [001] direction are both accounted for in terms of the
schematic model shown in Fig. 11c. Here one of the three
bridging oxygen atoms of the trimer is centered above and
between an adjacent pair of Ti cations in a [001] row while the
two adjacent W atoms are aligned with the supporting Ti
4+
row, presumably bound to the titania via peripheral O atoms
of (WO
3
)
3
.TheremainingWandtwoO’softhecyclethentilt
towards the bridging oxygen atom rows in one of two
equivalent directions. The angular intensity variation in the
region surrounding the dark triangle is then consistent with
enhanced tunneling into the unoccupied orbitals that are 5d-
dominated at the W atoms; the two W atoms lying over Ti
4+
exhibit lower intensity than the third that lies further from the
underlying surface than the other two and is tilted towards
one or the other of the adjacent O
2À
rows. Finally, the
calculated diameter of the cyclic cluster (0.53 nm) [31] is
consistent with STM data showing that two Ti
4+
sites are
required to accommodate one cluster.
4. Discussion
Taken together, the above results indicate a reliable protocol
for producing monodispersed cyclic trimers of WO
3
. Once
annealed, these (WO
3
)
3
nanoclusters are thermally stable up to
at least 750 K and, thus, provide a potentially valuable platform
for probing surface chemical reactions over a wide temperature
range. Like all model system approaches, the protocol has
obvious limitations. In particular, the procedure does not
provide for independent control of the number of W and O
atoms in each cluster. This limitation does not diminish the very
attractive opportunity to examine surface chemistry on the very
well-defined monodispersed (WO
3
)
3
nano-cluster system.
Since the clusters are monodisperse, ensemble average results,
gathered using XPS, TPD, IR, mass spectrometry etc., can be
meaningfully interpreted using atomic level data gathered on
individual nanoclusters. For example, the foregoing data
illustrate that chemisorbed isolated (WO
3
)
3
nanoclusters
supported on TiO
2
(110) do not lead to CH
3
OH oxidation
during adsorption at 30 K and subsequent heating. On the other
hand, in ongoing work to be reported elsewhere, we have shown
that oligomers of formaldehyde, (CH
2
O)
x
, x > 2, do not form
on clean TiO
2
(110) but form readily when these isolated
(WO
3
)
3
nanoclusters are present [33]. The clusters also
dehydrate 2-butanol to 2-butene [34]. Because the clusters
are known to be monodisperse, these ensemble average reaction
results are unambiguously attributable to properties of (WO
3
)
3
.
Reducing ambiguities and refining conceptual models by
combining local and ensemble average measurements is further
illustrated as follows. From the XPS and physisorbed N
2
TPD
results alone, we would construe the following regarding the as-
deposited and 750 K annealed material. From XPS, we
conclude that there is no loss of O or W, the O/W ratio is 3,
and the formal oxidation number of W is (6+). From N
2
TPD,
we conclude that the physisorption potential changes sig-
nificantly when WO
3
is added, and changes further when the
WO
3
deposit is annealed from 300 to 450 K. From this valuable
data, we can make only inferences regarding the local structures
of the as-deposited WO
3
and the changes brought on by
annealing. Adding the STM and QCM results provides much
deeper insight. Annealing produces dramatic changes in the
tunneling intensity distributions; streaks and variable length
dark regions with poorly defined edges along Ti
4+
rows
disappear and single-size well-defined bright regions appear
along Ti
4+
rows. The surface density of bright spots correlates
linearly with the mass deposited, from which we conclude that
stable trimers, (WO
3
)
3
, are formed when as-deposited material
is annealed. Provided the STM tip is in a suitable, but unknown,
condition, the intensity of each of the bright spots exhibits
internal symmetry with three-fold character, consistent with
tilted cyclic trimers. While the presence of trimers, specifically
cyclic trimers, is not surprising, based on mass spectrometry of
subliming solid WO
3
and on DFT calculations, the STM
images are much more compelling than inferences made on the
basis of consistency with calculations and experiments on gas
phase species. In the absence of STM, the dispersity, location,
and internal structure of the deposited material are ambiguous.
The TPD of physisorbed N
2
from as-deposited WO
3
is
interesting because it offers no evidence for sterically blocked
Ti
4+
sites being replaced by resolvable W
6+
sites. The N
2
desorption intensity associated with Ti
4+
sites on clean
TiO
2
(110) (70–140 K) decreases monotonically as WO
3
is
added, while the TPD intensity increases, but not mono-
tonically, at low temperatures (30–70 K). On clean TiO
2
(110),
N
2
desorption in this region is associated with O
2À
anions. The
increased intensity in this region for as-deposited WO
3
would,
thus, be consistent with replacing Ti
4+
sites with O
2À
sites of the
deposited material. This is not incompatible with the proposed
physisorption of cyclic trimers of WO
3
. In cyclic (WO
3
)
3
, there
are four electronegative oxygen atoms bonded to each W atom.
The attractive physisorption potential between this structure
and N
2
would be spatially dominated by the oxygen atoms. The
J. Kim et al. / Catalysis Today 120 (2007) 186–195 193
explanation remains unclear for why the low temperature N
2
TPD intensity does not continue to increase with the amount of
added WO
3
.
After annealing to 450 K, there is intensity in TPD of
physisorbed N
2
at temperatures higher than those characteristic
of Ti
4+
. We offer two possible explanations. (1) The
transformation from physisorbed to chemisorbed (WO
3
)
3
is
accompanied by geometry and electron distribution changes
that expose W
6+
to N
2
. (2) The Ti cations adjacent to
chemisorbed (WO
3
)
3
are electronically altered such that the
non-bonding attractive potential with N
2
is enhanced. A
comparable intensification at higher temperatures is not evident
in TPD of CH
3
OH.
What drives the irreversible changes in the STM images and
the N
2
TPD upon annealing remains an open question. While
we cannot eliminate a possibility of deposition of other WO
3
oligomers, our results can be interpreted assuming only cyclic
(WO
3
)
3
is deposited and, at 300 K, only the physisorption
potential between (WO
3
)
3
and TiO
2
(110) is accessible. The
variable length of the dark regions in the STM images (Fig. 4)
for as-deposited material suggests that material arriving during
deposition is readily adsorbed but the attractive interaction with
the substrate is characterized by small barriers along the [001]
direction that allows the adsorbed species to diffuse readily.
Stabilization occurs upon contact with other adsorbed species,
forming 1D variable length island rows along the [001]
direction of the supporting titania. The poorly defined edges of
these 1D islands and the larger scale streaking, commonly
observed when imaging as-deposited material, are consistent
with physisorption at 300 K. Annealing above 450 K results in
a significant restructuring of the adsorbed WO
3
and in the
formation of monodisperse, tightly bound (WO
3
)
3
trimers. The
annealing required for the formation of (WO
3
)
3
trimers
indicates the presence of a small activation barrier that hinders
spontaneous formation of such trimers directly upon room
temperature deposition.
A detailed description of the chemisorption bonding between
(WO
3
)
3
and TiO
2
(110) awaits theoretical calculations. Qualita-
tively, strong and highly localized bonding is required to account
for the thermal stability and the absence of evidence for thermally
induced clustering of trimers up to 750 K. In a model that
positions trimers as shown in Fig. 11c, i.e., with the trimer center
midway between adjacent Ti
4+
cations, one O atom in the cycle
and two peripheral O atoms are in proximity to two Ti
4+
cations
beneath. By rehybridizing the electron density, it is plausible to
form W–O–Ti bonds that increase the coordination of two Ti
4+
atoms from 5 to 6, i.e., full coordination. Accompanying
structural changes (bond lengths and angles) of O, W and Ti are
expected but, not surprisingly, are too small to be detectable as
shifts of W
4f
and Ti
2p
core level BEs and cannot be resolved in
STM images.
The appearance of 3D clusters long before the TiO
2
(110)
substrate is fully covered can be qualitatively understood
assuming a limited mobility of WO
3
during deposition and
annealing. In this model, (WO
3
)
3
that collides with TiO
2
(110)
as it arrives can diffuse, but (WO
3
)
3
that collides with
previously formed 1D (WO
3
)
3
islands cannot and, thus, forms
nascent 3D structures. Upon annealing, the nascent 3D clusters
rearrange internally to build small crystallites of WO
3
that
chemically bond to the titania support in the same way as
isolated (WO
3
)
3
. The low BE shoulder evident upon annealing
relatively high coverages of WO
3
to 900 K and interpreted as
modest loss of oxygen coordination to W (Fig. 5) may involve
thermally activated loss of oxygen from these tiny 3D
crystallites by O
2
desorption from WO
3
and/or movement of
O atoms from the WO
3
species to TiO
2
filling pre-existing
vacancies and vacancies formed during the high temperature
annealing. Distinguishing among these might be addressed by
future experiments examining the W XPS spectra for
conditions analogous to those of Fig. 5 where the initial
vacancy concentration is varied systematically.
5. Summary
A procedure is described for preparing a novel model system
for catalysis studies. Monodispersed cyclic (WO
3
)
3
trimers are
prepared via sublimation of WO
3
powder at $1150 K, onto
TiO
2
(110) at 300 K, and annealing to temperatures up to 750 K.
The monodispersed cyclic trimers are evidenced on the basis of
XPS and highly resolved STM images. The thermally stable
and monodispersed nature of the trimers makes this a very
attractive platform for model system surface science investiga-
tion of oxide nanocluster surface chemistry.
Key observations include:
(a) According to XPS, for all processing temperatures below
750 K, the stoichiometry of the deposited material is WO
3
,
and the W
4f
XPS BE is characteristic of W
6+
(fully oxidized).
(b) While it does not change XPS, annealing irreversibly alters
TPD of physisorbed N
2
and STM images.
(c) After (but not before) annealing submonolayers, STM
images combined with mass uptake measurements reveal
monodispersed cyclic trimers aligned with the Ti
4+
rows of
the substrate.
Acknowledgements
This work was supported by the U.S. Department of Energy
Office of Basic Energy Sciences, Chemical Sciences, and it was
performed at the W.R. Wiley Environmental Molecular Science
Laboratory, a national scientific user facility sponsored by the
Department of Energy’s Office of Biological and Environmental
Research located at Pacific Northwest National Laboratory.
PNNL is operated for the U.S. DOE by Battelle under Contract
No. DE-AC06-76RLO 1830. JMW acknowledges support by the
U.S. Department of Energy, Office of Basic Energy Sciences,
Chemical Sciences Division under grant DE-FG02-03ER15480
to the University of Texas and the Center for Materials Chemistry
at the University of Texas. We thank Dr. Xin Huang andProf. Lai-
Sheng Wang for providing the results of the DFT calculations for
valuable discussions.
References
[1] M. Valden, X. Lai, D.W. Goodman, Science 281 (1998) 1647.
J. Kim et al. / Catalysis Today 120 (2007) 186–195194
[2] S. Abbet, A. Sanchez, U. Heiz, W.D. Schneider, A.M. Ferrari, G.
Pacchioni, N. Rosch, J. Am. Chem. Soc. 122 (2000) 3453.
[3] K. Judai, S. Abbet, A.S. Worz, U. Heiz, C.R. Henry, J. Am. Chem. Soc.
126 (2004) 2732.
[4] B. Yoon, H. Hakkinen, U. Landman, A.S. Worz, J.M. Antonietti, S. Abbet,
K. Judai, U. Heiz, Science 307 (2005) 403.
[5] U. Heiz, W.D. Schneider, Crit. Rev. Solid State Mater. Sci. 26 (2001)
251.
[6] Z. Song, T.H. Cai, Z.P. Chang, G. Liu, J.A. Rodriguez, J. Hrbek, J. Am.
Chem. Soc. 125 (2003) 8059.
[7] J. Kim, Z. Dohnalek, J.M. White, B.D. Kay, J. Phys. Chem. B 108 (2004)
11666.
[8] J. Schoiswohl, G. Kresse, S. Surnev, M. Sock, M.G. Ramsey, F.P. Netzer,
Phys. Rev. Lett. 92 (2004) 206103.
[9] J. Schoiswohl, S. Surnev, F.P. Netzer, Top. Catal. 36 (2005) 91.
[10] J. Biener, E. Farfan-Arribas, M. Biener, C.M. Friend, R.J. Madix, J. Chem.
Phys. 123 (2005) 094705.
[11] D. Song, J. Hrbek, R. Osgood, Nano Lett. 5 (2005) 1327.
[12] J. Biener, M. Baumer, R.J. Madix, Surf. Sci. 432 (1999) 178.
[13] Q.G. Wang, R.J. Madix, Surf. Sci. 474 (2001) L213.
[14] N. Magg, et al. J. Catal. 226 (2004) 88.
[15] N. Magg, J.B. Giorgi, T. Schroeder, M. Baumer, H.J. Freund, J. Phys.
Chem. B 106 (2002) 8756.
[16] C.L. Thomas, Catalytic Processes and Proven Catalysts, Academic Press,
New York, 1970.
[17] J. Pasel, P. Kassner, B. Montanari, M. Gazzano, A. Vaccari, W. Makowski,
T. Lojewski, R. Dziembaj, H. Papp, Appl. Catal. B 18 (1998) 199.
[18] A. Butler, C. Nicolaides, Catal. Today 18 (1993) 443.
[19] W.Z. Cheng, V. Ponec, Catal. Lett. 25 (1994) 337.
[20] M.A. Alvarez-Merino, F. Carrasco-Marı
´
n, C. Moreno-Castilla, J. Catal.
192 (2000) 374.
[21] C. Moreno-Castilla, M.A. Alvarez-Merino, F. Carrasco-Marı
´
n, React.
Kinet. Catal. Lett. 71 (2000) 137.
[22] G. Busca, Phys. Chem. Chem. Phys. 1 (1999) 723.
[23] V.M. Benitez, C.A. Querini, N.S. Figoli, R.A. Comelli, Appl. Catal. A 178
(1999) 205.
[24] L. Karakonstantis, H. Matralis, Ch. Kordulis, A. Lycourghiotis, J. Catal.
162 (1996) 306.
[25] E. Iglesia, D.G. Barton, S.L. Soled, S. Miseo, J.E. Baumgartner, W.E.
Gates, G.A. Fuentes, G.D. Meitzner, Stud. Surf. Sci. Catal. 101 (1996)
533.
[26] U. Diebold, Surf. Sci. Rep. 48 (2003) 53.
[27] H. Schlichting, D. Menzel, Rev. Sci. Instrum. 64 (1993) 2013.
[28] NIST data base, />[29] S. Maleknia, J. Brodbelt, K. Pope, J. Am. Soc. Mass Spectrom. 2 (1991)
212.
[30] Z. Dohna
´
lek, J. Kim, O.A. Bondarchuk, J.M. White, B.D. Kay, J. Phys.
Chem. B 110 (2006) 6229.
[31] X. Huang, H J. Zhai, B. Kiran, L S. Wang, Angew. Chem. Int. Ed. 44
(2005) 7251.
[32] Q. Sun, B.K. Rao, P. Jena, D. Stolcic, Y.D. Kim, G. Gantefor, A.W.
Castleman, J. Chem. Phys. 121 (2004) 9417.
[33] J. Kim, O. Bondarchuk, J.M. White, B.D. Kay, Z. Dohna
´
lek, in preparation.
[34] O. Bondarchuk, J. Kim, J.M. White, B.D. Kay, Z. Dohna
´
lek, in preparation.
J. Kim et al. / Catalysis Today 120 (2007) 186–195 195