- Trang chủ >>
- Khoa Học Tự Nhiên >>
- Vật lý
research on gas - sensing properties of lead sulfide-based sensor for detection
Bạn đang xem bản rút gọn của tài liệu. Xem và tải ngay bản đầy đủ của tài liệu tại đây (571.29 KB, 6 trang )
Please cite this article in press as: T. Fu, Research on gas-sensing properties of lead sulfide-based sensor for detection of NO
2
and NH
3
at room temperature, Sens. Actuators B: Chem. (2009), doi:10.1016/j.snb.2009.03.075
ARTICLE IN PRESS
G Model
SNB-11469; No. of Pages 6
Sensors and Actuators B xxx (2009) xxx–xxx
Contents lists available at ScienceDirect
Sensors and Actuators B: Chemical
journal homepage: www.elsevier.com/locate/snb
Research on gas-sensing properties of lead sulfide-based sensor for detection
of NO
2
and NH
3
at room temperature
Tiexiang Fu
∗
School of Chemistry and Bioengineering, Changsha University of Science & Technology, Chiling Road, Changsha 410077, Hunan, PR China
article info
Article history:
Received 20 November 2008
Received in revised form 28 March 2009
Accepted 31 March 2009
Available online xxx
Keywords:
Nitrogen dioxide
Ammonia
Gas-sensing properties
PbS
Sensor
abstract
In the present paper, the gas-sensing characteristics of novel gas sensors based on PbS were investigated.
The sensors exhibited high responses to NO
2
and NH
3
at room temperature. No response to other gases
was observed. The response magnitude of sensors based on PbS prepared with Na
2
Sat50
◦
C was 266.4
to NO
2
at operating voltage 5 V. The response and recovery time was about 54 and 43 s, respectively.
The response magnitude of PbS prepared with Na
2
Sat80
◦
C was about 301 to NH
3
at operating voltage
5 V. The response and recovery time was about 46 and 67 s, respectively. The influence of the working
temperature and operating voltage on the sensor response was also studied. The sensing mechanism of
the sensor was discussed.
© 2009 Elsevier B.V. All rights reserved.
1. Introduction
Nitrogen dioxide (NO
2
) and ammonia (NH
3
) are foul-smelling
and harmful gases. Nitrogen dioxide is created by the high temper-
ature combustion of coal, chemical production, natural gas or oil
in power plants and also by the combustion of gasoline in inter-
nal combustion engines. One of the consequences of NO
2
being
released into the atmosphere is the formation of photochemical
smog. In addition, NO
2
is a cause of acid rain and is involved in the
depletion of ozone in the stratosphere. Ammonia is the most abun-
dant alkalinecomponent in the atmosphere, and it has been focuse d
air quality regulatory attention on the livestock and poultry indus-
tries [1,2]. Other typical sources of ammonia include fertilizers,
soils and production of chemicals, etc. The importance of the detec-
tion of these gases is evident. There are needs for nitrogen dioxide
and ammonia sensors are used in many situations including leak-
detection in air-conditioning systems and environmental sensing of
trace amounts ambient NH
3
or NO
2
in air, and the automatic control
of the chemical engineering production process involving ammonia
or nitrogen dioxide [3]. Generally, because these gases are toxic, it is
necessary to be able to sense low levels (∼ppm) of NO
2
or NH
3
, but
the ability to sense high levels (∼%) of NO
2
and NH
3
gases should
also be required in certain areas such as the automatic control of
the chemical engineering production process.
Sensors based on metal oxide [4–14], porous silicon [15], SiC
[3] and carbon nanotubes [16–18] have been widely used for the
∗
Tel.: +86 7315726803.
E-mail address:
detection of NO
2
or NH
3
. But the majority of the sensors showed
a high response and good selectivity to NH
3
or NO
2
only at high
temperatures. In recent years, considerable research has been done
to investigate the NO
2
-orNH
3
-sensing properties of metal com-
plex [19–21]. A highly selective NH
3
sensor based on potassium
trisoxalateferrate(III) complex [22] andaNO
2
gas sensor based
on complex [Cr(bipyO
2
)Cl
2
]Cl [23] have also been reported by our
group.
Lead sulfide (PbS) is normally used as optical and semiconduc-
tor materials [24]. The practical application of PbS in a gas sensor
has only been studied by Y. Shimizu and his group. They carried
out systematically research determine the gas-sensing properties
of the Pb
1−x
Cd
x
S(x = 0.1, 0.2)-based and the metal-mono sulfide-
based (NiS, CdS, SnS and PbS) solid electrolyte sensor elements. The
sensor elements gave good SO
2
sensitivity at 300–400
◦
C [25,26].
But there is no report about the NO
2
- and NH
3
-sensing properties
of PbS till date.
In present paper, the gas-sensing characteristics of PbS were
investigated for the nee d to develop sensitive, reliable and low cost
sensors for toxic gases. Novel gas sensors were fabricated based on
a single component of PbS layer and their responses to toxic gases
were studied. The influences of preparation conditions of PbS on
the sensor response and selectivity were also investigated.
2. Experimental
2.1. Preparation of lead sulfide
Na
2
S used for precipitating agent. Lead acetate (10 g) was dis-
solved in 100 mL of water, and 80 mL of a Na
2
S solution (0.38 mol/L)
0925-4005/$ – see front matter © 2009 Elsevier B.V. All rights reserved.
doi:10.1016/j.snb.20 09.03.075
Please cite this article in press as: T. Fu, Research on gas-sensing properties of lead sulfide-based sensor for detection of NO
2
and NH
3
at room temperature, Sens. Actuators B: Chem. (2009), doi:10.1016/j.snb.2009.03.075
ARTICLE IN PRESS
G Model
SNB-11469; No. of Pages 6
2 T. Fu / Sensors and Actuators B xxx (2009) xxx–xxx
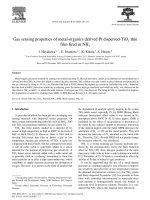
Fig. 1. Schematic structure of the sensor.
was slowly dropped into this lead acetate solution (0.3 mol/L) and
then stirred at a temperature of 50
◦
C. The resulting precipitate was
washed with distilled water several times and filtered. Finally, PbS
particles were dried 2 h at 150
◦
C. Another kind of PbS particle was
prepared at reaction temperature of 80
◦
C similar to the method
and procedure described above.
H
2
S used for precipitating agent. 0.03 mol H
2
S was slowly injected
into 100 mL of lead acetate solution (0.3 mol/L) and vigorously
stirred at temperature 50
◦
C. The resulting precipitate was washed
with distilled water several times and filtered. Finally, PbS particles
were dried 2 h at 150
◦
C. Another kind of PbS particle was prepared
similar to the method and procedure described above, only with a
reaction temperature of 80
◦
C.
2.2. Sensor fabrication
PbS particles were mechanically milled in a PVA (polyvinyl alco-
hol) medium using an agate pestle and mortar for 4 h to form a
paste. The paste was coated on an aluminum oxide tube on which
a pair of interdigited electrodes made of graphite film was previ-
ously coated and two platinum leads had been installed on different
graphitefilms. The elementwas dried at 105
◦
C for 4 h.The thickness
of the PbS layer as a gas-sensing layer was about 5 m. A platinum
heating wire having a 0.05 mm diameter was inserted to form a
side-heated gas sensor (see Fig. 1). Finally, the sensing element was
soldered on a pedestal with a vent hole, and then was cased in a
plastic vessel with a reticulate vent. Four kinds of PbS were used to
make the sensors under the same process conditions.
2.3. Measurement of the sensing characteristics
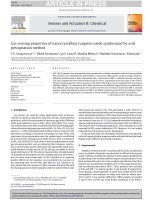
Because the sensor’s interelectrode gap influences the electrical
resistance and response to gases, it is very important to take this
fact into account and make comparisons only for devices having
identical interelectrode gaps. Therefore, sensors having an inter-
electrode gap of 0.1 mm only were studied. The graphic measuring
principle is shown in Fig. 2. Measurements of gas-sensing prop-
erties were carried out using a system with an airtight chamber
of 10 L. To ensure the environment in the airtight chamber was
nearly at atmospheric pressure, a dilatation film was connected to
the airtight chamber. The dilatation film could be distended when
the chamber was overly filled with sample gases. The sample gases
could also circulate by using a miniature fan installed in the airtight
chamber. The sensor element was exposed to sample gases of vari-
able concentrations, containing a known amount of air. During the
sensing measurement, the sample gas concentrations were altered
by injecting sample gases into the airtight chamber using a sample
injector. A heating voltage (V
h
) was supplied to the coil for heating
the sensor and the working temperature of the sensor element was
Fig. 2. Electric circuit for gas-sensing measurement.
changed from room temperature to 85
◦
C by controlling the heater
voltage. Operating voltages (V
O
) of 2 V, 5 V, 10 V and 20 V dc were
applied across the circuit, and the voltage outputs (V
S
) across the
sampling resistor were recorded (range: from 0.1 to 2000 mV). The
electrical resistance of a sensor was measured in sample gases and
also in air. The transformational relation between the resistance (R)
of a sensor and the output voltage of the sampling resistor in circuit
is given by the following formula:
R = (V
O
− V
S
)R
S
/V
S
where R
S
is the resistance values of the sampling resistor. The elec-
trical resistance of a sensor was measured in sample gases and also
in air. The sensor response was defined as RS = R
a
/R
g
, where R
a
is the
baseline resistance of the sensor in dry air and R
g
is the resistance
value in the presence of a gas to be measured.
To examine reproducibility of the sensor response, the sensor
was exposed alternately to 0.9 and 1.2% NO
2
(or 3.1 and 6.5% NH
3
)
gas and to dry air at room temperature for a repeated five cycles
alternately. The dry air and the NO
2
(or NH
3
) gas were maintained
under constant conditions during the measurements. A calibration
curve, the relation between sensor response and NO
2
(or NH
3
)
concentration, was obtained by changing the NO
2
(or NH
3
)gas
concentration from 0.004 to 9.23% at room temperature.
The response or recovery time is the time for the voltage change
to reach 90% of the total change from V
(out)a
to V
(out)g
or vice versa.
The response and recovery time of sensors depended on the thick-
ness of the gas-sensing layer. The thinner the layer, the shorter the
response or recovery time was, in general. However, the responses
to NO
2
and NH
3
decreased when the thickness of the gas-sensing
layer was too thin. The response and recovery time of the sensor in
the present study were all measured at the optimizing thickness of
gas-sensing layer, about 5 m.
Two sensors were heated for a week continuously, and then the
stability of the sensors was examined by comparing the data of
sensing properties at room temperature before and after the heat-
ing.
Please cite this article in press as: T. Fu, Research on gas-sensing properties of lead sulfide-based sensor for detection of NO
2
and NH
3
at room temperature, Sens. Actuators B: Chem. (2009), doi:10.1016/j.snb.2009.03.075
ARTICLE IN PRESS
G Model
SNB-11469; No. of Pages 6
T. Fu / Sensors and Actuators B xxx (2009) xxx–xxx 3
3. Results and discussions
3.1. Gas-sensing properties
3.1.1. Sensor response and selectivity
Fourteen kinds of sample gases such as ammonia (NH
3
), water
vapor (H
2
O), hydrogen sulfide (H
2
S), sulfur dioxide (SO
2
), nitro-
gen dioxide (NO
2
), formaldehyde (HCHO), methanol (CH
3
OH),
ethanol (C
2
H
5
OH), acetone (CH
3
COCH
3
), benzene (C
6
H
6
), toluene
(C
7
H
8
), ethyl ether (C
4
H
10
O), tetrahydrofuran (C
4
H
8
O) and chloro-
form (CHCl
3
) were tested. The concentrations of these gases were
changed from 0 to 9.23% (the ratio of sample gas volume to air
volume). The sensor responses to sample gases were measured at
nine working temperatures (25, 30, 35, 40, 45, 55, 65, 75, 85
◦
C)
and four operating voltages (2, 5, 10 and 20 V), and the measure-
ments were replicated five times for each operating voltage and
each temperature.
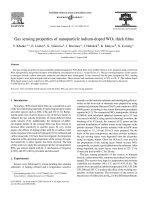
The results obtained from the sensor response study are shown
in Fig. 3(a) and (b). Only representative data at room temperature
and 5 V operating voltage are shown in Fig. 3(a) and (b), respec-
tively. Fig. 3 shows that sensors had a very high response to NH
3
and NO
2
gases at room temperature. No response to H
2
S, SO
2
, water
vapor (H
2
O) and organic solvent vapors was observed. However, the
sensor responses to NH
3
and NO
2
depend on the PbS preparation
condition. The response magnitude of the sensors based on PbS
prepared with Na
2
Sat50
◦
C was about 266.4 to NO
2
and 21.2 to
NH
3
(see Fig. 3(a)), respectively. The response magnitude of PbS
prepared with Na
2
Sat80
◦
C was about 105 to NO
2
and 296 to
NH
3
(see Fig. 3(b)), respectively. The experimental results of anti-
interference at room temperature and 5 V operating voltage showed
that, as long as the concentration of NO
2
and NH
3
is more than 0.6%,
other gases will not interfere with the determination of NH
3
and
NO
2
. The behavior of the sensors is also very similar at other oper-
ating voltages and other working temperatures. However, NH
3
will
not interfere with the determination of NO
2
only with the sensors
based on PbS prepared with Na
2
Sat50
◦
C.
3.1.2. Sensor response to NO
2
To investigate the influences of preparation condition of PbS
on the sensor response, two cheap reagents, hydrogen sulfide and
sodium sulfide were used as precipitation agents in order to reduce
sensor costs and two temperatures, 50 and 80
◦
C, were chosen to
examine the effects of temperature. The temperature selection con-
siders two points: First, control the temperature below the boiling
point to prevent the solution was evaporated excessively resulting
in concentration changes. Second, is separated evenly between the
room temperature and the boiling point. Sensors fabricated from
PbS prepared under four conditions (Na
2
Sat50
◦
C, Na
2
Sat80
◦
C,
H
2
Sat50
◦
C and H
2
Sat80
◦
C) were studied at four operating volt-
ages (2, 5, 10 and 20 V). The highest values of response to NO
2
at
room temperature are shown in Table 1. All sensors are sensitive
to NO
2
. The most responsive sensor to NO
2
was that based on PbS
prepared with Na
2
Sat50
◦
C. This sensor had the highest response
value at 5V operating voltages. The response and recovery time of
sensors at optimal thickness of gas-sensing layer (5 m) are about
Table 1
Sensor’s highest value of response to NO
2
in a room temperature (each highest
response value appears at a different concentration).
Preparation of PbS with Operating voltage (V)
25 1020
Na
2
Sat50
◦
C 96.1 266.4 82.7 32.5
Na
2
Sat80
◦
C 37.6 105.0 64.2 50.4
H
2
Sat50
◦
C 51.2 84.9 17.7 13.7
H
2
Sat80
◦
C 72.9 232.7 49.2 18.8
Fig. 3. Typical responses to different test gases of two sensors based on PbS at room
temperature and 5 V operating voltage. (a) PbS were prepared with Na
2
Sat50
◦
C,
and (b) using Na
2
Sat80
◦
C.
54 and 43 s, respectively. The average relative deviation was about
2.8%. The second most responsive sensor to NO
2
was the sensor
based on PbS prepared with H
2
Sat80
◦
C. The response and recovery
time of the sensor was about 135 and 98 s, respectively. The average
relative deviation was about 7.3%. The influences of precipitation
agents and temperature of preparation PbS on the sensor response
were not clearly explained. One of possible reasons is that sulfur
ion concentration, chemical reaction rate and temperature influ-
ence the surface area and the activation absorption center (position
and quantity) of precipitates.
The sensor response to NO
2
depends on the gas concentration.
The sensor response curve to NO
2
at the optimal operating volt-
age, based on PbS prepared with Na
2
Sat50
◦
C, is shown in Fig. 4.
Please cite this article in press as: T. Fu, Research on gas-sensing properties of lead sulfide-based sensor for detection of NO
2
and NH
3
at room temperature, Sens. Actuators B: Chem. (2009), doi:10.1016/j.snb.2009.03.075
ARTICLE IN PRESS
G Model
SNB-11469; No. of Pages 6
4 T. Fu / Sensors and Actuators B xxx (2009) xxx–xxx
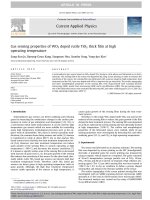
Fig. 4. The correlation between NO
2
gas concentration and responses of the sensors
based on PbS was prepared with Na
2
Sat50
◦
C at the optimal operating voltage and
in a room temperature.
The variations of the sensor response may be divided into three
stages. Before 0.25% NO
2
, the response increased slightly with an
increase in NO
2
concentration. When the NO
2
concentration was
between 0.25and 1.55%, the response increased rapidly from 6.5
to 266. When the NO
2
concentration exceeded 1.55%, there is a
slight decrease with increasing NO
2
concentration. Other sensor’s
response curves also indicate similar responses to NO
2
gas, respec-
tively.
The operating voltage had an influence on sensor’s response
to NO
2
gas at room temperature. All the sensor responses to NO
2
increased and then decreased with an increase in operating voltage
at room temperature. The optimum operating voltage of sensor was
5V.
3.1.3. Sensor response to NH
3
Table 2 shows the highest values of sensor’s response to NH
3
at
room temperature. From Table 2, we can see that the most respon-
sive sensor to NH
3
was that based on PbS prepared with Na
2
Sat
80
◦
C. This sensor had the highest response value at 5 V operating
voltages. The response and recovery time was about 46 and 67 s,
respectively. The average relative deviation was about 3.6%. The
sensor based on PbS prepared with H
2
Sat50
◦
C had a very high
response to NH
3
, too. The response and recovery time was about
78 and 94 s, respectively. The average relative deviation was about
3.4%. Comparison with the sensor response to NO
2
, the temperature
and the precipitating agents of preparation PbS have an opposite
influence to the sensor response to NH
3
. The possible reasons are
Table 2
Sensor’s highest value of response to NH
3
in a room temperature (each highest
response value appears at a different concentration).
Preparation of PbS with Operating voltage (V)
25 1020
Na
2
Sat50
◦
C 11.8 21.2 14.3 17.1
Na
2
Sat80
◦
C 12.9 296.0 69.4 31.9
H
2
Sat50
◦
C 12 225.1 43.6 17.5
H
2
Sat80
◦
C 11.2 27.2 18 15.2
Fig. 5. The correlation between NH
3
gas concentration and responses of the sensors
based on PbS was prepared with Na
2
Sat80
◦
C at the optimal operating voltage and
in a room temperature.
that NH
3
and NO
2
on the surface of PbS absorption ways and means
of electron transfer are different.
The variations in response of the sensor based on PbS prepared
with Na
2
Sat80
◦
C with the concentration of NH
3
at the optimal
operating voltage are also shown in Fig. 5. The response curve to
NH
3
at 5 V operating voltage may be divided into two stages. Before
7.08% NH
3
, the response increased rapidly from about 1 to 296.
When the concentration exceeded 7.08% NH
3
, it slightly increased
with an increase in the NH
3
concentration.
The operating voltage also had an influence on sensors response
to NH
3
gas at room temperature. The sensor responses to NH
3
all
increased and then decreased as the operating voltage increasing.
The sensor responses to NH
3
at 2 V operating voltage were lower
than those at 20 V. The optimum operating voltage of the sensor
was also 5 V.
3.2. Relationship between gas response and temperature
The temperature dependences of the sensor response at 5 V
operating voltage are presented in Fig. 6. Fig. 6(a) shows that sen-
sor based on PbS prepared with Na
2
Sat50
◦
C in responses of NO
2
slightly decreased as the temperature increased from room tem-
perature to 47
◦
C. After that, the responses decreased sharply. When
the temperature exceeded 75
◦
C, the sensor did not respond to NO
2
.
Fig. 6(b) shows that responses to NH
3
of the sensor based on PbS
prepared with Na
2
Sat80
◦
C slightly decreased as the temperature
increased from room temperature to 42
◦
C. After that, the responses
decreased sharply. When the temperature exceeded 60
◦
C, the sen-
sor did not respond to NH
3
. Similar results were also obtained from
the studies on the temperature dependence of responses of the
sensor based on PbS prepared under other conditions to NO
2
and
NH
3
.
Two sensors were aged a week by being heated continuously
and keeping their temperature at 120
◦
C by an electric heater of
platinum wire to test the stability of the sensor. Then the sensor
response measurements of NO
2
and NH
3
gases were replicated
Please cite this article in press as: T. Fu, Research on gas-sensing properties of lead sulfide-based sensor for detection of NO
2
and NH
3
at room temperature, Sens. Actuators B: Chem. (2009), doi:10.1016/j.snb.2009.03.075
ARTICLE IN PRESS
G Model
SNB-11469; No. of Pages 6
T. Fu / Sensors and Actuators B xxx (2009) xxx–xxx 5
Fig. 6. The responses as a function of temperature for two sensors based on PbS at
operating voltage 5 V. PbS was prepared under different conditions: (a) with Na
2
S
at 50
◦
C, sensor responses to NO
2
; (b) with Na
2
Sat80
◦
C, sensor responses to NH
3
.
at five concentrations. The measurement results showed popu-
larly consistent with what was done above. The average relative
deviations were in the range of about ±2.7 to NO
2
and ±3.8% to
NH
3
, respectively. The sensors’ electrical resistance in air changed
very poorly. The stability of the gas-sensing layers’ resistance in air
ensures a stable level for the gas sensors’ applications.
3.3. Discussion about the gas-sensing mechanism
It is known that each NO
2
molecule has one lone electron pair
and -bonding electrons and each NH
3
molecule has two lone elec-
tron pairs, which can be donated to other species. Therefore, NO
2
and NH
3
are donors. When the sensor is exposed to NO
2
or NH
3
gas,
the gas molecules are adsorbed on the surface of the gas-sensing
layer and the weak coordinate bonds can be formed between NO
2
or NH
3
and lead(II) in PbS molecules. Electrons are transferred
from NO
2
or NH
3
to the gas-sensing layer and decreasing sen-
sors electrical resistance. The responses should increase with an
increase in NO
2
or NH
3
concentration until reaching the absorp-
tion saturation. The comparison between the response curve to NH
3
and theoretical presumption shows a good agreement with each
other. The saturation response point corresponds to the saturation
point of gases adsorbed. However, the response curve to NO
2
is not
the same. The response increased significantly with an increase in
concentration until the NO
2
gas concentration exceeded a certain
value, as it can be seen in Fig. 4. The relation curves between the
response and gases concentration show a saturation point and an
inflexion.
The response saturation point corresponds to the saturation
point of gases adsorbed, but the inflexion phenomenon shows
that the sensing layer’s gas adsorption may be divided into two
stages. First, as a result of Van der Waals attraction, when the dis-
tance between NO
2
molecules and the surface of the gas-sensing
layer is shortened, the potential energy is decreased to the min-
imum of a nadir. At this stage, it is a physical adsorption and
few electrons transfer to the layers to make the electrical resis-
tance decrease. Second, when the distance is shortened further,
there is a deeper potential well which has a more steady adsorp-
tion, a weak coordination adsorption. The weak coordinate bonds
can be formed with transferring electrons partly from NO
2
to the
gas-sensing layers and thus decreases the electrical resistance of
the layer at this state. There is a threshold value of concentration
between the first and second stage. Only when the gas concen-
tration exceeds the threshold value will the second adsorption
appear. The responses to NO
2
increase sharply with an increase in
concentration.
Since the operating voltage is necessar y for driving electrons in
gas-sensing layers, the operating voltage is one of the main factors
that influences the sensor response to NO
2
and NH
3
gases. However,
when the operating voltage is too high, the sensor responses to
NO
2
and NH
3
gases will decrease. The reason for this behavior is
obvious. An increase in operating voltage results in an increase in
electron concentrations in the layer and at grain boundaries. Since
there is electrostatic repulsion between electronic excess negative
charges in the layer and gaseous NO
2
or NH
3
molecules, the amount
of NO
2
and NH
3
adsorption quantities in the layers decreases. As
a consequence, a decrease in response to NO
2
or NH
3
of the gas-
sensing layer is observed.
It is understandable that temperature affected the sensor
response. Increasing temperature can speed up gas molecules’
motion to weaken the weak coordination adsorption. As a result,
the sensor responses decreased because of a decrease in the amount
of molecules adsorbed and electrons transferred from NO
2
or NH
3
to the gas-sensing layer.
4. Conclusions
In summary, The response and selectivity of four sensor types
based on PbS prepared under four conditions were tested at dif-
ferent temperatures and operating voltages. These sensors showed
high response to NO
2
and NH
3
at room temperature. No response
to H
2
S, SO
2
, water vapor (H
2
O) and organic solvent vapors was
obtained. The best response to NO
2
was the sensor based on PbS
prepared with Na
2
Sat50
◦
C. The response value reached 266 to
1.55% of NO
2
at 5 V operating voltage. The best response to NH
3
was
the sensor based on PbS prepared with Na
2
Sat80
◦
C. The response
value reached 301 to 8.08% of NH
3
at 5 V operating voltage. The
response and recovery time was generally satisfactory. Such sen-
sors have the advantages of being simple to fabricate and having
cheaper prices.
Please cite this article in press as: T. Fu, Research on gas-sensing properties of lead sulfide-based sensor for detection of NO
2
and NH
3
at room temperature, Sens. Actuators B: Chem. (2009), doi:10.1016/j.snb.2009.03.075
ARTICLE IN PRESS
G Model
SNB-11469; No. of Pages 6
6 T. Fu / Sensors and Actuators B xxx (2009) xxx–xxx
References
[1] G. Huyberechts, M. Van Muylder, M. Honor’e, J. Desmet, J. Roggen, Development
of a thin film ammonia sensor for livestock buildings, Sens. Actuators B 18–19
(1994) 296–299.
[2] H. Xin, Y. Liang, A. Tanaka, R.S. Gates, E.F. Wheeler, K.D. Casey, K.D. Heber,
J.Q. Ni, H. Li, Ammonia emissions from U.S. poultry houses. Part I. Mea-
surement system and techniques, in: Proceedings of the Third International
Conference on Air Pollution from Agricultural Operations, NC, 12–15 October,
2003.
[3] E.J. Connolly, B. Timmer, H.T.M. Pham, J. Groeneweg, P.M. Sarro, W. Olthuis, P.J.
French, A porous SiC ammonia sensor, Sens. Actuators B 109 (2005) 44–46.
[4] T.Maekawa, J. Tamaki, N. Miura, N. Yamazoe, Gold-loaded tungsten oxide sensor
for detection of ammonia in air, Chem. Lett. (1992) 639–642.
[5] E. Llobet, G. Molas, P. Molin‘as, J. Calderer, X. Vilanova, J. Brezmes, J.E. Sueiras,
X. Correig, Fabrication of highly selective tungsten oxide ammonia sensors, J.
Electrochem. Soc. 147 (2000) 776–779.
[6] C.N. Xu, N. Miura, Y. Ishida, K. Matsuda, N. Yamazoe, Selective detection of NH
3
over NO in combustion exhaust by using Au and MoO
3
doubly promoted WO
3
element, Sens. Actuators B 65 (2000) 163–165.
[7] X. Wang, N. Miura, N. Yamazoe, Study of WO
3
-based sensing materials for NH
3
and NO detection, Sens. Actuators B 66 (2000) 74–76.
[8] B.T. Marquis, J.F. Vetelino, A semiconductor metal oxide sensor array for the
detection of NO
x
and NH
3
, Sens. Actuators B 77 (2001) 100–110.
[9] J.M. Pedrosa, C.M. Dooling, T.H. Richardson, R.K. Hyde, C.A. Hunter, M.T. Martin,
L. Camacho, Characterization of fast optical response to NO
2
of porphyrin LB
films, J. Mater. Chem. 9 (2002) 2659–2664.
[10] G. Sberveglieri, L. Depero, S. Groppelli, P. Nelli, WO
3
sputtered thinfilms on NO
x
monitoring, Sens. Actuators B 26–27 (1995) 89–92.
[11] M. Penza, M.A. Tagliente, L. Mirenghi, C. Gerardo, C. Martucci, G. Cassano, Tung-
sten trioxide (WO
3
) sputtered thin films for a NO
x
gas sensor, Sens. Actuators B
50 (1998) 9–18.
[12] S.T. Shishiyanu, T.S. Shishiyanu, O.I. Lupan, Novel NO
2
gas sensor based on
cuprous oxide thin films, Sens. Actuators B 113 (2006) 468–476.
[13] M. Penza, C. Martucci, G. Cassano, NO
x
gas sensing characteristics of WO
3
thin
films activated by noble metals (Pd, Pt, Au) layers, Sens. Actuators B 50 (1998)
52–59.
[14] T.S. Kim, T.B. Kim, K.S. Yoo, G.S. Sung, H.J. Jung, Sensing characteristics of dc
reactive sputtered WO
3
thin films as an NO
x
gas sensor, Sens. Actuators B 62
(2000) 102–108.
[15] C. Baratto, G. Faglia, E. Comini, G. Sberveglieri, A. Taroni, V. La Ferrara, L. Quer-
cia, G. Di Francia, A novel porous silicon sensor for detection of sub-ppm NO
2
concentrations, Sens. Actuators B 77 (2001) 62–66.
[16] J. Suhiro, G. Zhou, M. Hara, Fabrication of a carbon nanotubes-based gas
sensor using dielectrophoresis and its application for ammonia detection by
impedance spectroscopy, J. Phys. D: Appl. Phys. 36 (2003) 109–114.
[17] H. Chang, J.D. Lee, S.M. Lee, Y.H. Lee, Adsorption of NH
3
and NO
2
molecules on
carbon nanotubes, Appl. Phys. Lett. 79 (2001) 3863–3865.
[18] S. Chopra, A. Pham, J. Gailard, A. Parker, A.M. Rao, Carbonnanotube-based
resonant-circuit sensor for ammonia, Appl. Phys. Lett. 80 (2002) 4632–4634.
[19] K.S. Suslick, N.A. Rakow, A. Sen, Colorimetric sensor arrays for molecular recog-
nition, Tetrahedron 60 (2004) 11133–11138.
[20] H. Tada, Y. Tanimura, Y. Fujii, Title NO
2
gas sensing with Au/phthalocyanine/Si
heterostructures, Mol. Cryst. Liq. Cryst. Sci. Tech. A 327 (1999) 283–286.
[21] M.I. Newton, T.K.H. Starke, M.R. Willis, NO
2
detection at room temperature with
copper phthalocyanine thin film devices, Sens. Actuators 67 (2000) 307–311.
[22] T. Fu, J. Tao, Novel highly-selective NH
3
sensor based on potassium trisoxalate-
ferrate(III) complex, Sens. Actuators B 129 (2008) 339–344.
[23] T. Fu, Novel NO
2
gas sensor based on Cr(III) complex thin film, Electroanalysis
20 (2008) 68–74.
[24] D. Yu, D. Wang, Z. Meng, J. Lu, Y. Qian, Synthesis of closed PbS nanowires with
regular geometric morphologies, J. Mater. Chem. (2002) 403–405.
[25] Y. Shimizu, M. Okimoto, N. Souda, Solid-state SO
2
sensor using a sodium-ionic
conductor and a metal sulfide electrode, Int. J. Appl. Ceram. Technol. 3 (2006)
193–199.
[26] N. Souda, Y. Shimizu, Sensing properties of solid electrolyte SO
2
sensor using
metal–sulfide electrode, J. Mater. Sci. 38 (2003) 4301–4305.
Biography
Tiexiang Fu is currently a professor at the School of Chemistry and Bioengineer-
ing, Changsha University of Science & Technology. His current research interests are
orientation complexes, gas sensors and electronic nose systems.