- Trang chủ >>
- Khoa Học Tự Nhiên >>
- Vật lý
structural and photocatalytic properties of iron- and europium-doped tio2
Bạn đang xem bản rút gọn của tài liệu. Xem và tải ngay bản đầy đủ của tài liệu tại đây (825.92 KB, 8 trang )
Materials Chemistry and Physics 112 (2008) 146–153
Contents lists available at ScienceDirect
Materials Chemistry and Physics
journal homepage: www.elsevier.com/locate/matchemphys
Structural and photocatalytic properties of iron- and europium-doped TiO
2
nanoparticles obtained under hydrothermal conditions
L. Diamandescu
a,∗
, F. Vasiliu
a
, D. Tarabasanu-Mihaila
a
,M.Feder
a
, A.M. Vlaicu
a
,
C.M. Teodorescu
a
, D. Macovei
a
, I. Enculescu
a
, V. Parvulescu
b
, E. Vasile
c
a
National Institute of Materials Physics, Atomistilor 105 bis, P.O. Box MG-7, Bucharest, Romania
b
Institute of Physical Chemistry ‘I. G. Murgulescu’, Bucharest, Romania
c
METAV S.A., Bucharest, Romania
article info
Article history:
Received 19 February 2008
Received in revised form 10 May 2008
Accepted 16 May 2008
Keywords:
Semiconductors
Hydrothermal synthesis
Doped TiO
2
Nanostructures
Photocatalysis
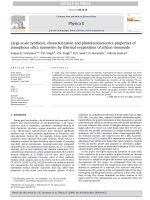
abstract
Iron- andeuropium-doped (≤1 at.%)TiO
2
nanoparticles powders have been synthesized by ahydrothermal
routeat200
◦
C, starting with TiCl
4
, FeCl
3
·6H
2
O and EuCl
3
·6H
2
O. The structure, morphology and optical
peculiarities were investigated by means of X-ray diffraction (XRD), transmission electron microscopy
(TEM), extended X-ray absorption fine structure (EXAFS), M
¨
ossbauer spectroscopy and UV–vis mea-
surements. The photocatalytic performance was analysed in the photodegradation reaction of phenol.
Rietveld refinements of XRD patterns reveal that the as-prepared samples consist in iron- and europium-
doped TiO
2
in the tetragonal anatase structural shape, with particle size as low as 15 nm. By means of
M
¨
ossbauer spectroscopy on both
57
Fe and
151
Eu isotopes as well as by EXAFS analyses, the presence of
Fe
3+
and/or Eu
3+
ions in the nanosized powders has been evidenced. It was found that iron and europium
ions can substitute for titanium in the anatase structure. From the UV–vis reflection spectra, by using
the transformed Kubelka–Munk functions, the band gap energy (E
g
) of the hydrothermal samples has
been determined in comparison with that of Degussa P-25 photocatalyst. A decrease of E
g
from 2.9 eV
found for Degussa photocatalyst to 2.8 eV for the titania doped with 1 at.% Fe has been evidenced, indi-
cating a valuable absorption shift (∼20 nm) towards visible light region. However, the best photocatalytic
activity in the photodegradation reaction of phenol was evidenced for the hydrothermal sample, TiO
2
:
1 at.% Fe, 0.5 at.% Eu, in both UV and visible light regions. The photocatalytic activities of iron-doped and
iron–europium-codoped samples are high and practically the same only in visible light. The photocat-
alytic properties in correlation with the structural and optical peculiarities of the hydrothermal samples
are discussed.
© 2008 Elsevier B.V. All rights reserved.
1. Introduction
Titanium dioxide (titania) is a cheap, nontoxic and highly effi-
cient photocatalyst being extensively applied for the degradation of
organic pollutants, air purification, water splitting, and reduction of
nitrogen to ammonia [1–10]. However, only a small UV fraction of
solar light (<5%) can be utilised because of large band gap (∼3 eV) of
titanium dioxide semiconductor structure. Recently, a considerable
number of studies were devoted to the development of efficient
visible light sensitive photocatalysts and to photocatalytic prop-
erties improvement [11–15]. Transition metal selective doping is
one of the common approaches to extend the spectral response
∗
Corresponding author. Tel.: +40 21 3690170; fax: +40 21 3690177.
E-mail addresses: diamand@infim.ro,
(L. Diamandescu).
of titania to the visible light region. In particular the iron doping
was found to increase the photocatalytic activity up to 2.5 times
[12]. Investigation on chloroform photodegradation revealed a sig-
nificant photocatalytic reactivity increase over nanocrystalline TiO
2
codoped with Fe
3+
and Eu
3+
by sol–gel method, as compared with
undoped or monodoped TiO
2
nanoparticles [16].
It is already established that material properties depend
strongly on precursors and synthesis methods in correlation with
the thermodynamic process parameters. For the synthesis of
nanoparticle systems the hydrothermal method was intensively
utilised in the last decade [17–21]. However, no reports on the
hydrothermal synthesisof iron- and europium-codoped TiO
2
mate-
rials have been published, by our knowledge.
It is the aim of this work to present the hydrothermal synthesis
of iron- and europium-doped and -codoped TiO
2
nanoparticle sys-
tems, their microstructure, morphology and catalytic properties in
the photodegradation of phenol, in both UV and visible light region.
0254-0584/$ – see front matter © 2008 Elsevier B.V. All rights reserved.
doi:10.1016/j.matchemphys.2008.05.023
L. Diamandescu et al. / Materials Chemistry and Physics 112 (2008) 146–153 147
2. Experimental
2.1. Hydrothermal synthesis
Fe
3+
- and Eu
3+
-doped and -codoped nanocrystalline titania samples have been
synthesized by a hydrothermal route, starting with titanium (IV), iron (III) and
europium (III) chlorides in solution. Titanium tetrachloride has been obtained by
air oxidation under vigorous stirring (30 h) from a 15% titanium trichloride in
hydrochloric acid solution. Europium trichloride has been prepared by dissolving
the corresponding europium oxide amount in 2N hydrochloric acid. A 25% ammo-
nium hydroxide solution was added to the acidic solution containing the metal
chlorides in the predetermined ratio. All reagents were of analytical grade (Aldrich
99.99%). The total chloride concentration in solution was 1.10
−2
M. The pH value
was adjusted to ∼10 to assure the complete cation precipitation. After filtration and
washing with distilled water (until no chlorine anions were detected), the amor-
phous mixed hydroxide precipitate was dispersed again in double distilled water
and brought up to a volume of 30 cm
3
. The obtained suspension was placed into a
50 cm
3
Teflon-lined autoclave and then heated at 200
◦
C for 1 h. The heating rate
was 10
◦
Cmin
−1
and the corresponding vapour pressure at 200
◦
C was about 15 atm.
The autoclave was cooled to room temperature and the resulting colloidal suspen-
sion of iron/europium-doped titanium oxide was heated at 50
◦
C for several hours
to remove water. The following hydrothermal sample codes are used in this paper:
undoped sample (TiO
2
); TiO
2
: 1 at.% Fe (sample TF); TiO
2
: 0.5 at.% Eu (sample TE);
TiO
2
: 1 at.% Fe, 0.5 at.% Eu(sample TFE). Owing to the nature of the synthesis process,
the accurate doping level could not be consistently predicted and the percent values
represent the nominal values of Fe or Eu atomic concentrations.
2.2. Structural characterisation
X-ray diffraction (XRD) patterns obtained on DRON 2 X-ray diffractome-
ter (linked to a data acquisition and processing facility with CuK
␣
radiation
=1.540598
˚
A and a graphite monochromator) were used to determine the iden-
tity of any phase present and their crystallite size. JEOL 200 CX electron microscope
operating at an accelerating voltage of 200 kV was utilised to obtain information
about the structure and morphology of mixed oxide nanoparticles. Particle sizes
were measured from bright field (BF) and dark field (DF) images, whereas the
phase content was investigated by electron diffraction. For the transmission elec-
tron microscopy (TEM) investigations the samples have been prepared by placing
a drop of oxide powder, ultrasonically dispersed in ethanol, on 3 mm holey car-
bon grid. The HRTEM images were obtained with a CM120ST Philips transmission
electron microscope (resolution ∼2
˚
A).
57
Fe and
151
Eu transmission M
¨
ossbauer spec-
troscopy was applied to prove the presence of iron and europium dopants in the
titania structure. A standard constant acceleration transmission M
¨
ossbauer spec-
trometer was used to record the room temperature spectra on both isotopes. The
local structure around the dopant atoms was investigated by extended X-ray absorp-
tion fine structure (EXAFS) spectroscopy. The X-ray absorption measurements have
been carried out at the E4 HASYLAB beam line (Germany), by using a double crystal
Si (1 11) monochromator and a pre-focusing Au mirror. EXAFS spectra have been
measured in transmission mode, at Fe K- and Eu L
2
-edges for the doped photocata-
lysts, ␣-Fe
2
O
3
and Eu
2
O
3
standards. The TiO
2
(anatase) standard has been measured
correspondingly at theTi K-edge. Normalized EXAFS function (k)(k = photoelectron
wave number) was calculated after subtraction of pre-edge and post-edge smooth
backgrounds, (fitted by Victoreen formula and cubic splines, respectively) from the
absorption spectra. k
n
-weighted (k)(n = 2, 3) was Fourier transformed over the k-
range 2.8–11.2
˚
A
−1
(Fe K) or 1.3–10.2
˚
A
−1
(Eu L
2
), to acquire preliminary information
on the dopant environment. Radial ranges of interest in the Fourier transforms (FT)
were further isolated by Hanning-function windows, backtransformed into k-space,
and non-linearly fitted by a least-square method. The fit provided the interatomic
distances and coordination numbers in the close neighbouring shells of the absorb-
ing atoms (Fe, Eu). The photoelectron backscattering amplitudes and phases, as
calculated by the FEFF6 code [29], have been used in the fitting runs. The UV–vis
measurements have been performed on the PerkinElmer Lambda 45 Spectrome-
ter in the wavelength range of 200–800 nm, with 0.5 nm step at a scan speed of
60 nms
−1
.
2.3. Photocatalytic activity tests
The phenol photodegradation was investigated using a stationary quartz reac-
tor with UV (60 W, filter at =312 nm), and visible (60 W, >380 nm) lamps. The
photocatalytic activity was evaluated from the decomposition of phenol in aqueous
solution at 2 M or 0.2M concentrations. The experiments were carried out in quartz
made cylindrical flask. The pre-aerated reaction mixture was illuminated with UV
or visible light under continuous magnetic stirring. The reactor was maintained at
room temperature for all experiments. The distance between the light source and
the reaction tube was 11 cm. After a given irradiation time, samples of 4 ml volume
were withdrawn and the catalysts were separated from the suspensions by filtration
through cellulose membranes. Thereaction products were filtered through Millipore
membrane filters and analysed on a DANI GC 1000 gas chromatograph.
3. Results and discussion
3.1. X-ray diffraction
Primary structural information was given by XRD patterns of the
hydrothermal samples (Fig. 1a–d).
All spectra display the characteristic patterns of TiO
2
in tetrag-
onal anatase phase (the anatase characteristic lines are indexed in
Fig. 1a). No relevant differentiation can be observed by changing
the doping element (Fig. 1b–d) except for small line intensity vari-
ations and a slight increase of diffraction line widths from undoped
(Fig. 1a) to codoped (Fig. 1d) samples. Rietveld refinement of XRD
patterns reveals a slight increase of anatase lattice parameters a
(∼0.14%) and c (∼0.04%), suggesting the presence of higher radius
doping ions in the TiO
2
lattice. A particle mean size of about 15 nm
(calculated with Scherrer equation) was found to characterise the
hydrothermally doped anatase.
3.2. Transmission electron microscopy
The electron diffraction and electron microscopy analysis evi-
dence the presence of anatase like structure with particle mean size
as low as 15 nm and a strong morphology dependence on doping
element. Thus, a rectangular and quadratic morphology is predom-
Fig. 1. XRD patterns of hydrothermally synthesized doped and undoped TiO
2
.
148 L. Diamandescu et al. / Materials Chemistry and Physics 112 (2008) 146–153
Fig. 2. TEM images of undoped TiO
2
(a), Eu-doped TiO
2
(b) and Fe- and Eu-doped TiO
2
(c).
inant for undoped and Fe-doped TiO
2
samples (Fig. 2a). In Eu-doped
TiO
2
many elongated particles can be seen (Fig. 2b) whereas large
shape diversity is found in codoped Fe and Eu-TiO
2
specimen
(Fig. 2c). In many cases the lattice (1 0 1) planes (d
101
= 0.352 nm)
of anatase can be clearly solved (Fig. 3a) and selected area elec-
tron diffraction patterns confirm theunique presence ofthe anatase
phase (Fig. 3b).
3.3. M
¨
ossbauer spectroscopy
The specific presence of both iron and europium ions in the
doped TiO
2
samples is supported by the M
¨
ossbauer spectroscopy
measurements. In Fig. 4 the
151
Eu M
¨
ossbauer spectrum of the
TFE sample is presented. In spite of the poor effect, the spectrum
indicates the presence of the Eu
3+
ions in the TiO
2
anatase lat-
tice [22]. The presence of iron ions together with their valence
states has been evidenced by M
¨
ossbauer spectrum on the TF sam-
ple, 90% enriched in
57
Fe in order to improve the signal-to-noise
ratio (Fig. 5). The best fit was obtained with the isotropic elec-
tronic relaxation model [23]. The values of M
¨
ossbauer hyperfine
parameters (isomer shift and quadrupole splitting) are character-
istics for Fe
3+
[22]. In others words, the iron ions are present in the
TiO
2
lattice, the spin–spin electron interaction between the neigh-
bouring Fe
3+
ions giving rise to the relaxation M
¨
ossbauer spectrum
[23].
3.4. EXAFS
A more detailed analysis on the dopant location and resulting
interactions has been carried out by EXAFS investigations. The k
3
-
weighted Fe K-edge EXAFS spectra of the doped samples TF, TFE and
␣-Fe
2
O
3
(hematite) are shown together with the Ti K-edge EXAFS of
the standard anatase in Fig. 6a. Their Fourier transforms displayed
in Fig. 6b are the radial functions with maxima corresponding, until
a specific shift, to the neighbouring shells of the absorbing species
(Fe, Ti).
In the case of ␣-Fe
2
O
3
, the first maximum of FT corresponds
to the nearest oxygen neighbours, at a mean distance of 2.03
˚
A
(Table 1). The second split maximum, more intense and broadened,
is due to the superposed contributions of closely related shells, at
the mean distances of 2.95
˚
A (4 Fe), 3.38
˚
A (3 Fe, 3O) and3.69
˚
A(6Fe,
6 O). The FT looks differently for anatase, with a less compact tita-
nium surrounding. The first maximum, contributed by six oxygen
neighbours in a distorted octahedral configuration, is dominant,
while the second maximum, corresponding to the next-nearest
neighbours (4 Ti) at 3.04
˚
A, has the amplitude about 2 timessmaller.
The amplitude ratio between the first two maxima in the Fourier
transforms rules out the iron segregation to an oxidized Fe
2
O
3
phase. The photocatalyst FTs closely resemble that of TiO
2
, sug-
gesting similar Fe and Ti surroundings in the doped and undoped
samples. In order to verify this statement, the filtered EXAFS of
L. Diamandescu et al. / Materials Chemistry and Physics 112 (2008) 146–153 149
Fig. 3. (a) HRTEMimage showing (10 1)anatase planesin a TiO
2
nanocrystal belong-
ing to (Fe, Eu)-doped specimen; (b) SAED pattern of the same specimen showing the
main diffraction rings of polycrystalline anatase.
Fig. 4.
151
Eu M
¨
ossbauer spectrum of the sample TiO
2
: 1 at.% Fe, 0.5 at.% Eu showing
the presence of Eu
3+
ions in the host lattice.
Fig. 5.
57
Fe M
¨
ossbauer spectrum of the sample TiO
2
: 1 at.%
57
Fe and the fit with the
isotropic relaxation model (continuous lines).
the photocatalysts corresponding to the first two radial maxima
(r = 0.9–3.1
˚
A) was fitted with two neighbouring shells. The best fit
has been obtained considering for iron and titanium ions the same
local configuration (see Table 1). This result clearly indicates that
Fe
3+
ions substitute for Ti
4+
in the anatase tetragonal structure.
The substitution of Ti
4+
by the larger Fe
3+
ions (Ti
4+
: 0.605
˚
A;
Fe
3+
: 0.645
˚
A [11]) expands the metal–oxygen distances by ∼0.1
˚
A,
up to values close to the Fe
O bond length in ␣-Fe
2
O
3
, while the
metal–metal distances remain unchanged (sample TF) or shorten
(TFE) with respect to these distances in anatase structure [24].A
similar effect was recently reported by Zhu et al. [25] in Fe-doped
anatase samples, being explained by changes of the Ti
O Ti bond
angles after the Ti substitution by Fe.
Europium environment in the sample TFE was investigated by
EXAFS at the Eu L
2
-edge (7617 eV). Since Eu L
3
-edge EXAFS has
stronger oscillations it could not be analysed, due to the superposi-
tion of the Fe K-edge (7112 eV) at 135 eV above Eu L
3
(6977 eV). The
k
2
-weighted EXAFS of the sample is shown in Fig. 7a, together with
the spectra of Eu
2
O
3
(cubic) and anatase, measured at the Eu L
2
-
and Ti K-edges, respectively. The corresponding Fourier transforms
are illustrated in Fig. 7b.
In the cubic structure of Eu
2
O
3
, the Eu atoms are surrounded by
six nearest oxygen neighbours at distances ranging between 2.30
˚
A
and 2.38
˚
A, with an average Eu–O distance of 2.34
˚
A(Table 1). Their
contribution to EXAFS is described by the main maximum of FT, at
1.82
˚
A. The further maxima correspond to more distant Eu shells at
3.60
˚
A and 4.11
˚
A, with six atoms on each shell.
Although the FT of the sample TFE manifests a certain similar-
ity with that of Eu
2
O
3
, its maximum at 2.83
˚
A seems closer related
Table 1
Fe and Eu local environments (interatomic distances R, coordination numbers N)in
the doped samples (TF, TFE), as inferred by the fit of EXAFS
Sample Reference atom R (
˚
A)/N
␣-Fe
2
O
3
Fe 2.03/6 O 2.95/4 Fe
3.38/3 Fe, 3 O
3.69/6 Fe, 6 O
Eu
2
O
3
(cubic) Eu 2.34/6 O 3.60/6 Eu
TiO
2
(anatase) Ti 1.95/6 O 3.04/4 Ti
TiO
2
(rutile) Ti 1.96/6 O 2.96/2 Ti
TF Fe 2.06/6.2 O 3.03/4.3 Ti
TFE Fe 2.03/5.9 O 2.98/4.0 Ti
TFE Eu 2.33/6.3 O 3.37/2.0 Ti
The structural parameters (R, N) were compared with the characteristic of ␣-Fe
2
O
3
,
Eu
2
O
3
(cubic) and TiO
2
(anatase, rutile), calculated from crystallographic data.
150 L. Diamandescu et al. / Materials Chemistry and Physics 112 (2008) 146–153
Fig. 6. k
3
-Weighted Fe K-edge EXAFS spectra (a) and their Fourier transforms (b) for the doped photocatalysts (TF, TFE) and ␣-Fe
2
O
3
. Ti K-edge EXAFS of TiO
2
(anatase) and
the corresponding FT are also shown, for a comparison.
to that describing the Ti–Ti pairs in the TiO
2
structure. The fit of
the filtered EXAFS in the range 1.4–3.2
˚
A resulted in ∼6Oand2Ti
atoms around Eu, at distances of 2.33
˚
A and 3.37
˚
A, respectively (see
Table 1). The presence of titanium in the europium neighbourhood
emphasizes the Eu accommodation on Ti sites in the TiO
2
lattice,
similarly with the Fe case. The large Eu
3+
ions (0.947
˚
A) locally
expand the host structure, with elongations of the interatomic dis-
tances almost equalling with the difference between Eu
3+
and Ti
4+
ionic radii (0.34
˚
A).
A peculiar effect of the Eu incorporation into the TiO
2
lattice
is the change of the local symmetry around Eu, from anatase to
rutile structure. This is indicated by the lowering of the number of
the next-nearest Ti neighbours from four, specific to anatase struc-
ture, to only two, as in rutile lattice. This effect was also found for
neodymium-doped anatase nanoparticles, [26] suggesting that it
could be specific to the rare-earth ions embodied in the TiO
2
lattice.
3.5. UV–vis
The UV–vis absorption edge and band gap energy have been
determined from the room temperature reflectance (R) spec-
tra. The reflectance spectrum of TiO
2
Degussa P-25 commercial
photocatalyst shows the absorption onset at 335 nm while for
hydrothermal samples the absorption settles at 355 nm, which is
20 nm shifted toward the visible range (Fig. 8). Further, the opti-
cal absorbance of the samples was deduced by the Kubelka–Munk
Fig. 7. k
2
-Weighted Eu L
2
-edge EXAFS (a) and corresponding Fourier transforms (b) for the sample TFE and cubic Eu
2
O
3
. Ti K-edge EXAFS of anatase and its FT are also shown.
L. Diamandescu et al. / Materials Chemistry and Physics 112 (2008) 146–153 151
Fig. 8. UV–vis reflectance curves for the hydrothermal TiO
2
doped samples.
formula F(R)=(1− R )
2
/(2R), [27]. Using the Tauc plot (F(R) h)
n
vs
h) [28], where h is the photon energy and n = ½ for direct band
gap semiconductors, the band gap energies were deduced from
the intersection of the Tauc’s region extrapolation with the pho-
ton energy axis (Fig. 9). The calculated band gap energy values are
given in Table 2. For the hydrothermal TiO
2
undoped sample and
TE sample, the band gap energy is about 3.0(3) eV, which is higher
than 2.9(7) eV obtained for the TiO
2
Degussa P-25 sample. The low-
est band gap energy of 2.84 eV was observed for TF sample, while
for TFE sample the energy was 2.92 eV.
Fig. 9. Transformed Kubelka functions [F(R)h]
1/2
for undoped and doped titania
samples to estimate the band gap energies.
Table 2
Band gap energies from UV–vis data on hydrothermal samples as compared with
Degussa P-25
Photocatalyst Band gap energy (eV)
TiO
2
Degussa P-25 2.9 (7)
TiO
2
3.0 (3)
TiO
2
: 1 at.% Fe 2.8 (4)
TiO
2
: 0.5 at.% Eu 3.0 (3)
TiO
2
: 1 at.% Fe, 0.5 at.% Eu 2.9 (2)
3.6. Phenol photodegradation
In the present study, the photocatalytic activity of the modi-
fied titania samples was investigated in the phenol degradation
reaction. The interest was focused on the effects of composi-
tional modifications in titania synthesized by a hydrothermal
route, on water decontamination through photocatalytic degra-
dation/mineralization of organic pollutants. Fig. 10 shows the
conversion degree C
Ph
(%), in the phenol photodegradation reac-
tion at 312 nm, catalyzed by hydrothermally synthesized titania
samples, for two initial phenol concentrations. The undoped tita-
nia gave the lowest phenol conversion, while the codoped Fe/Eu
sample gave the highest activity. For separate doping, the conver-
sion degree can become double or triple as compared to undoped
TiO
2
, while for codoped sample the conversion degree is nearly 6
times greater. In the case of codoped TiO
2
(TFE) sample, conver-
sion degrees up to 30% at low initial phenol concentrations and up
to 15% at higher phenol concentrations were obtained. The higher
degradation degree and no detectable organic compounds for TFE
sample indicate the superiority of this catalyst. A little quantity of
organic compounds was identified after reactions in the presence
of TF and TE catalysts. Hydroquinone, p-benzoquinone and cate-
chol were detected as main reaction intermediates. The presence
of the organic intermediates was attributed to the reduced rate of
hydroxyl radical generation and phenol hydroxylation. The degra-
dation mechanism proposed is based on hydroxylated steps [29].
Full mineralization of organic compounds (as phenols and other
aromatics) on the surface of illuminated titania proceeds via many
steps, which make one-electron oxidation or reduction reactions
possible [30]. In the first step hydroxy radicals are generated by
the reaction between holes, resulted after photo-excitation of the
Fig. 10. Phenol conversion degree C
Ph
(%) after 5 hof UV illumination ( = 312 nm) for
the hydrothermally synthesized TiO
2
samples; 2 M and 0.2 M are the initial phenol
concentrations.
152 L. Diamandescu et al. / Materials Chemistry and Physics 112 (2008) 146–153
Fig. 11. Phenol conversion degree C
Ph
(%) under visible irradiation ( >380 nm) cat-
alyzed by Fe- and Eu-doped and codoped TiO
2
.
semiconductor, and the surface hydroxyl species of the catalyst.
The next step is the hydroxylation of the phenyl ring, followed by
further oxidation of the hydroxylated phenol intermediates.
A remarkable photocatalytic activity increase was obtained in
visible light (>380 nm) for all samples (Fig. 11). The best activity
was obtained for TF and TFE samples where the obtained conver-
sion degree of phenol is as high as 65%. These results are almost
in agreement with UV–vis results revealing a shift of absorption to
visible range for the TF and TFE samples. After 3 h of reaction no
detectable organic intermediates were evidenced.
The best photocatalytic activities of the hydrothermally doped
titania samples can be attributed to the cationic species present in
the doped and codoped titania which avoid possible electron–hole
recombination, stabilizing the holes in the valence band and the
electrons in the conduction band. Moreover, the hydrothermal
catalysts have high surface areas (∼10 0 m
2
g
−1
) and probably a
large amount of O-H surface groups which seem to stabilize the
electron–hole pairs. At this point, we cannot elucidate the relation-
ship between the band gap, shift of the absorption onset toward
the visible range, and the results of the photocatalytic tests. The
TFE specimen revealed a maximum photocatalytic activity in phe-
nol degradation reaction, while its UV–vis spectrum revealed an
intermediate value of the band gap. It seems that surface effects
play a crucial role in determining the photocatalytic properties of
doped titania structures. Probably the europium ions at the surface
of titania nanoparticles increase the life time of electron–hole pairs
improving the photocatalytic properties.
In summary, the undoped titania gives the lowest phenol con-
version, and the transformation of phenol increases for the samples
with Fe or Eu, while the codoped Fe/Eu sample gives the highest
activity.
4. Conclusions
Iron- and europium-doped TiO
2
nanoparticles were obtained by
a hydrothermal route, at mild temperature and pressure (∼200
◦
C
and ∼15 atm, for 1 h). Rietveld refinements of the XRD patterns
reveal the exclusive presence of iron- and europium-doped anatase
phase in hydrothermally synthesized samples; the particle mean
size was less than 15 nm and the morphology was found to depend
on doping element. EXAFS analysis strongly support that both
Fe
3+
and Eu
3+
ions enter the TiO
2
lattice, by substituting the Ti
4+
ions. Ti
4+
replacement by the larger Fe
3+
and Eu
3+
ions distorts
the host lattice around doping atoms. For iron-doped anatase, the
metal–oxygen distances increase, while the metal–metal distances
slightly shorten or remain unchanged, with respect to the undoped
anatase structure. Europium doping locally dilates the TiO
2
lat-
tice, by lengthening both metal–oxygen andmetal–metal distances.
Additionally, the symmetry around Eu
3+
changes from anatase
towards rutile structure; this behaviour could be a specific effect
of the rare-earth doping.
57
Fe M
¨
ossbauer spectroscopy reveals the
presence of isotropic electronic relaxation effects as a result of
spin–spin interaction between the electronic spins of neighbour-
ing Fe
3+
ions. Measurements on both
57
Fe and
151
Eu M
¨
ossbauer
isotopes reveal the presence of Fe
3+
and Eu
3+
in the TiO
2
host lat-
tice.
The photocatalytic activity of all hydrothermal samples in the
degradation reaction of phenol is much higher in the visible light
than in UV region. An important UV → visible absorption shift
(∼20 nm) has been evidenced for the sample TF. However, the best
photocatalytic activity in the photodegradation reaction of phe-
nol was evidenced for the hydrothermal sample TFE, in both UV
and visible light regions. The remarkable conversion degree of phe-
nol recommends the codoped specimen TFE, obtained by a simple
hydrothermal route at moderate temperature, as a promise visible
photocatalyst for the degradation of harmful organic compounds in
water. We hope that these results will stimulate further theoretical
and experimental works for a better understanding of mechanisms
and doping effects in photocatalytically active materials.
Acknowledgements
This work was supported by the Romanian Ministry of Educa-
tion and Research through Contract CEEX-Matnantech no. 23/2005.
We gratefully acknowledge the valuable assistance of Dr. Edmund
Welter and Dr. Dariusz Zajac (HASYLAB) during the EXAFS exper-
iments, as well as the whole scientific support of Prof. Eberhardt
Burkel and Dr. Radu Nicula (University of Rostock).
References
[1] M.V. Rao, K. Rajeshwar, V.R. Pal Verneker, J. DuBow, J. Phys. Chem. 84 (1980)
1987.
[2] L. Palmisano, M. Schiavello, A. Sclafani, C. Martin, I. Martin, V. Rives, Catal. Lett.
24 (1994) 303.
[3] A. Sclafani, L. Palmisano, M. Schiavello, J. Phys. Chem. 94 (1990) 829.
[4] J. Arana, O.G. Diaz, M.M. Saracho, J.M.D. Rodriguez, J.A.H. Melian, J.P. Pena, Appl.
Catal. B: Environ. 32 (2001) 49.
[5] J. Bandara, J.A. Mielczarski, A. Lopez, J. Kiwi, Appl. Catal. B: Environ. 34 (2001)
321.
[6] A. Di Paola, E. Garcia-L
´
opez, S. Ikeda, G. Marc, B. Ohtani, L. Palmisano, Catal.
Today 75 (2002) 87.
[7] P. Fernandez, J. Blanco, C. Sichel, S. Malato, Catal. Today 101 (2005) 345.
[8] W. Choi, Catal. Surv. Asia 10 (2006) 16.
[9] K. Qiu, C. Zhang, J. Li, Q. Li, J. Zhao, Mater. Sci. Forum 544–545 (2007) 111.
[10] S. Sakthivel, M.C. Hidalgo, D.W. Bahnemann, S.U. Geissen, V. Murugesan, A.
Vogelpohl, Appl. Catal. B: Environ. 63 (2006) 31.
[11] W.J. Zhang, Y. Li, S.L. Zhu, W.H. Wang, Chem. Phys. Lett. 373 (2003) 333.
[12] R.S. Sonawane, B.B. Kale, M.K. Dongare, Mater. Chem. Phys. 85 (2004) 52.
[13] H. Wang, J.P. Lewis, J. Phys. Condens. Mater. 18 (2006) 421.
[14] M. Kitano, M. Matsuoka, M. Ueshima, M. Anpo, Appl. Catal. A: Gen. 325 (2007)
1.
[15] P.X. Wu, J.W. Tang, Z. Dang, Mater. Chem. Phys. 103 (2007) 264.
[16] P. Yang, C. Lu, N. Hua, Y. Du, Mat. Lett. 57 (2002) 794.
[17] Y.V. Kolen’ko, B.R. Churagulov, M. Kunst, L. Mazerolles, C. Colbeau-Justin, Appl.
Catal. B: Environ. 54 (2004) 51.
[18] X.F. Yang, H. Konishi, H.F. Xu, M.M. Wu, Eur. J. Inorg. Chem. 11 (2006)
2229.
[19] L. Diamandescu, M. Feder, D. Tarabasanu-Mihaila, F. Vasiliu, Appl. Catal. A: Gen.
325 (2007) 270.
[20] W.G. Zhang, L.L. Zhang, Z.J. Jiang,R.Q. Li, X.J. Yang, X. Wang, L.D. Lu,Mater. Chem.
Phys. 105 (2007) 414.
[21] J. Yu, G. Wang, B. Cheng, M. Zhou, Appl. Catal. B: Environ. 69 (2007) 171.
[22] N.N. Greenwood, T.C. Gibb, M
˝
ossbauer Spectroscopy, Champman and Hall Ltd.,
1971.
L. Diamandescu et al. / Materials Chemistry and Physics 112 (2008) 146–153 153
[23] D. Barb, L. Diamandescu, D. Tarabasanu, J. Phys. C6 (1976) 113.
[24] R.D. Shannon, Acta Crystallogr. 32 (1976) 751.
[25] S. Zhu, T. Shi, W. Liu, S. Wei, Y. Xie, C. Fan, Y. Li, Phys. B 396 (2007) 177.
[26] W. Li, A.I. Frenkel, J.C. Woicik, C. Ni, S. Ismat Shah, Phys. Rev. B 72 (2005)
155315–155321.
[27] Y. Miyake, H. Tada, J. Chem. Eng. Jpn. 37 (2004) 630.
[28] J. Tauc, R. Grigorovici, A. Vancu, Phys. Status Solidi 15 (1966) 627.
[29] S.I. Zabinsky, J.J. Rehr, A. Ankudinov, R.C. Albers, M.J. Eller, Phys. Rev. B 52 (1995)
2995.
[30] A. Sobczynski, Ł. Duczmal, W. Zmudzinski, J. Mol. Catal. A: Chem. 213 (2004)
225.