- Trang chủ >>
- Khoa Học Tự Nhiên >>
- Vật lý
ultra-sharp a-fe2o3 nanoflakes growth mechanism and field-emission
Bạn đang xem bản rút gọn của tài liệu. Xem và tải ngay bản đầy đủ của tài liệu tại đây (376.88 KB, 5 trang )
DOI: 10.1007/s00339-007-4180-9
Appl. Phys. A 89, 115–119 (2007)
Rapid communication
Materials Science & Processing
Applied Physics A
zhe zheng
1
yunzhong chen
2
zexiang shen
1
jan ma
2
chorng-haur sow
3,4
wei huang
5
ting yu
1,✉
Ultra-sharp α-Fe
2
O
3
nanoflakes:
growth mechanism and field-emission
1
Division of Physics and Applied Physics, School of Physical and Mathematical Sciences,
Nanyang Technological University, 1 Nanyang Walk, Block 5, 637616 Singapore
2
School of Materials Science and Engineering, Nanyang Technological University, 1 Blk N4.1,
50 Nanyang Avenue, 639798 Singapore
3
Department of Physics, National University of Singapore, 2 Science Drive 3, 117542 Singapore
4
National University of Singapore Nanoscience and Nanotechnology Initiative, Blk S13,
Science Drive 3, 117542 Singapore
5
Institute of Advanced Materials (IAM), Fudan University, 220 Handan Road, Shanghai 200433,
P.R. China
Received: 28 March 2007/Accepted: 14 June 2007
Published online: 26 June 2007 • © Springer-Verlag 2007
ABSTRACT We report the synthesis of single-crystalline α-Fe
2
O
3
nanoflakes from
a simple Fe–air reaction within the temperatures range of 260–400
◦
C. The nanoflakes
synthesized at the lowest temperature (260
◦
C) in this work show an ultra-sharp
morphology: 5–10 nm in thickness, 1–2 µm in length, 20 nm in base-width and
around 5 nm at the tips; successfully demonstrate the promising electron field emis-
sion properties of a large-scaled α-Fe
2
O
3
nanostructure film and exhibit the potential
applications as future field-emission (FE) electron sources and displays (FEDs). The
formation and growth of α-Fe
2
O
3
nanostructures were discussed based on the surface
diffusion mechanism.
PACS 79.60.Jv; 79.70.+q; 77.84.Bw
1 Introduction
One-dimensional (1D) and
quasi-one-dimensional nanostructures
exhibit promising properties and poten-
tial applications in magneto-electronic
devices [1], room temperature UV-
lasing devices [2] and high-density in-
formation storage devices [3]. Many
methods have been developed for the
fabrication of 1D nanostructure arrays,
including template methods [4] and
catalytic growth [5]. Since the sharp tips
of 1D nanostructures can effectively en-
hance local electric fields, using them as
field emission cathodes is a promising
way to obtain high brightness electron
sources and to fabricate field emission
displays (FEDs) [6]. With the properties
like low turn on field, high current dens-
ity and high enhancement factor, metal
oxide nanostructures play an important
role in the family of candidates for field
emission [7, 8]. There is on-going inter-
est to find innovative ways to fabricate
✉ Fax: +65 67941325, E-mail:
metal-oxide-based 1D nanostructure at
low cost and in a simple manner.
Iron oxide is one of the most im-
portant magnetic materials and shows
numerous potential applications, such
as the active component of gas sen-
sors [9], photocatalyst [10] and enzyme
immunoassay [11, 12]. As the most sta-
ble phase among the iron oxides under
ambient condition,
α-Fe
2
O
3
(hematite),
a semiconductor (
E
g
=2.1eV) material
has attracted great attentions [13]. The
previous works have lowered the growth
temperatures of 1D
α-Fe
2
O
3
nanostruc-
tures ranged from 800 to
400
◦
C [13, 14]
but some methods are still rather com-
plicated. For example, Fu et al. [15]
synthesized hematite nanowire arrays
by heating Fe foil in a special oxi-
dization atmosphere: a gas mixture of
CO
2
(19.30%, in volume), SO
2
(0.14%),
NO
2
(80.56%)andsomeH
2
O vapor. To
successfully synthesize nanowires, the
pressure andthe flow rateof the gasmix-
ture were precisely controlled.
More recently, we developed a sim-
ple and efficient method to fabricate
metal oxide nanostructures by heating
the metal foil or films on a hotplate
in air [7, 8, 16]. Using this method, we
successfully synthesized the
α-Fe
2
O
3
nanoflakes on a wide range of sub-
stratesat
300
◦
C inair [8]. Such α-Fe
2
O
3
nanoflakes grown on sharp W tips [8]
and atomic force microscope (AFM)
tips [17] exhibit promising electron field
emission properties. Unfortunately, we
failed to observe an effective field in-
duced electron emission for a large scale
film sample which has more potential
applications. In this work, we expand
the heating temperatures into the range
of
260–400
◦
C. The results demon-
strate that the temperature parameters
strongly affect the growth processes and
the final morphologies of the
α-Fe
2
O
3
nanoflakes. More importantly, the ultra-
sharp nanoflakes synthesized at
260
◦
C,
to date, the lowest growth temperature
of such heat-oxide methods, exhibits
promising electron field emission prop-
erties in a large scale. The growth mech-
anism of the
α-Fe
2
O
3
nanoflakes was
also discussed in this report.
2 Experimental
Experimentally, fresh iron
foils (
10×10 ×0.25 mm) with a purity
of
99.9% (Aldrich) were used as both
reagents and substrates for the growth
of
α-Fe
2
O
3
nanoflakes. The cleaned Fe
foil was heated on a hotplate under
ambient conditions. The growth tem-
peratures were varied from
260
◦
C to
400
◦
C and the growth duration was
fixed as
10 h. After being cooled down
116 Applied Physics A – Materials Science & Processing
to room temperature naturally, the mor-
phologies of the as-prepared products
were examined byscanning electron mi-
croscopy (SEM) (JEOL JSM-6700F)
for the topographical morphologies;
the compositions of the top surface
were characterized by X-ray diffraction
(XRD) (Bruker D8 with
Cu K
α
irradi-
ation) and micro-Raman spectroscopy
(Witech CRM200,
λ
laser
= 532 nm).
The transmission electron microscopic
(TEM) (JEOL JEM 2010F,
200 kV) ob-
servation shows the crystal structure
of the ultra-sharp nanoflake products.
Field-emission measurement was car-
ried out in a vacuum chamber with
a pressure of
5.8 ×10
−7
Torr at room
temperature under a two-parallel-plate
configuration. Details of the measure-
ment system and procedure were re-
ported previously [18].
3 Results and discussion
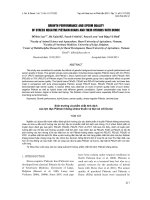
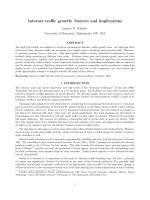
Figure 1 shows the SEM im-
ages of the as-prepared samples
obtained by heating iron foils on
a hotplate with different temperatures
(
260–400
◦
C) and fixed duration (10 h).
Clearly, the flakes become broader with
increasing the reaction temperatures,
indicating the obvious heating tempera-
ture’s effect on the morphologies of the
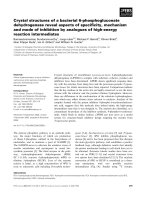
nanostructures. To further quantify this
effect, the sharpness of the nanoflakes
with different growth temperatures were
investigated based on the high magni-
fication SEM images. The sharpness
of the nanoflake was measured by two
ways in this work: one is the radius of
curvature at the nanoflake tip and the
other is the aspect ratio of
L/FWHL (L
is the length of nanoflake and FWHL
is the full width of the half length).
As shown in Fig. 2, the lower heating
temperatures dramatically increase the
sharpness of flakes as indicated by the
higher aspect ratio and smaller radius. In
general, the random aligned nanoflakes
synthesized at the lowest temperature,
260
◦
C are about 5–10 nm in thickness,
20 nm at the bases, 5nmat the tips and
1–2 µm in length. Comparing with the
flakes formed (
300
◦
C, 24 h) in our pre-
vious work [8], the nanoflakes synthe-
sized in this work show an ultra-sharp
needle-like shape and a lower density
which may effectively enhance the field
induced electron emission from such
nanoflake film.
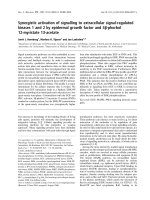
Figure 3a shows the XRD pattern
of the as-prepared sample. Two phases
of iron oxide,
α-Fe
2
O
3
and Fe
3
O
4
were
formed by heating Fe foil in air at
260
◦
C. The peaks corresponding to the
rhombohedral
α-Fe
2
O
3
with lattice con-
FIGURE 1 SEM images of the top surfaces of Fe foils heated for 10 h at (a) 260
◦
C, (b) 300
◦
C,
(c) 350
◦
Cand(d) 400
◦
C
FIGURE 2 (a1–a4)Highmag-
nification SEM images of the
nanoflakes synthesized at 260,
300, 350, and 400
◦
C, respec-
tively. (b) Aspect ratio (solid
squires) defined as length over
full width at half length and radii
(solid circles) of tangent circles
of the tips as a function of heat-
ing temperatures
stants a = 5.035 Å and c = 13.749 Å
is able to be readily conformed from
XRD pattern [19]. It was also noted that,
comparing with the standard powder
diffraction pattern of bulk
α-Fe
2
O
3
, our
XRD pattern of the
α-Fe
2
O
3
nanoflakes
ZHENG et al. Ultra-sharp α-Fe
2
O
3
nanoflakes: growth mechanism and field-emission 117
exhibits a much higher ratio of the inten-
sity of the (110) planes’ diffraction peak
to the intensity of the (104) planes’ (2.5,
nanoflakes vs 0.76, powder [19]). This
may indicate a favorable growth plane
exists, as evidenced by our TEM results
discussed below. The Raman spectrum
of the top surface of the as-prepared
sample is shown in Fig. 3b. Seven peaks
present in the range of
150–800 cm
−1
.
The peaks locating at 225, 245, 291,
408 and
499 cm
−1
correspond to the
α-Fe
2
O
3
phase [20], namely two A
1g
modes (225 and 499 cm
−1
)andthreeE
g
modes (245, 291 and 408 cm
−1
). Those
FIGURE 3 (a) XRD pattern
and (b) Raman spectrum of the
as-prepared sample shown in
Fig. 1a
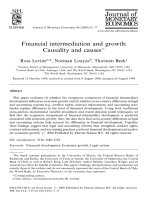
FIGURE 4 (a) TEM image
of the α-Fe
2
O
3
nanoflakes, (b)
HRTEM image of the nano-
flakes and (c) the electron diffra-
ction pattern (circled region)of
nanoflakes showing the good
agreement with the diffraction
pattern of α-Fe
2
O
3
from the
zone axis of [441]
peaks locating at 552 and 671 cm
−1
correspond to the Fe
3
O
4
[21], namely
T
2g
mode (552 cm
−1
)andA
1g
mode
(
671 cm
−1
).
The TEM was employed to further
confirm the composition and the crystal
structure of the ultra-sharp nanoflakes.
Figure 4a shows the typical TEM image
of
α-Fe
2
O
3
nanoflake. As can be seen
in the high resolution TEM (HRTEM)
image (Fig. 4b) of the region high-
lighted by a circle in Fig. 4a, the fringe
spacing of
0.252 nm concurs well with
the interplanar spacing of the plane
(110) [19]. The selected area electron
diffraction (SAED) pattern of the flake
isshowninFig.4c.Thegrowthdi-
rection of the nanoflakes was [110],
which is consistent with our previous
study [17].
Considering the growth tempera-
tures (
260–400
◦
C)aremuchlowerthan
the melting points of Fe and
α-Fe
2
O
3
(1535 and 1350
◦
C, respectively) [15],
the growth of
α-Fe
2
O
3
nanoflakes is
inexplicable by the vapor phase mech-
anism such as the vapor–liquid–solid
(VLS) and vapor–solid (VS) proces-
ses [13]. In our work, we attributed the
growth mechanism to the surface dif-
fusion of iron atoms and iron oxide
molecules. A schematic view of the for-
mation of
α-Fe
2
O
3
nanoflakes is shown
in Fig. 5. Initially, the top layer of Fe foil
was oxidized by the oxygen molecules
in air and formed a very thin layer of
mixture of
α-Fe
2
O
3
and Fe
3
O
4
. With
continuous heating, the
Fe
3
O
4
at the
very top layer was further oxidized to
α-Fe
2
O
3
and another layer of Fe
3
O
4
be-
low the thin top layer of
α-Fe
2
O
3
was
formed by the reaction between oxy-
gen diffusing through the thin top layer
and the Fe substrate. During the forma-
tion and growth of the
α-Fe
2
O
3
layer,
substantial stresses were expected to
accumulate. Once a critical limit was
reached, the stresses were relaxed by
slipping in
α-Fe
2
O
3
crystals and the
screw dislocations might be produced.
When the dislocations were generated
along an appropriate crystal direction,
Fe atoms and iron oxide molecules ad-
sorbed on the surface began to migrate
toward and stack in the corresponding
plane to maintain a flake shape [22].
Considering the crystal structure of
α-Fe
2
O
3
, we find that the preferen-
tial migration direction, especially at
the lower heating temperatures (for ex-
ample
260
◦
C), may be [110] and the
growth plane may be (110) where the
oxygen is rich and Fe is deficient [13].
Driven by the O-rich and Fe-deficient, at
low temperatures (
260–300
◦
C), the dif-
fusion of Fe atoms and oxide molecules
along the [110] direction is more facile
so that the growth is mainly along
the [110] direction named as the axis
growth [22], which resulted in the large
aspect ratio (
> 40) as shown in Fig. 2b.
At higher temperatures (
350–400
◦
C),
the diffusion in other crystal directions
may be enhanced and the radial growth
occurred. This resulted in the broaden-
118 Applied Physics A – Materials Science & Processing
ing of nanoflakes and small aspect ratio
(
≤10).
Considering their ultra-sharpmorph-
ology, we studied the field-emission
properties of the
α-Fe
2
O
3
nanoflakes
film synthesized at
260
◦
C for 10 h.Fig-
ure 6 shows the typical current density–
electric field (
J–E) curve. The exponen-
tial dependence between the emission
current and the applied field, plotted
in
ln(J/E
2
) ∼ 1/E relationship inset of
Fig. 6, indicates that the field emission
from
α-Fe
2
O
3
ultra-sharp nanoflakes
films follows the Fowler–Nordheim
(FN) relationship [23]. The dots are ex-
perimental data and the solid line is the
fitting curve according to the simplified
Fowler–Nordheim equation:
J =
A(βE)
2
ϕ
exp
−
Bϕ
3
2
βE
, (1)
where
J is the current density, E is the
applied field strength,
ϕ is the work
function, for electron emission which is
estimated to be
5.4eV[24] for α-Fe
2
O
3
,
A and B are constants with the value of
1.54 ×10
−6
(AV
−2
eV) and 6.83×10
7
(Vcm
−1
eV
−3/2
) [17], respectively.
FIGURE 5 A schematic diagram of the formation and growth of α-Fe
2
O
3
nanoflakes
FIGURE 6 Typical field-emis-
sion current–voltage (I–V)cur-
ves of the α-Fe
2
O
3
nanoflakes
films synthesized at 260
◦
Cfor
10 h. Inset shows the F–N plots
(ln(J/E
2
) versus 1/E) accord-
ingly, which exhibits a good lin-
ear dependence (solid line is the
fitting result)
Here, β is the field enhancement factor,
which is defined by:
E
local
=βE =β
V
d
, (2)
where
E
local
is the local electric field
nearby the emitter tip,
d is the aver-
age spacing between the electrodes (
d
= 100 µm in this work) and V is the
applied voltage. For the
α-Fe
2
O
3
ultra-
sharp nanoflakes with the lowest growth
temperature (
260
◦
C), β was obtained
to be 1131 from the linear fitting of
the
F–N curve and the turn-on field
was measured to be about
7.2V/µm
(Fig. 6). Compared to the AlN nanonee-
dles (
β = 950) [25], NiSi
2
nanorods
(
β =630) [26], TiSi
2
nanowires (β =
501
) [27] and the α-Fe
2
O
3
nanowires
(
β =560 and 1500) [28], such an en-
hancement factor is acceptable for ap-
plication, although much lower than
that of carbon nanotubes [29]. One of
the reasons for this low enhancement
factor could be the random alignment
of the nanoflakes (Fig. 1a). We can
also see that at high electric fields the
linear relationship between
ln(J/E
2
)
and 1/E suggests that the quantum
tunneling mechanism is responsible
for the emission from the ultra-sharp
nanoflakes [30]. In our previous
works [8, 17], the electron field emis-
sion was only effectively observed from
the
α-Fe
2
O
3
nanoflakes grown on AFM
tips or
W tips but not from the film.
In this work, the ultra-sharp
α-Fe
2
O
3
nanoflakes film with a large scale ex-
hibits promising FE properties. This im-
provement may be because of the ultra-
sharp morphology and a lower density
which are able to effectively weaken
the screening effect, increase the field
enhancement factor [18, 31] (shown in
Fig. 1) and consequently enhance the
FE efficiency.
4Conclusion
In conclusion, single crys-
talline
α-Fe
2
O
3
nanoflakes have been
synthesized from a rather simple Fe–
air reaction at temperatures ranged from
260
◦
C to 400
◦
C. A surface diffusion
mechanism is proposed to account for
the growth of
α-Fe
2
O
3
nanoflakes. The
electron field emission investigations
show the ultra-sharp
α-Fe
2
O
3
nanofla-
kes films fabricated at a low temperature
of
260
◦
C exhibit promising field emis-
sion properties. With further improve-
ments like growth of well aligned ultra-
sharp flakes, it is believed that
α-Fe
2
O
3
nanoflakes could be one of the promis-
ing candidates as future field emission
electron sources and displays (FEDs).
REFERENCES
1 H. Ohno, Science 281, 951 (1998)
2 M. Huang, S. Mao, H. Yan, Y. Wu, H. Kind,
E. Weber, R. Russo, P.D. Yang, Science 292,
1897 (2001)
3 W.S. Yun, J.J. Urban, Q. Gu, H. Park, Nano
Lett. 2, 447 (2002)
4 R.Fan,Y.Y.Wu,D.Y.Li,M.Yue,A.Majum-
dar, P.D. Yang, J. Am. Chem. Soc. 125, 5254
(2003)
5 X.D. Wang, C.J. Summers, Z.L. Wang, Nano
Lett. 4, 423 (2004)
6 Y. Saito, S. Uemura, Carbon 38, 169 (2000)
7 T. Yu, Y.W. Zhu, X.J. Xu, Z.X. Shen, P. Chen,
C.T. Lim, J.T.L. Thong, C.H. Sow, Adv.
Mater. 17, 1595 (2005)
8 T. Yu, Y.W. Zhu, X.J. Xu, K.S. Yeong,
Z.X. Shen, P. Chen, C.T. Lim, J.T.L. Thong,
C.H. Sow, Small 2, 80 (2006)
9 J.S. Han, T. Bredow, D.E. Davey, A.B. Yu,
D.E. Mulcahy, Sens. Actuators B 75,18
(2001)
10 S.N. Frank, A.J. Bard, J. Phys. Chem. 81,
1484 (1977)
11 J.Ugelstad,A.Berge,T.Ellingsen,R.Schmid,
T.N.Nilsen,P.C.Mørk,P.Stenstad,E.Hornse,
Ø. Olsvik, Prog. Polym. Sci. 17, 87 (1992)
ZHENG et al. Ultra-sharp α-Fe
2
O
3
nanoflakes: growth mechanism and field-emission 119
12 X.Y. Liu, X.B. Ding, Z.H. Zheng, Y.X. Peng,
A.S.C. Chan, C.W. Yip, X.P. Long, Polym.
Int. 52, 235 (2003)
13 X.G. Wen, S.H. Wang, Y. Ding, Z.L. Wang,
S.H. Yang, J. Phys. Chem. B 109, 215
(2005)
14 Y.M. Zhao, Y.H. Li, R.Z. Ma, M.J. Roe,
D.G. McCartney, Y.Q. Zhu, Small 2, 422
(2006)
15 Y.Y. Fu, R.M. Wang, J. Xu, J. Chen, Y. Yan,
A.V. Narlikar, H. Zhang, Chem. Phys. Lett.
379, 373 (2003)
16 T. Yu, X. Zhao, Z.X. Shen, Y.H. Wu, W.H. Su,
J. Cryst. Growth 268, 590 (2004)
17 Y.W. Zhu, T. Yu, A.T.S. Wee, X.J. Xu,
C.T. Lim, J.T.L. Thong, C.H. Sow, Appl.
Phys. Lett. 87, 023 103 (2005)
18 Y.W. Zhu, T. Yu, F.C. Cheong, X.J. Xu,
C.T. Lim, V.B.C. Tan, J.T.L. Thong,
C.H. Sow, Nanotechnology 16,88
(2005)
19 Joint Committee on Powder Diffraction Stan-
dards (JCPDS), Card No. 87 1166, hematite
(α-Fe
2
O
3
)
20 I.R. Beattie, T.R. Gilson, J. Chem. Soc. A 5,
980 (1983)
21 J.L. Verble, Phys. Rev. B 9, 5236 (1974)
22 R. Takagi, J. Phys. Soc. Japan 12, 1212
(1957)
23 R. Fowler, L.W. Nordheim, Proc. R. Soc.
London A 119, 173 (1928)
24 V.E. Hendrich, P.A. Cox, in: Surface Science
of Metal Oxides (Cambridge Univ. Press,
Cambridge, 1994)
25 Q. Zhao, J. Xu, X.Y. Xu, Z. Wang, D.P. Yang,
Appl. Phys. Lett. 85, 5331 (2005)
26 Y.W. Ok, T.Y. Seong, C.J. Choi, K.N. Tu,
Appl. Phys. Lett. 88, 043 106 (2006)
27 Q. Xiang, Q.X. Wang, Z. Wang, X.Z. Zhang,
L.Q. Liu, J. Xu, D.P. Yu, Appl. Phys. Lett. 86,
243103 (2005)
28 Y.L. Chueh, M.W. Lai, J.Q. Liang, L.J. Chou,
Z.L. Wang, Adv. Funct. Mater. 16, 2243
(2006)
29 I. Alexandrou, E. Kymakis, G.A.J. Ama-
ratunga, Appl. Phys. Lett. 80, 1435 (2002)
30 J.W. Gadzuk, E.W. Plummer, Rev. Mod.
Phys. 45, 487 (1973)
31 J. Zhou, L. Gong, S.Z. Deng, J. Chen,
J.C. She, N.S. Xu, R. Yang, Z.L. Wang, Appl.
Phys. Lett. 87, 223 108 (2005)