- Trang chủ >>
- Khoa Học Tự Nhiên >>
- Vật lý
Vertically Aligned WO3Nanowire ArraysGrown Directly on Transparent ConductingOxide Coated Glass: Synthesis andPhotoelectrochemical Properties
Bạn đang xem bản rút gọn của tài liệu. Xem và tải ngay bản đầy đủ của tài liệu tại đây (2.84 MB, 6 trang )
Vertically Aligned WO
3
Nanowire Arrays
Grown Directly on Transparent Conducting
Oxide Coated Glass: Synthesis and
Photoelectrochemical Properties
Jinzhan Su,
†,‡
Xinjian Feng,
‡
Jennifer D. Sloppy,
‡
Liejin Guo,
†
and Craig A. Grimes*
,‡,§
†
State Key Laboratory of Multiphase Flow in Power Engineering, School of Energy and Power Engineering, Xi’an
Jiaotong University, Shaanxi 710049, People’s Republic of China, and
‡
Department of Electrical Engineering, The
Materials Research Institute, The Pennsylvania State University, University Park, Pennsylvania 16802, United States
ABSTRACT Photocorrosion stable WO
3
nanowire arrays are synthesized by a solvothermal technique on fluorine-doped tin oxide
coated glass. WO
3
morphologies of hexagonal and monoclinic structure, ranging from nanowire to nanoflake arrays, are tailored by
adjusting solution composition with growth along the (001) direction. Photoelectrochemical measurements of illustrative films show
incident photon-to-current conversion efficiencies higher than 60% at 400 nm with a photocurrent of 1.43 mA/cm
2
under AM 1.5G
illumination. Our solvothermal film growth technique offers an exciting opportunity for growth of one-dimensional metal oxide
nanostructures with practical application in photoelectrochemical energy conversion.
KEYWORDS WO
3
, nanowire, tungsten trioxide, photoelectrochemical.
H
ydrogen production by water photoelectrolysis has
been of considerable interest since Fujishima and
Honda’s report of water splitting on a TiO
2
surface
under UV illumination in 1972.
1
Since then there have been
numerous reports on efforts to achieve a stable water
photoelectrolysis system using materials responsive to solar
spectrum energy.
2-4
For example, significant efforts have
focused on finding new materials with band edge alignments
suitable for driving the necessary photoelectrochemical
reactions,
3
including semiconductor doping to achieve a
lower band gap more suitable for visible light utilization and/
or superior electrical properties,
5,6
formation of hybrid
heterojunction structures,
7
multiple band gap structures
8
and p/n junctions,
9
engineering of crystalline structures
10
and modification of semiconductor surfaces by chemical
and/or physical processes.
11
It is now widely recognized that
nanostructured semiconductors, in comparison to bulk ma-
terials, offer potential advantages in photoelectrochemical
cell (PEC) application due to their large surface area and size-
dependent properties, such as increased photon absorption,
enhanced charge separation and migration, and surface
reactions.
12-15
One dimensional (1-D) semiconductor structures are
currently of great interest,
16-19
as they can offer photoge-
nerated charges direct electrical pathways, with reduced
grain boundaries, resulting in superior charge transport
properties.
20
1-D semiconductor nanoarchitectures have
been synthesized by a number of chemical and physical
techniques, including vapor-liquid-solid,
21
dielectrophore-
sis,
22
Langmuir-Blodgett (LB),
23,24
anodized aluminum ox-
ide template (AAO),
25
hydrothermal,
26
lithographically pat-
terned nanowire electrodeposition (LPNE),
27
molecular beam
epitaxy,
28
etc. WO
3
is recognized as one of the few n-type
semiconductors resistant to photocorrosion in aqueous solu-
tions, and significant incident photon-to-current conversion
efficiencies (IPCEs) for oxidation of water have been re-
ported for WO
3
films.
29
1-D-structured WO
3
may prove a
promising material with which to achieve efficient water
photoelectrolysis. 1-D WO
3
nanostructures have been syn-
thesized by chemical vapor deposition,
30
thermal vapor
deposition,
31
heating metal tungsten filaments/wires in
vacuum or Ar atmosphere,
32-35
and anodization of W foil.
36
Hydrothermal/solvothermal techniques have been used to
synthesize WO
3
nanorods, nanowires, and nanobelts;
37-39
however these structures are randomly oriented rather than
vertically aligned from the substrate. There is a recent report
on growth of WO
3
nanoflake arrays synthesized by a solvo-
thermal technique in ethanol.
40
In this work, we report a
facile way to deposit ordered nanowire, as well as nanoflake,
WO
3
arrays upon FTO coated glass. A WO
3
seed layer is used
to initiate growth, with the geometries tailored by adjusting
the hydrothermal precursor composition; by adjustment of
the amount of water and oxalic acid in the precursor,
nanowire arrays can be selectively deposited.
Film Synthesis. Before solvothermal growth, a 200 nm
thick seed layer was deposited on a FTO coated glass
substrate by spin coating a solution, made by dissolving
* To whom correspondence should be addressed,
§
Current address: Photonic Fuels, Innovation Park, State College, PA. 16803.
Received for review: 09/30/2010
Published on Web: 11/29/2010
pubs.acs.org/NanoLett
© 2011 American Chemical Society
203 DOI: 10.1021/nl1034573 | Nano Lett. 2011, 11, 203–208
1.25gofH
2
WO
4
and 0.5 g of poly(vinyl alcohol) (PVA) in 10
mL of 50 wt % H
2
O
2
, followed by 500 °C anneal for2hin
air. A H
2
WO
4
solution for solvothermal use was prepared by
dissolving 1.25 g of H
2
WO
4
into 30 mL of H
2
O by adding 10
mL of 50 wt % H
2
O
2
while heating at 95 °C on a hot plate
with stirring. The resulting clear solution was diluted using
deionized water to 100 mL with a molar concentration of
0.05 M. Nanowire array growth was achieved usinga3mL
portion of H
2
WO
4
(0.05 M) solution, with 0.5 mL of HCl (6
M) and 2.5 mL of deionized water added to 10 mL of
acetonitrile. This solution was placed within a 23 mL Teflon-
lined stainless steel autoclave, holding a vertically oriented
FTO-glass substrate (with a WO
3
seed layer), which was
then sealed and maintained at 180 °C for 6 h. The substrate
was then rinsed with deionized water and dried in a nitrogen
stream.
We note that using the same general synthesis technique
two distinct types of nanoflake array films were synthesized
by modification of the nanowire array solvothermal condi-
tions. For the first type, 3 mL of H
2
WO
4
(0.05 M) solution,
0.02 g of oxalic acid, 0.02 g of urea, and 0.5 mL of HCl (6
M) were added into 12.5 mL of acetonitrile, and the reaction
was kept at 180 °C for 2 h. For the second type, 3 mL of
H
2
WO
4
(0.25 M) solution, 0.2 g of oxalic acid, 0.5 mL of HCl
(6 M), and 2.5 mL of deionized water were added into 10
mL of acetonitrile, and the reaction was kept at 180 °C for
2 h. The resulting films, of both types, were annealed in air
at 500 °C for 1 h.
Characterization. Film morphology was investigated by
use of a field emission scanning electron microscope (FES-
EM, JEOL JSM 4700F) operated at 3 kV. Transmission
electron microscopy (TEM) images and selected area elec-
tron diffraction (SAED) patterns were obtained using a JEOL
2010 with a LaB
6
emitter operated at 200 kV. X-ray diffrac-
tion (XRD) patterns were taken using a Scintag X2 diffrac-
tometer (Cu KR radiation). UV-vis absorption spectra mea-
surements were performed using a Perkin-Elmer Lambda
950 UV-vis-NIR spectrophotometer with integrating sphere.
Linear sweep voltammetry was obtained at a scan rate of
50 mV/s using a potentiostat (CH Instruments, model CHI
600C). A Spectra Physics simulator with an illumination
intensity of 1 sun (AM 1.5, 100 mW/cm
2
) with a filter to
remove light of wavelength below 400 nm was used as the
light source; a PHIR CE power meter was used to calibrate
input power. IPCE values were determined using a system
comprising a monochromator (Cornerstone 130), a 300 W
xenon arc lamp, a calibrated silicon photodetector, and a
power meter. Intensity modulated photocurrent spectrum
(IMPS) data were obtained using a custom built system: a
UV emitting diode (NICHIA NCSU033A, λ ) 365 nm) was
used as a light source whose dc illumination was adjusted
to 2.53 mW/cm
2
. Light intensity modulation was conducted
by current modulation with a depth of 5%. A lock-in ampli-
fier (Stanford Research Systems SR 830) was used to record
the photocurrent response as a function of frequency.
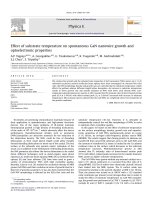
Results and Discussion. Figure 1 presents FESEM images
of an illustrative as-prepared WO
3
nanowire array film, and
the two types of nanoflake arrays; there was no discernible
change in film morphology after annealing. Both the nano-
wire and nanoflake films grow perpendicular to the sub-
strate. Nanowire length varies from 500 to 1500 nm,
tapering in width from base (100 nm) to tip (30 nm). The
thickness of the first type of nanoflake, NF1, is 20-30 nm,
with a height of 1-2 µm. The second type of flake, NF2, has
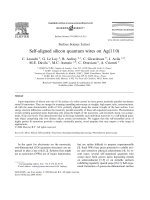
a20-30 nm thickness and height of 5-6 µm. Figure 2 is a
digital photograph of the different as-prepared and annealed
films.
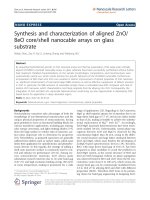
Figure 3 shows the XRD patterns of the three film
morphologies as-synthesized, and after a 500 °C 1 h anneal
in air. The unannealed and annealed wires both exhibit
hexagonal structure with, respectively, an oriented plane of
FIGURE 1. FESEM images of unannealed WO
3
: (a) nanowire, (b) NF1,
and (c) NF2 arrays. Insets show film cross section.
© 2011 American Chemical Society
204
DOI: 10.1021/nl1034573 | Nano Lett. 2011, 11, 203-–208
(002) (PDF 97-008-0634; a ) 7.324 Å, c ) 7.663 Å) and (001)
(PDF 00-033-1387; a ) 7.298 Å, c ) 3.899 Å). Different from
the wires. The unannealed and annealed nanoflake arrays
of the first-type were monoclinic (PDF 97-001-7003; a ) 7.3
Å, b ) 7.53 Å, c ) 7.68 Å, β ) 90.9°). For nanoflake arrays
of the second type, the unannealed and annealed samples
show, respectively, monoclinic structure referred to (PDF 00-
005-0393) and (PDF 97-001-7003). Peak broadening is
pronounced for all samples. No hydrated tungsten oxide was
found, presumably due to our use of the aprotic solvent
acetonitrile.
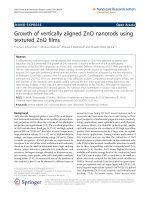
Figure 4 presents the TEM images and SAED patterns of
annealed nanowire and nanoflakes. The clear SAED patterns
reveal that the nanowire and nanoflakes are crystalline. The
growth direction of hexagonal nanowires was indexed along
[001], which gave the strongest peak intensity in the XRD
pattern. The monoclinic nanoflakes were found to grow
along [020] and [200] (zone axis ) [002]). The peak intensity
of [002] for NF2 films was significantly enhanced after
annealing, a behavior attributed to recrystallization of the
interface between adjacent flakes; see Figure 1c.
Figure 5 shows the UV-vis absorption spectra of the
three sample types, annealed and unannealed. The band
gap, E
G
, was determined using the equation
41
where h is Planck’s constant, ν is the frequency of light, A is
a constant, and n is equal to 2 for an allowed indirect
transition or 1/2 for an allowed direct transition. For WO
3
FIGURE 2. Digital photograph of WO
3
films as-prepared and after
anneal.
FIGURE 3. XRD patterns of unannealed and 500 °C 1 h air-annealed
samples.
FIGURE 4. TEM images of 500 °C 1 h annealed samples of (a)
nanowire, (b) NF1, and (c) NF2. Inset is the selected area electron
diffraction (SAED) pattern for each sample.
αhν ) A(hν - E
G
)
n
© 2011 American Chemical Society
205
DOI: 10.1021/nl1034573 | Nano Lett. 2011, 11, 203-–208
the transition is indirect, and therefore (Rhν)
1/2
is plotted as
a function of hν from which the band gap energy is obtained.
We find a band gap value for the unannealed nanowire
samples of 3.14 eV, and 2.92 eV when annealed. For NF1
films we find a band gap value of 2.82 eV for unannealed
and 2.61 eV for annealed. For NF2 films we find 2.54 eV for
the unannealed samples and 2.51 eV when annealed. de
Wijs and de Groot reported that for WO
3
a larger band gap
is obtained with inferior crystallization,
42
hence the 0.2 eV
band gap decrease with annealing for the nanowire and NF1
samples. Further, the electronic band gap increases with
distortion of the octahedra that are building blocks of the
various crystal structures;
43
hence the monoclinic WO
3
nanoflakes give a lower band gap than the hexagonal WO
3
nanowires.
The hydrothermal precursor composition plays a domi-
nant role in controlling growth of the tungsten trioxide
nanostructures. Nanowire or nanoflake arrays are selectively
deposited by adjusting the amount of water added to the
precursor. The total amount of water in the precursor
included both the water added plus the 3.43 g of water in
the3mLH
2
WO
4
and 0.5 mL HCl (6 M) solutions. When the
amount of water added to the precursor was varied, the
amount of acetonitrile was adjusted to keep precursor
volume at 16 mL. When more than 1 mL of H
2
O was added
to the precursor solution, nanowire array films were grown.
When no water was added to the precursor NF1 films were
grown.
Acidic conditions were necessary to grow the nanostruc-
tured WO
3
films. In the growth of NF1 films, adding 0.1 g of
NaCl instead of 0.5 mL of HCl (6 M) to the solution resulted
in growth of a compact WO
3
layer. To confirm that it is not
Na
+
that prevents growth of the nanostructured film, rather
the acidic conditions, we added 0.05 g of NaCl and 0.144
mL of HCl (6 M) (keeping Cl
-
concentration constant) to the
precursor and obtained nanoflake films.
Nanostructured growth was achieved only within a nar-
row temperature window. For NF1 films, reducing the
temperature to 120 °C resulted in a sparse sea urchin-like
growth upon the seed layer. When the temperature was
elevated to 160 °C, a particle film was grown. At 170 and
180 °C nanoflake array films were grown. Elevation of the
temperature to 200 °C and above resulted in a dense mat
of flakes seemingly comprised of particles.
From the baseline nanowire growing conditions, nano-
wire arrays of the same morphology were grown with 0,
0.02, or 0.04 g of oxalic acid added. When the oxalic acid
content was increased to 0.1 g, a mixture of nanowires as
well as nanoflakes were grown. With 0.2 g of oxalic acid
added to the solution, NF2 films were grown. The nanowire
structure disappeared when the amount of urea was higher
than 0.02 g. For the same growth condition as the NF1 films,
when no oxalic acid was added to the precursor solution,
the result was a compact layer, and when no urea was
added, the result was a film comprised of particles mixed
with sea urchin-like wires. Little variation in NF1 morphology
was found when the amount of oxalic acid was varied from
0.01 to 0.08 g (0.02 g of urea added).
XRD analyses showed that the hexagonal nanowires grow
along [001] and monoclinic nanoflakes along [020]; similar
results were reported for 1D WO
3
nanostructures.
37-39
The
nanocrystal shapes are determined by the surface energies
associated with facets of the crystal. One can control the final
shape of a crystal by introducing appropriate surfactants/
capping reagents to change the free energies of the various
crystallographic surfaces, thus altering their growth rates.
44
Sulfate ions have been employed as capping agents to grow
WO
3
nanowire/nanorods in aqueous solution by hydrother-
mal deposition.
37
In our experiments, Cl
-
appears to be the
growth-directing ion as nanowire arrays were grown only
with addition of HCl to the water and acetonitrile solution,
while oxalic acid plays a key role in formation of the
nanoflake films. A change from wire to ribbon morphology
was observed by Gu
45
with increasing K
2
SO
4
in the hydro-
thermal reaction, which was explained as oriented aggrega-
tion of the nanowires induced by high sulfate concentrations.
It was reported that with addition of oxalic acid, the hydro-
thermal products can change from irregularly aggregated
WO
3
nanorods to WO
3
nanowire bundles.
38
Figure 6
shows
nanoflakes synthesized with addition of 0.1 g of oxalic acid;
it is clearly observable that the flakes are assembled with
nanowires. Evolution of WO
3
from nanowires to nanosheets
by thermal annealing was reported by Ko,
46
who proposed
that formation and recrystallization of an amorphous inter-
face layer between two neighboring nanowires changes the
nanowires to nanosheets. Urea was found essential for
growing NF1 films. Urea can act as both a hydrogen-bond
donor through its two NH protons or a hydrogen-bond
acceptor through the CdO group
47
and was used as a
directing agent in an ethanol/WCl
6
system for the synthesis
of inorganic tungsten oxide nanotubes.
48
Without addition
of urea, more than 0.1 g of oxalic acid was needed to grow
NF2 films, while with addition of urea (0.02 g), 0.01 g of
FIGURE 5. UV-vis absorption of unannealed and 500 °C 1 h air-
annealed samples of different film types.
© 2011 American Chemical Society
206
DOI: 10.1021/nl1034573 | Nano Lett. 2011, 11, 203-–208
oxalic acid was enough to grow NF1 films. Urea together
with oxalic acid promotes the translation from nanowires
to nanosheets.
Photoelectrochemical Properties. Photocurrent mea-
surements of the nanostructured WO
3
films were conducted
ina0.1MNa
2
SO
4
solution using a two electrode setup with
aPtcounterelectrode.Figure7showschoppedcurrent-potential
(I-V) curves of the three film morphologies. NF2 films give
the highest saturation photocurrent value of 1.43 mA/cm
2
.
As an indirect band gap semiconductor, WO
3
has a relatively
low absorption coefficient. The NF1 films have a thickness
comparable to that of the nanowire array films but give
about 3 times higher photocurrent, a behavior attributable
to the lower band gap, and light scattering in the flake array
structure (see Figure 2). The unannealed samples show very
low, less than 1 µA/cm
2
, photocurrent values due to the poor
crystallization.
In order to make a quantitative correlation between
nanowires and nanoflakes, we performed incident-photon-
to-current-conversion efficiency (IPCE) measurements as a
means of studying the photoactive wavelength regime for
the nanostructured WO
3
films (Figure 8). IPCE can be
expressed as
49
where I is the photocurrent density, λ the incident light
wavelength, and J
light
is the measured irradiance. As shown
in Figure 8, the IPCEs measured for the three film types were
consistent with the I-V curves, with the NF2 films giving the
highest efficiency. Below 400 nm, the NF2 films gave IPCE
values higher than 60%. The onset wavelengths of photo-
currents were 430, 468, and 480 nm for nanowire, NF1, and
NF2 films, respectively, which track results of the UV-vis
absorption spectra.
IMPS was employed to investigate electron transport.
Figure 9 shows the complex plane plot of the IMPS response.
The electron transport time (τ
n
) can be determined from the
frequency at the imaginary maximum, given by
50
FIGURE 6. FESEM image of WO
3
flakes synthesized with addition of
0.1 g of oxalic acid, indicating that the flakes are comprised of
nanowires.
FIGURE 7. Current-potential plots for annealed nanowire, and two
flake samples, under chopped visible light in an aqueous solution
of 0.1 mol/L sodium sulfate (Na
2
SO
4
).
FIGURE 8. IPCE of three samples. The photocurrents were taken
using a CHI600C potentiostat with a bias of 0.5 V in a two electrode
setup with Pt foil as counter electrode.
FIGURE 9. Complex plane plot of the IMPS response at a base light
intensity of 2.53 mW/cm
2
, incident photon flux 0.465 × 10
16
cm
2
s
-1
,
using an UV LED (λ ) 365 nm).
IPCE ) (1240I)/(λJ
light
)
© 2011 American Chemical Society
207
DOI: 10.1021/nl1034573 | Nano Lett. 2011, 11, 203-–208
The electron transport times calculated for nanowires,
NF1, and NF2 films are 2.89, 3.35, and 26.99 ms, respec-
tively. Electron transport in the small feature size films,
≈20-30 nm, is dominated by diffusion due to the lack of
band bending.
51
The nanowire and NF1 films are compa
-
rable in thickness, and gave similar electron transport times.
Comparing the electron transport in TiO
2
nanotube and
nanoparticle films,
20
in which a value of 5-7mswas
reported for a film thickness of 4.3 µm under similar incident
photon flux (4.65 × 10
15
cm
2
s
-1
), the transport time of
26.99 ms for the NF2 films, 5.6 µm thickness, is relatively
long. A longer transport time can decrease the IPCE because
of carrier recombination. However the NF2 films showed
high IPCE values indicating efficient electron transport.
Conclusions. In summary, ordered WO
3
nanowire and
nanoflake films with, respectively, hexagonal and monoclinic
structure were synthesized on FTO coated glass substrates by
solvothermal deposition with morphologies controlled through
solution composition. The amounts of water, oxalic acid, and
urea in the precursor play important roles in determining film
morphology. Structural and photoelectrochemical properties
were investigated to demonstrate their utility in photoelectroly-
sis. Annealing decreased the band gap and improved the
photocurrent significantly, with the nanoflakes showing lower
band gap values than the nanowires. The NF2 films, 5.6 µm
thick, gave the highest saturation photocurrent of 1.43 mA/cm
2
under AM 1.5G illumination.
Acknowledgment. Jinzhan Su was supported by a schol-
arship grant from the China Scholarship Council. Partial
support of this work through the Department of Energy,
GrantNumberDE-FG36-08GO18074,isgratefullyacknowledged.
REFERENCES AND NOTES
(1) Fujishima, A.; Honda, K. Nature 1972, 238, 37–38.
(2) Khaselev, O.; Turner, J. A. Science 1998, 280, 425–427.
(3) Bak, T.; Nowotny, J.; Rekas, M.; Sorrell, C. C. Int. J. Hydrogen
Energy 2002, 27, 991–1022.
(4) Mor, G. K.; Shankar, K.; Paulose, M.; Varghese, O. K.; Grimes,
C. A. Nano Lett. 2005, 5, 191–195.
(5) Grimes, C. A.; Varghese, O. K.; Ranjan, S. Light, Water, Hydrogen:
The Solar Generation of Hydrogen by Water Photoelectrolysis;
Springer: Norwell, MA, 2007 (ISBN 978-0-387-28597-933198-0).
(6) Cesar, I.; Kay, A.; Gonzalez Martinez, J. A.; Gra¨tzel, M. J. Am. Chem.
Soc. 2006, 128, 4582–4583.
(7) Siripala, W.; Ivanovskaya, A.; Jaramillo, T. F.; Baeck, S.; McFar-
land, E. W. Sol. Energy Mater. Sol. Cells 2003, 77, 229–237.
(8) Licht, S. J. Phys. Chem. B 2001, 105, 6281–6294.
(9) Ingler, W. B., Jr.; Khan, S. U. M. Electrochem. Solid-State Lett. 2006,
9, G144–G146.
(10) Tokunaga, S.; Kato, H.; Kudo, A. Chem. Mater. 2001, 13, 4624–
4628.
(11) Licht, S.; Wang, B.; Mukerji, S. J. Phys. Chem. B 2000, 104, 8920–
8924.
(12) Serrano, E.; Rus, G.; Garcı´a-Martı´nez, J. Renewable Sustainable
Energy Rev. 2009, 13, 2373–2384.
(13) Zhu, J.; Za¨ch, M. Curr. Opin. Colloid Interface Sci. 2009, 14, 260–
269.
(14) Li, Y.; Zhang, J. Z. Laser Photonics Rev. 2010, 4, 517–528.
(15) van de Krol, R.; Liang, Y.; Schoonman, J. J. Mater. Chem. 2008,
18, 2311–2320.
(16) Mor, G. K.; Varghese, O. K.; Paulose, M.; Shankar, K.; Grimes,
C. A. Sol. Energy Mater. Sol. Cells 2006, 90, 2011–2075.
(17) Gudiksen, M. S.; Lauhon, L. J.; Wang, J.; Smith, D. C.; Lieber, C. M.
Nature 2002, 415, 617–620.
(18) Su, J.; Guo, L.; Yoriya, S.; Grimes, C. A. Cryst. Growth Des. 2010,
10, 856–861.
(19) Yang, X.; Wolcott, A.; Wang, G.; Sobo, A.; Fitzmorris, R. C.; Qian,
F.; Zhang, J. Z.; Li, Y. Nano Lett. 2009, 9, 2331–2336.
(20) Zhu, K.; Neale, N. R.; Miedaner, A.; Frank, A. J. Nano Lett. 2007,
7, 69–74.
(21) Wang, D.; Qian, F.; Yang, C.; Zhong, Z.; Lieber, C. M. Nano Lett.
2004, 4, 871–874.
(22) Freer, E. M.; Grachev, O.; Duan, X.; Martin, S.; Stumbo, D. P. Nat.
Nanotechnol. 2010, 5, 525–530.
(23) Whang, D.; Jin, S.; Wu, Y.; Lieber, C. M. Nano Lett. 2003, 3, 1255–
1259.
(24) Mai, L.; Gu, Y.; Han, C.; Hu, B.; Chen, W.; Zhang, P.; Xu, L.; Guo,
W.; Dai, Y. Nano Lett. 2009, 9, 826–830.
(25) Shankar, K. S.; Raychaudhuri, A. K. Nanotechnology 2004, 15,
1312–1316.
(26) Feng, X.; Shankar, K.; Varghese, O. K.; Paulose, M.; Latempa, T. J.;
Grimes, C. A. Nano Lett. 2008, 8, 3781–3786.
(27) Yang, Y.; Kung, S. C.; Taggart, D. K.; Xiang, C.; Yang, F.; Brown,
M. A.; Guell, A. G.; Kruse, T. J.; Hemminger, J. C.; Penner, R. M.
Nano Lett. 2008, 8, 2447–2451.
(28) Tchernycheva, M.; Cirlin, G. E.; Patriarche, G.; Travers, L.; Zwiller,
V.; Perinetti, U.; Harmand, J. C. Nano Lett. 2007, 7, 1500–1504.
(29) Santato, C.; Ulmann, M.; Augustynski, J. J. Phys. Chem. B 2001,
105, 936–940.
(30) Huang, R.; Zhu, J.; Yu, R. Chin. Phys. B 2009, 18, 3024–3030.
(31) Hong, K.; Xie, M.; Wu, H. Nanotechnology 2006, 17, 4830–4833.
(32) Chi, L.; Xu, N.; Deng, S.; Chen, J.; She, J. Nanotechnology 2006,
17, 5590–5595.
(33) Gu, G.; Zheng, B.; Han, W.; Roth, S.; Liu, J. Nano Lett. 2002, 2,
849–851.
(34) Qi, H.; Wang, B.; Liu, J. Adv. Mater. 2003, 15, 411–414.
(35) Wang, H.; Quan, X.; Zhang, Y.; Chen, S. Nanotechnology 2008,
19, 065704-9.
(36) Mukherjee, N.; Paulose, M.; Varghese, O. K.; Mor, G. K.; Grimes.,
C. A. J. Mater. Res. 2003, 18, 2296–2299.
(37) Lou, X.; Zeng, H. Inorg. Chem. 2003, 42, 6169–6171.
(38) Gu, Z.; Ma, Y.; Yang, W.; Zhang, G.; Yao, J. Chem. Commun. 2005,
41, 3597–3599.
(39) Zhao, Y.; Hu, W.; Xia, Y.; Smith, E.; Zhu, Y.; Dunnill, C.; Gregory,
D. J. Mater. Chem. 2007, 17, 4436–4440.
(40) Amano, F.; Li, D.; Ohtani, D. Chem. Commun. 2010, 46, 2769–
2771.
(41) Tauc, J.; Grigorovici, R.; Vancu, A. Phys. Status Solidi 1966, 15,
627–637.
(42) Wijs, G.; Groot, R. Phys. Rev. B 1999, 60, 16463–16474.
(43) Wijs, G.; Boer, P.; Groot, R. Phys. Rev. B 1999, 59, 2684–2693.
(44) Zou, G.; Li, H.; Zhang, Y.; Xiong, K.; Qian, Y. Nanotechnology 2006,
17, S313–S320.
(45) Gu, Z.; Zhai, T.; Gao, B.; Sheng, X.; Wang, Y.; Fu, H.; Ma, Y.; Yao,
J. J. Phys. Chem. B 2006, 110, 23829–23836.
(46) Ko, R.; Wang, S.; Tsai, W.; Lioub, B.; Lin, Y. CrystEngComm 2009,
11, 1529–1531.
(47) Custelcean, R. Chem. Commun. 2008, 21, 295–307.
(48) Zhao, Z.; Miyauchi, M. Angew. Chem., Int. Ed. 2008, 47, 7051–
7055.
(49) Varghese, O. K.; Grimes, C. A. Sol. Energy Mater. Sol. Cells 2008,
92, 374–384.
(50) Kruger, J.; Plass, R.; Gratzel, M.; Cameron, P. J.; Peter, L. M. J.
Phys. Chem. B 2003, 107, 7536–7539.
(51) Hagfeld, A.; Gratzel, M. Chem. Rev. 1995, 95, 49–68.
τ
n
) (2πf
(IMPS)
)
-1
© 2011 American Chemical Society
208
DOI: 10.1021/nl1034573 | Nano Lett. 2011, 11, 203-–208