- Trang chủ >>
- Khoa Học Tự Nhiên >>
- Vật lý
xps studies of active elements surface of gas sensors based on wo3nanoparticles
Bạn đang xem bản rút gọn của tài liệu. Xem và tải ngay bản đầy đủ của tài liệu tại đây (318.76 KB, 4 trang )
Journal of Electron Spectroscopy and Related Phenomena 156–158 (2007) 172–175
XPS studies of active elements surface of gas
sensors based on WO
3−x
nanoparticles
A.P. Shpak, A.M. Korduban
∗
, M.M. Medvedskij, V.O. Kandyba
G.V. Kurdyumov Institute of Physics of Metals, National Academy of Sciences, Ukraine, Boulevard Akad. Vernadskogo 36 03142 Kyiv, Ukraine
Available online 26 January 2007
Abstract
Nanodisperse WO
3−x
oxides (x ≥ 0) were synthesized by method of electrical explosion of wires. The structure of core levels W4f and O1s
was explored by XPS-method. Exposure of oxides to air at 293 K leads to the formation of WO
3
·(OH
2
)
n
-phase on the surface of nanoparticles.
A correlation between value x of nonstoichiometric WO
3−x
oxide matrix and contents of OH-groups in it was revealed. It was noticed, that the
increase of number of W
5+
-states at nanoparticles synthesis leads to rise of the sensor response to molecular hydrogen at room temperature.
© 2007 Elsevier B.V. All rights reserved.
Keywords: Nanoparticles; XPS spectroscopy; Nonstoichiometric oxides; WO
3−x
1. Introduction
Nanodisperse nonstoichiometric WO
3−x
oxides are promis-
ing materials and are used for producing of gas sensors active
elements [1–8]. In the most cases the range of their work temper-
atures is 520–620 K. But during exploitation of active elements
at relatively high work temperatures the degradation processes
are initiated in the nanoparticles of semiconductor oxides. There
are works, which are dealing with room temperatures, for exam-
ple [9–10]. For such work conditions important is the exploration
of the state of sensor’s surface after long contact with air at room
temperature and influence of short-time anneal.
We synthesized nanodisperse nonstoichiometric tungsten
oxides, which demonstrated high sensor response to molecu-
lar hydrogen and rare gases at room temperature. Earlier the
effect of sensitivity to rare gases at physical adsorption at room
temperature was detected for TiO
2
polydisperse samples [11].
Electrical resistance changes at that were completely reversible
(R/R ∼ 0.3). That effect increased with the rise of rutile imper-
fection. Further investigations in that field could be prospective.
The goal of present work was the exploration of features of
core W4f- and O1s-levels of WO
3−x
surface before and after
temperature influence at contact with air to reveal their connec-
tion with sensor characteristics of synthesized nanopowders.
∗
Corresponding author.
E-mail address: (A.M. Korduban).
2. Experimental
Three series of WO
3,
WO
2.9
and WO
2.72
nanopowders were
synthesized at atmospheric pressure by method of electric explo-
sion of wires (EEW) at different proportions between argon
and oxygen. Synthesis of nanoparticles by EEW-method [12,13]
belongs to high-energy methods of synthesis and allows to obtain
nanoparticles with high presence of defects on the surface and
unusual charge states of ions. An explosion in coordinated con-
ditions was chosen for synthesis, injected energy was E = 1.9·E
s
,
where E
s
is the sublimation energy of metal, diameter of tung-
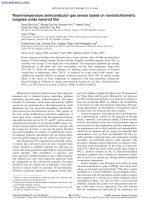
sten wire was 0.6 mm. According to the TEM data (Fig. 1) the
mean size of nanoparticles is 10–35 nm. The nanoparticles have
spherical shape and normal size distribution; their agglomeration
is almost absent. The value x in the nanopowders WO
3−x
was
determined by XPS-method by means of ratio between W
5+
4f-
and W
6+
4f-states.
Active elements of gas sensors were prepared from
WO
3
,WO
2.9
and WO
2.72
-nanopowders on Al
2
O
3
-substrate
(10 × 10 mm) with two electric contacts and slot (100 m width)
by method of sputtering in argon stream. Active elements were
stored on air at room temperature during 14 days. Before instal-
lation into the XPS-spectrometer’s camera a half of them was
annealed on air during 45 min at T = 553 K. The surface of
nanodisperse WO
3−x
oxides was examined in annealed and
non-annealed active elements.
The electronic structure of the surface of WO
3−x
was
explored by method of X-ray photoelectron spectroscopy (XPS)
0368-2048/$ – see front matter © 2007 Elsevier B.V. All rights reserved.
doi:10.1016/j.elspec.2006.12.059
A.P. Shpak et al. / Journal of Electron Spectroscopy and Related Phenomena 156–158 (2007) 172–175 173
Fig. 1. TEM micrograph of WO
3−x
nanoparticles.
by spectrometer ES-2404 with PHOIBOS-100 SPECS energy
analyzer (E Mg K␣ = 1253.6 eV, P = 300 W). The spectrometer
is equipped with the ion gun IQE-11/35 and the flood gun FG
15/40 for sample charge neutralization. The spectra of W4f-
level were decomposed into peak couples with parameters of
spin–orbit separation E
p
(4f
5/2
− 4f
7/2
) = 2.1 eV and intensi-
ties ratio I
4f5/2
/I
4f7/2
= 0.77, full width on half maximum height
(FWHM) was 1.2 eV. The spectra of O1s-level were decomposed
into separate peaks, FWHM = 1.4 eV. The decomposition was
carried out by Gauss–Newton method. The area of peaks was
determined after subtraction of background by Shirley method
[14]. Sensor response (R/R, R-resistance change) to H
2
was
measured by means of system, which consists of measuring
camera, multimeter Keithley-2010 and PC.
3. Results and discussion
The XPS-spectra of W4f- and O1s-levels of the samples
and the results of their decomposition into peaks are shown in
Figs. 2 and 3 correspondingly and in Tables 1 and 2. Fig. 2 rep-
resents the results of decomposition of W4f-line in the annealed
and non-annealed samples. The maxima of peak couples cor-
respond to W4f
7/2
- and W4f
5/2
-levels of tungsten atoms for
W
5+
-states of oxide (comps. c-c
, E
p
W4f
7/2
= 34.8 eV) [15]
Fig. 2. Peak synthesis for W4f-level XPS-spectrum of tungsten atoms.
and W
6+
-states of oxide (comps. d-d
E
p
W4f
7/2
= 35.7 eV) and
hydroxide (comps.e-e
, E
p
W4f
7/2
= 36.1 eV) [15,16], where E
p
– peak energy.
According to the XPS data in the non-annealed sample of
stoichiometric WO
3
the surface of nanoparticles consists of
WO
3
-phase (comps. d-d
, Fig. 2-1) and WO
3
·(OH
2
)
n
-phase
formed after contact with air (comps. e-e’, Fig. 2-1). The results
of decomposition of W4f-line for nonstoichiometric oxides
WO
2.9
and WO
2.72
indicate essential differences in compari-
son with stoichiometric WO
3
. The spectra of the non-annealed
samples show domination of the hydroxide phase (comps. e-e
,
Fig. 2-2, 2-3), this indicates more active interaction of nanopar-
ticles’ surface with water vapor during contact with air right up
to formation of a shell of several WO
3
·(OH
2
)
n
-monolayers. In
the sample WO
2.72
the contribution of W
5+
-states from nonstoi-
chiometric oxide phase can be seen (comps. c-c
, Fig. 2-3). In the
sample WO
2.9
a signal from nonstoichiometric oxide phase is
174 A.P. Shpak et al. / Journal of Electron Spectroscopy and Related Phenomena 156–158 (2007) 172–175
Table 1
Components, peak energies (E
p
) and relative intensities of the peaks (I) for WO
3
,WO
2.9
and WO
2.72
samples
Components, peak energies WO
3
at
293 K, I (%)
WO
2.9
at
293 K, I (%)
WO
2.72
at
293 K, I (%)
WO
3
at
553 K, I (%)
WO
2.9
at
553 K, I (%)
WO
2.72
at
553 K, I (%)
c, W
5+
, E
p
W4f
7/2
= 34.8 eV – – 12.1 – 9.1 14.2
d, W
6+
, E
p
W4f
7/2
= 35.7 eV 57.5 14.3 31.0 100 90.9 85.8
e, W
6+
, E
p
W4f
7/2
= 36.1 eV 42.5 85.7 56.9 – – –
f, O
2−
, E
p
= 530.6 eV 48.5 29.4 19.8 81.4 39.6 18.6
g, OH, E
p
= 531.1 eV 17.0 27.5 30.5 – 23.0 31.1
h, O
−
, E
p
= 532 eV 18.6 26.8 28.1 10.8 28.5 38.1
m, H
2
O, E
p
= 533.1 eV 15.9 16.3 21.6 7.8 8.9 12.2
Precision, I ±1.2
too much reduced due to the absorption by the hydroxide shell so
we didn’t succeed to distinguish the contribution of W
5+
-states.
The structure of W4f-line for stoichiometric and nonstoi-
chiometric oxides after anneal (553 K) also differs essentially.
Fig. 3. Peak synthesis for O1s-level XPS-spectrum of oxygen atoms.
According to the results of decomposition of W4f-line the
surface of stoichiometric tungsten oxide is formed only of W
6+
-
states of WO
3
-phase (comps. d-d
, Fig. 2-4). A signal from
WO
3
·(OH
2
)
n
is absent (comps. e-e
, Fig. 2-4).
The results of decomposition of W4f-line of the annealed
samples WO
2.9
and WO
2.72
(Fig. 2-5, 2-6) show that the surface
of nanoparticles is formed of nonstoichiometric phase WO
3−x
(W
5+
-states, comp. c-c
and W
6+
-states, comps. d-d
). A signal
from WO·(OH
2
)
n
was not fixed.
Fig. 3 shows the results of decomposition into peaks of
O1s-line for the annealed and non-annealed tungsten oxide sam-
ples. The peaks with maxima E
p
O1s = 530.6 eV correspond to
O1s-levels of oxygen atoms O
2−
in the lattice (comp. f) [16].
Free oxide surfaces contacting with the atmosphere are always
hydrated, i.e. contain water molecules and hydroxyl groups.
There are two types of OH-groups on the surface: single M-
OH and double OH–M–OH [17]. Before anneal OH-groups
(E
p
O1s = 531.1 eV) [16] and groups C O(E
p
O1s = 531.2 eV),
C–O–C, C–O–H (E
p
O1s = 532.5–532.8 eV) [18] are present
on the surface of nanoparticles, thus the structure of compo-
nents g, h (Fig. 3) in the initial samples is very complex. The
presence of C
O, C–O–C, C–O–H groups may be caused by
oxidation-reduction and acid-base transitions of CO
2
on catalyt-
ically active oxide surface. After anneal the maxima of peaks in
region 531.1 eV correspond at most to single and double OH-
groups (comp. g), in region 532 eV the maxima of peaks belong
to weakly adsorbed species and O
−
oxygen states (comp. h)
[16,19]. Signal from H
2
O molecules in region E
p
= 533.1 eV is
presented by component m [20,21].
In the non-annealed sample of stoichiometric WO
3
(Fig. 3-1)
the main signal is given by lattice oxygen atoms O
2−
(comp. f)
also components g, h and the contribution from H
2
O molecules
(comp. m) are present. In the non-annealed samples of nonstoi-
chiometric WO
2.9
and WO
2.72
(Fig. 3-2, 3-3) the contributions
of comps. g, h and H
2
O molecules (comp. m) into O1s-line
Table 2
Ratios of OH/O
2−
,O
−
/O
2−
,H
2
O/O
2−
for annealed WO
3
,WO
2.9
and WO
2.72
samples
Ratios WO
3
at 553 K WO
2.9
at 553 K WO
2.72
at 553 K
OH/O
2−
0 0.6 1.7
O
−
/O
2−
0.1 0.7 2.1
H
2
O/O
2−
0.1 0.2 0.7
A.P. Shpak et al. / Journal of Electron Spectroscopy and Related Phenomena 156–158 (2007) 172–175 175
is more considerable and comparable to the contribution from
O
2−
-states.
After anneal of the stoichiometric WO
3
sample the contri-
bution into O1s-line from lattice oxygen atoms O
2−
dominates
(Fig. 3-4, comp. f). A signal in region E
p
= 532 eV may cor-
respond to O
−
oxygen states and particularly to remnants of
adsorbed species (comp. h) and it is much decreased. The main
difference is the complete absence of OH-groups (comp. g) on
the surface. On the contrary the relative contribution of OH-
groups and H
2
O on the surface of WO
2.9
and WO
2.72
remains
high after anneal and it is proportional to the nonstoichiome-
try value x of WO
3−x
oxides (comps. g, m, Fig. 3-5 and 3-6;
OH/O
2−
,H
2
O/O
2−
in Table 2). Thus, after anneal OH-groups
(comp. g) are present only in nonstoichiometric oxides. Also
the contribution of O
−
oxygen states (comp. h, Fig. 3-5 and 3-6;
O
−
/O
2−
in Table 2) rises. In all the samples the decrease of con-
tribution of comp. m can be seen, that can be connected mainly
with destruction of WO
3
·(OH
2
)
n
-phase.
Thus the contents of OH-groups and H
2
O in the nonstoichio-
metric WO
3−x
-oxides is proportional to the nonstoichiometry
value x. Paper [22] shows direct link between catalytic and
electrochemical activity of oxide-hydroxide compounds and ion
component of conductivity, formed by hydroxyl groups. There-
fore synthesis of oxide nanoparticles with enlarged contents
of M
(n−y)+
-cations relatively to M
n+
-cations allows to form an
exceed of OH
−
-anions which determines catalytic and electro-
chemical activity of oxides.
The increase of OH-groups contents in the nonstoichiometric
tungsten oxides can be explained due to possibility of oxygen
vacancy infill by OH-group. At that W
5+
-cation should be in the
centre of octahedron of five O
2−
-ions and one OH
−
-anion. The
formula of such nonstoichiometric compound can be written as
W
x
5+
W
1−x
6+
O
3−x
(OH)
x
(1), where x are the hydroxyl groups
that filled oxygen vacancies in the lattice.
However high value of ratio OH/O
2−
(Table 2) indicates the
oxide-hydroxide compound W
x
5+
W
1−x
6+
O
3−x−y
·(OH)
x+2y
(2),
where 2y are two hydroxyl groups which replaced O
2−
-ion in
WO
6
-octahedron due to reaction O
2−
+H
2
O → 2OH
−
.
On the whole in the nonstoichiometric tungsten oxides a tran-
sition W
x
5+
W
1−x
6+
O
3−0.5x
→ W
x
5+
W
1−x
6+
O
3−x
·(OH)
x
→
WO
3
·(OH
2
)
n
as a result of hydration in water vapors
is observed with formation of hydrate shell parti-
cles on the surface. After anneal on air a transition
WO
3
·(OH
2
)
n
→ W
x
5+
W
1−x
6+
O
3−x−y
·(OH)
x+2y
is observed.
Sensor response R/R for 3% H
2
concentration in air at room
temperature equals 2 for active element based on WO
2.9
and
2.2 for active element based on WO
2.72
. Electrical resistance
changes at that are completely reversible. After a month the
signal becomes two times lower. For active elements based on
stoichiometric WO
3
nanopowders sensor response R/R =0.
4. Conclusions
Thus in the nonstoichiometric tungsten oxides the contents
of OH-groups is proportional to the nonstoichiometry value
x of the oxide matrix WO
3−x
. Exposure to air at 293 K of
nonstoichiometric nanodisperse tungsten oxides leads to the
formation of WO
3
·(OH
2
)
n
-phase on the surface of nanoparti-
cles. The sensor response is observed only in oxides with high
contents of W
5+
-states. Fragment W
5+
-OH
−
responds for elec-
tron and proton component of conductivity. We suppose that
resistance change is caused by the process of protonic and elec-
tronic conductivity blocking at H
2
adsorption by the surface of
W
x
5+
W
1−x
6+
O
3−x−y
·(OH)
x+2y
-phase.
References
[1] J. Solis, S. Saukko, L. Kish, C. Granqvist, V. Lantto, Thin Solid Films 391
(2001) 255.
[2] H. Lin, C. Hsu, H. Yang, P. Lee, C. Yang, Sens. Actuators B 22 (1994) 63.
[3] M. Ando, T. Tsuchida, S. Suto, T. Suzuki, C. Nakayama, N. Miura, N.
Yamazoe, J. Ceram. Soc. Jpn. 104 (1996) 1112.
[4] X. Wang, N. Miura, N. Yamazoe, Sens. Actuators B 66 (2000) 74.
[5] C.N. Xu, N. Miura, Y. Ishida, K. Matsuda, N. Yamazoe, Sens. Actuators B
65 (2000) 163.
[6] E. Llobet, G. Molas, P. Molin
`
as, J. Calderer, X. Vilanova, J. Brezmes, J.E.
Sueiras, J. Electrochem. Soc. 147 (2000) 776.
[7] G. Sberveglieri, L. Depero, S. Groppelli, P. Nelli, Sens. Actuators B 26–27
(1995) 89.
[8] S. Moulzolf, S. Ding, R. Lad, Sens. Actuators B 77 (2001) 375.
[9] J. Solis, S. Saukko, L. Kish, C. Granqvist, V. Lantto, Sens. Actuators B 77
(2001) 316.
[10] J. Shieh, H.M. Feng, M.H. Hon, H.Y. Juang, Sens. Actuators B86 (2002)
75.
[11] V.F. Kiselev, O.V. Krylov,Electron Phenomena in Adsorption and Catalysis
in Semiconductors and Dielectrics, Nauka, Moscow, 1979 (in Russian).
[12] S.A. Pikuz, T.A. Shelkovenko, D.B. Sinars, J.B. Greenly, Y.S. Dimant, D.A.
Hammer, Phys. Rev. Lett. 83 (1999) 4313.
[13] P. Sen, J. Ghosh, A. Abdullan, P. Kumar, Chem. Sci Proc. Indian Acad.
Sci. Vol. 115, 5–6, New Delhi, India, October–December, 2003, p. 499.
[14] D. Briggs, M.P. Seach, Practical Surface Analysis by Auger and X-Ray
Photoelectron Spectroscopy, John Wiley & Sons, Chichester—New York,
1983.
[15] P. Charton, L. Gengembre, P. Armand, J. Solid State Chem. 168 (2002)
175.
[16] J.C. Dupin, D. Gonbeau, P. Vinatier, A. Levasseur, Phys. Chem. Chem.
Phys. 2 (2000) 1319.
[17] V.F. Kiselev, S.N. Kozlov, A.V. Zoteev, Fundamentals of Physics of Solids’
Surface, Moscow University Publishers, Moscow, 1999 (in Russian).
[18] S.J. Kerber, J.J. Bruckner, S. Seal, S. Hardcastle, T.L. Barr, J. Vac. Sci.
Technol. A14 (1996) 1314.
[19] Y. Stoh, Surface 2 (1987) 68 (in Russian).
[20] C.D. Wagner, J.F. Moulder, L.E. Davis, W.M. Riggs, Handbook of X-ray
Photoelectron Spectroscopy, Perking-Elmer Corp., New York, 1979.
[21] V.I. Nefedov, X-Ray Spectroscopy of Chemical Compunds, Chemistry,
Moscow, 1984 (in Russian).
[22] N.D. Ivanova, E.I. Boldyrev, O.A. Stadnik, N.E. Vlasenko, Nanosyst.
Nanomater. Nanotechnol. 4 (2004) 1185 (in Ukrainian).