power system stability and control chuong (34)
Bạn đang xem bản rút gọn của tài liệu. Xem và tải ngay bản đầy đủ của tài liệu tại đây (168.98 KB, 8 trang )
32
Voltage Fluctuations
and Lamp Flicker
in Power Systems
S.M. Halpin
Auburn University
Voltage flicker is a problem that has existed in the power industry for many years. Many types of end-use
equipment can create voltage flicker, and many types of solution methods are available. Fortunately, the
problem is not overly complex, and it can often be analyzed using fairly simple methods. In many cases,
however, solutions can be expensive. Perhaps the most difficult aspect of the voltage flicker problem has
been the development of a widely accepted definition of just what ‘‘flicker’’ is and how it can be
quantified in terms of measurable quantities.
To electric utility engineers, voltage flicker is considered in terms of magnitude and rate of change of
voltage fluctuations. To the utility customer, however, flicker is considered in terms of ‘‘my lights are
flickering.’’ The necessary presence of a human observer to ‘‘see’’ the change in lamp (intensity) output
in response to a change in supply voltage is the most complex factor for which to account. Significant
research, dating back to the early 20
th
century, has been devoted to establishing an accurate correlation
between voltage changes and observer perceptions. This correlation is essential so that a readily
measurable quantity, supply voltage, can be used to predict a human response.
The early work regarding voltage flicker considered voltage flicker to be a single-frequency modula-
tion of the power frequency voltage. Both sinusoidal and square wave modulations were considered as
shown mathematically in Eqs. (32.1) and (32.2), with most work concentrating on square wave
modulation.
v(t) ¼
ffiffiffi
2
p
V
rms
cos (vt){1:0 þ V cos (v
m
t)} (32:1)
v(t) ¼
ffiffiffi
2
p
V
rms
cos (vt){1:0 þ Vsquare(v
m
t)} (32:2)
Based on Eqs. (32.1) and (32.2), the voltage flicker magnitude can be expressed as a percentage of the
root-mean-square (rms) voltage, where the term ‘‘V’’ in the two equations represents the percentage.
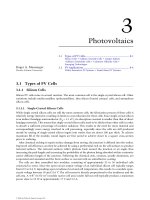
While both the magnitude of the fluctuations (‘‘V’’) and the ‘‘shape’’ of the modulating waveform are
obviously important, the frequency of the modulation is also extremely relevant and is explicitly
represented as v
m
. For sinusoidal flicker [given by Eq. (32.1)], the total waveform appears as shown
in Fig. 32.1 with the modulating waveform shown explicitly. A similar waveform can be easily created for
square-wave modulation.
To correlate the voltage change percentage, V, at a certain frequency, v
m
, with human perceptions,
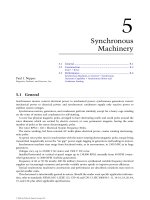
early research led to the widespread use of what is known as a flicker curve to predict possible observer
complaints. Flicker curves are still in widespread use, particularly in the U.S. A typical flicker curve is
ß 2006 by Taylor & Francis Group, LLC.
shown in Fig. 32.2 and is based on tests conducted by the General Electric Company. It is important to
realize that these curves are developed based on square wave modulation. Voltage changes from one level
to another are considered to be ‘‘instantaneous’’ in nature, which may or may not be an accurate
representation of actual equipment-produced voltage fluctuations.
The curve of Fig. 32.2 requires some explanation in order to understand its application. The
‘‘threshold of visibility’’ corresponds to certain fluctuation magnitude and frequency pairs that represent
the borderline above which an observer can just perceive lamp (intensity) output variations in a 120 V,
60 Hz, 60 W incandescent bulb. The ‘‘threshold of irritation’’ corresponds to certain fluctuation
magnitude and frequency pairs that represent the borderline above which the majority of observers
would be irritated by lamp (intensity) output variations for the same lamp type. Two conclusions are
immediately apparent from these two curves: (1) even small percentage changes in supply voltage can be
noticed by persons observing lamp output, and (2) the frequency of the voltage fluctuations is an
important consideration, with the frequency range from 6–10 Hz being the most sensitive.
Most utility companies do not permit excessive voltage fluctuations on their system, regardless of the
frequency. For this reason, a ‘‘typical’’ utility flicker curve will follow either the ‘‘threshold of irritation’’
or the ‘‘threshold of visibility’’ curve as long as the chosen curve lies below some established value
(2% in Fig. 32.2). By requiring that voltage fluctuations not exceed the ‘‘borderline of visibility’’ curve,
the utility is insuring conservative criteria that should minimize potential problems due to voltage
fluctuations.
For many years, the generic flicker curve has served the utility industry well. Fluctuating motor loads
like car shredders, wood chippers, and many others can be fairly well characterized in terms of a duty
cycle and a maximum torque. From this information, engineers can predict the magnitude and
1.5
0.5
−0.5
−1.5
−1
1
1
0
FIGURE 32.1 Sinusoidal voltage flicker.
7
6
5
4
3
2
1
0
1 1 1 2 3 4 6 10 152 4 6 1020302
Fluctuations per
Hour
Fluctuations per
Minute
Threshold of Irritation
Threshold of Visibility
% Voltage Fluctuation
"Typical" Flicker Curve
Fluctuations per
Second
3 6 10 20 30
FIGURE 32.2 Typical flicker curves.
ß 2006 by Taylor & Francis Group, LLC.
frequency of voltage changes anywhere in the supplying transmission and distribution system. Voltage
fluctuations associated with motor starti ng events are also easily translated into a point (or points) on
the flicker curve, and many utilities have based their motor starting criteria on this method for many
years. Other loads, most notably arcing loads, cannot be represented as a single flicker magnitude and
frequency term. For these types of loads, utility engineers typically presume either worst-case or most-
likely variations for analytical evaluations.
Regardless of the type of load, the t ypical calculation procedure involves either basic load flow or
simple voltage division calculations. Figure 32.3 shows an example positive sequence circuit with all data
assumed in per-unit on consistent bases.
For fluctuating loads that are best represented by a constant power model (arc furnaces and load
torque variations on a running motor), basic load flow techniques can be used to determine the full-load
and no-load (or ‘‘normal condition’’) voltages at the ‘‘critical’’ or ‘‘point of common coupling’’ bus
where other customers might be served. For fluctuating loads that are best represented by a constant
impedance model (motor starting), basic circuit analysis techniques readily provide the full-load and
no-load (‘‘normal condition’’) voltages at the critical bus. Regardless of the modeling and calculation
procedures used, equations similar to Eq. (32.3) can be used to determine the percentage voltage change
for use in conjunction with a flicker curve. Of course, accurate information regarding the frequency of
the assumed fluctuation is absolutely necessary. Note that Eq. (32.3) represents an over-simplification
and should therefore not be used in cases where the fluctuations are frequent enough to impact the
average rms value (measured over several seconds up to a minute). Other more elaborate formulas are
available for these situations.
%Voltage Change ¼ 1:0 À
V
full load
V
normal
à 100% (32:3)
From a utility engineer’s viewpoint, the decision to either serve or deny service to a fluctuating load is
often based on the result of Eq. (32.3) [or a more complex version of Eq. (32.3)] including information
about the frequency at which the calculated change occurs. From this simplified discussion, several
questions arise:
1. How are fluctuating loads taken into account when the nature of the fluctuations is not constant
in magnitude?
2. How are fluctuating loads taken into account when the nature of the fluctuations is not constant
in frequency?
3. How are static compensators and other high response speed mitigation devices included in the
calculations?
To other customers
Z
xfmr
Z
source
V
source
Fluctuating
Load
FIGURE 32.3 Example circuit for flicker calculations.
ß 2006 by Taylor & Francis Group, LLC.
As examples, consider the rms voltage plots (on 120 V bases) shown in Figs. 32.4 and 32.5. Figure 32.4
shows an rms plot associated with a poorly timed two-step reduced-voltage motor starter. Figure 32.5
shows a motor starting event when the motor is compensated by an adaptive-var compensator.
Questions 1–3 are clearly difficult to answer for these plots, so it would be very difficult to apply the
basic flicker curve.
In many cases of practical interest, ‘‘rules of thumb’’ are often used to answer approximately these and
other related questions so that the simple flicker curve can be used effectively. However, these assump-
tions and approaches must be conservative in nature and may result in costly equipment modifications
prior to connection of certain fluctuating loads. In modern environment, it is imperative that end-users
operate at the least total cost. It is equally important that end-use fluctuating loads not create problems
for other users. Due to the conservative and approximate nature of the flicker curve methodology, there
is often significant room for negotiation, and the matter is often not settled considering only engineering
results.
For roughly three decades, cer tain engineering groups have recognized the limitations of the flicker
curve methods and have developed alternative approaches based on an instrument called a flicker meter.
This work, driven strongly in Europe by the International Union for Electroheat (UIE) and the
International Electrotechnical Commission (IEC), appears to offer solutions to many of the problems
with the flicker curve methodology. Many years of industrial experience have been obtained with the
flicker meter approach, and its output has been well-correlated with complaints of utility customers. At
this time, the Institute of Electrical and Electronics Engineers (IEEE) is working toward adopting the
flicker meter methodology for use in North America.
The flicker meter is a continuous time measuring system that takes voltage as an input and produces
three output indices that are related to customer perception. These outputs are: (1) instantaneous flicker
Time (s)
1
110
112
Primary RMS Voltage
114
116
118
120
122
124
234567
FIGURE 32.4 Poorly timed motor starter voltage fluctuation.
Time (s)
1
114
Primary RMS Voltage
116
118
120
122
124
126
128
234
FIGURE 32.5 Adaptive-var compensator effects.
ß 2006 by Taylor & Francis Group, LLC.
sensation, P
inst
, (2) short-term flicker severity, P
st
, and (3) long-term flicker severity, P
lt
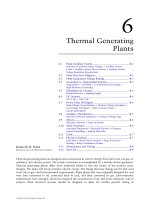
. A block
diagram of an analog flicker meter is shown in Fig. 32.6.
The flicker meter takes into account both the physical aspects of engineering (how does the lamp
[intensity] output vary with voltage?) and the physiological aspects of human observers (how fast can
the human eye respond to light changes?). Each of the five basic blocks in Fig. 32.6 contribute to one or
both of these aspects. While a detailed discussion of the flicker meter is beyond the scope of this chapter,
the function of the blocks can be summarized as follows.
Blocks 1 and 2 act to process the input voltage signal and to partially isolate only the modulating term
in Eqs. (32.1) or (32.2). Block 3 completes the isolation of the modulating signal through complex
filtering and applies frequency-sensitive weighting to the ‘‘pure’’ modulating signal. Block 4 models the
physiological response of the human observer, specifically the short-term memory tendency of the brain
to correlate the voltage modulating signal with a human perception ability. Block 5 performs statistical
analysis on the output of Block 4 to capture the cumulative effects of fluctuations over time.
The instantaneous flicker sensation is the output of Block 4. The short- and long-term severity indices
are the outputs of Block 5. P
inst
is available as an output quantity on a continuous basis, and a value of
1.0 corresponds with the threshold of visibility cur ve in Fig. 32.2. A single P
st
value is available as an
output every ten minutes, and a value of 1.0 corresponds to the threshold of irritation curve in Fig. 32.2.
Of course, a comparison can only be made for certain inputs.
For square wave modulation, Fig. 32.7
shows a comparison of the ‘‘irritation level’’
given by IEEE Std. 141 (Red Book) and that
level predicted by the flicker meter to be
‘‘irritating’’ (P
st
¼ 1.0). For these compar-
isons, the lamp type used is a 120 V, 60 Hz,
60 W incandescent bulb. Note that the flicker
curve taken from IEEE Std. 141 is essentially
identical to the ‘‘borderline of irritation’’
curve given in Fig. 32.2.
As Fig. 32.7 clearly demonstrates, the
square wave modulation voltage fluctuations
that lead to irritation are nearly identical as
predicted by either a standard flicker curve
or a flicker meter.
The real advantage of the flicker m eter meth-
odology lies in t hat fact that the continuous
Input
Transformer
Block 1 Block 2
dB
1
−3
.05 0 8.8
Range
selector
0.5
1.0
2.0
5.0
10.0
20.0
%
ΔV
V
Hz
Weighting filters
35 Hz
Block 3 Block 4 Block 5
A/D
converter
Sampling
rate
≥50 Hz
Squaring
multiplier
Squaring and
smoothing
Square rooter 1 min integrator
Statistical evaluation of flicker level
Programming of short and long
observation periods
Output
and data
display
and
recording
Output 5
recording
Output 4
short time
integration
Output 3
range
selection
Output 2
weighted
voltage
fluctuation
64 Level
classifier
Output
interfaces
1
st
order
sliding
mean
filter
Simulation of lamp-eye brain response
Detector and
gain control
Demodulator
with
squaring
multiplier
Signal generator
for calibration
checking
Input voltage
adaptor
R.M.S
meter
Output 1
half cycle r.m.s. voltage
indication
√
∫
FIGURE 32.6 Flicker meter block diagram.
IEEE 141
120 V UIE
0.01
0.1
1
10
ΔV
(%)
0.1 1 10 100
chan
g
es/minute
1000 10000
FIGURE 32.7 Threshold of irritation flicker curve and P
st
¼
1.0 curve from a flicker meter.
ß 2006 by Taylor & Francis Group, LLC.
time measur ement s ystem c an easily predict possible irritation for arbitrarily complex modulation waveforms.
As an example, Fig. 32.8 shows a plot of P
st
over a three-day period at a location serving a small electric arc
furnace. (Note: In this case, there were no reported customer complaints and P
st
was well below the irritation
threshold value of 1.0 during the entire monitoring period.)
Due to the very random nature of the fluctuations associated with an arc furnace, the flicker curve
methodology cannot be used directly as an accurate predictor of irritation levels because it is appropriate
only for the ‘‘sudden’’ voltage fluctuations associated with square wave modulation. The trade-off
required for more accurate flicker prediction, however, is that the inherent simplicity of the basic flicker
curve is lost.
For the basic flicker curve, simple calculations based on circuit and equipment models in Fig. 32.3 can
be used. Data for these models is readily available, and time-tested assumptions are widely known for
cases when exact data are not available. Because the flicker meter is a continuous-time system,
continuous-time voltage input data is required for its use. For existing fluctuating loads, it is reasonable
to presume that a flicker meter can be connected and used to predict whether or not the fluctuations are
irritating. However, it is necessary to be able to predict potential flicker problems prior to the connection
of a fluctuating load well before it is possible to measure anything.
There are three possible solutions to the apparent ‘‘prediction’’ dilemma associated with the flicker
meter approach. The most basic approach is to locate an existing fluctuating load that is similar
to the one under consideration and simply measure the flicker produced by the existing load. Of course,
the engineer is responsible for making sure that the existing installation is nearly identical to the one
proposed. While the fluctuating load equipment itself might be identical, supply system characteristics
will almost never be the same.
Because the short-term flicker severity output of the flicker meter, P
st
, is linearly dependent on voltage
fluctuation magnitude over a wide range, it is possible to linearly scale the P
st
measurements from one
location to predict those at another location where the supply impedance is different. (In most cases,
voltage fluctuations are directly related to the supply impedance; a system with 10% higher supply
impedance would expect 10% greater voltage fluctuation for the same load change.) In evaluations
where it is not possible to measure another existing fluctuating load, other approaches must be used.
If detailed system and load data are known, a time-domain simulation can be used to generate a
continuous-time series of voltage data points. These points could then be used as inputs to a simulated
flicker meter to predict the short-term flicker severity, P
st
. This approach, however, is usually too
intensive and time-consuming to be appropriate for most applications. For these situations, ‘‘shape
factors’’ have been proposed that predict a P
st
value for various types of fluctuations.
Short Term Flicker Severity
Time (hour:minute)
0
0.2
0.4
0.6
0.8
1
13:20
13:20
17:20
17:20
17:20
21:20
1:20
1:20
1:20
5:20
5:20
5:20
9:20
9:20
9:20
13:20
21:20
21:20
Pst
FIGURE 32.8 Short term flicker severity example plot.
ß 2006 by Taylor & Francis Group, LLC.
Shape factors are simple curves that can be used to predict, wit hout simulation or measurement, the
P
st
that would be measured if the load were connected. Different curves exist for different ‘‘shapes’’ of
voltage variation. Curves exist for simple square and triangular variations, as well as for more complex
variations such as motor starting. To use a shape factor, an engineer must have some knowledge of
(1) the magnitude of the fluctuation, (2) the shape of the fluctuation, including the time spent at each
voltage level if the shape is complex, (3) rise time and fall times between voltage levels, and (4) the rate at
which the shape repeats. In some cases, this level of data is not available, and assumptions are often
made (on the conservative side). It is interesting to note that the extreme of the conservative choices is a
rectangular fluctuation at a known frequency; which is exactly the data required to use the basic flicker
curve of Fig. 32.2.
Using either the flicker curve for simple evaluations or the flicker meter methodology for more
complex evaluations, it is possible to predict if a given fluctuating load will produce complaints from
other customers. In the event that complaints are predicted, modifications must be made prior to
granting service. The possible modifications can be made either on the utility side or on the customer
(load) side (or both), or some type of compensation equipment can be installed.
In most cases, the most effective, but not least cost, ways to reduce or eliminate flicker complaints are
to either (1) reduce the supply system impedance of the whole path from source to fluctuating load, or
(2) serve the fluctuating load from a dedicated and electrically remote (from other customers) circuit. In
most cases, utility revenue projections for customers with fluctuating loads do not justify such expenses,
and the burden of mitigation is shifted to the consumer.
Customers with fluctuating load equipment have two main options regarding voltage flicker mitiga-
tion. In some cases, the load can be adjusted to the point that the frequency(ies) of the fluctuations are
such that complaints are eliminated (recall the frequency-sensitive nature of the entire flicker problem).
In other cases, direct voltage compensation can be achieved through high-speed static compensators.
Either thyristor-switched capacitor banks (often called adaptive var compensators or AVCs) or fixed
capacitors in parallel with thyristor-switched reactors (often called static var compensators or SVCs) can
be used to provide voltage support through reactive compensation in about one cycle. For loads where
the main contributor to a large voltage fluctuation is a large reactive power change, reactive compen-
sators can significantly reduce or eliminate the potential for flicker complaints. In cases where voltage
fluctuations are due to large real power changes, reactive compensation offers only small improvements
and can, in some cases, make the problem worse.
In conclusion, it is almost always necessary to measure=predict flicker levels under a variety of
possible conditions, both with and without mitigation equipment and procedures in effect. In very
simple cases, a basic flicker curve will provide acceptable results. In more complex cases, however, an
intensive measurement, modeling, and simulation effort may be required in order to minimize potential
flicker complaints.
While this chapter has addressed the basic issues associated with voltage flicker complaints, predic-
tion, and measurement, it is not intended to be all-inclusive. A number of relevant publications, papers,
reports, and standards are given for further reading, and the reader should certainly consider these
documents carefully in addition to what is provided here.
Further Information
Bergeron, R., Power Quality Measurement Protocol: CEA Guide to Performing Power Quality Surveys,
CEA Report 220 D 771, May 1996.
IEC 1000-3-3, Electromagnetic Compatibility (EMC) Part 3: Limits — Part 3: Limitation of Voltage
Fluctuations and Flicker in Low-Voltage Supply Systems for Equipment with Rated Current 16
A, 1994.
ß 2006 by Taylor & Francis Group, LLC.
IEC 1000-3-5, Electromagnetic Compatibility (EMC) Part 3: Limits — Part 5: Limitation of Voltage
Fluctuations and Flicker in Low-Voltage Supply Systems for Equipment with Rated Current > 16
A, 1994.
IEC 1000-3-7, Electromagnetic Compatibility (EMC) Part 3: Limits — Part 7: Assessment of Emission
Limits for Fluctuating Loads in MV and HV Power Systems, 1996.
IEC 1000-3-11,Electromagnetic Compatibility (EMC) Part 3: Limits — Part 11: Limitation of Voltage
Changes, Voltage Fluctuations, and Flicker in Public Low Voltage Supply Systems with Rated Current
75 A and Subject to Conditional Connection, 1996.
IEC 61000-4-15, Flickermeter-Functional and Design Specifications, 1997–11.
IEC Publication 868, Flickermeter-Functional and Design Specifications, 1986.
IEEE Standard 141-1993: Recommended Practice for Power Distribution in Industrial Plants,
IEEE, 1993.
Sakulin, M. and Key, T.S., UIE=IEC Flicker Standard for Use in North America: Measuring Techniques
and Practical Applications, in Proceedings of PQA’97, March 1997.
Seebald, R.C., Buch, J.F., and Ward, D.J., Flicker Limitations of Electric Utilities, IEEE Trans. on Power
Appar. Syst., PAS-104, 9, September 1985.
UIE WG on Disturbances, Flicker Measurement and Evaluations: 2nd Revised Edition, 1992.
UIE WG on Disturbances, Connection of Fluctuating Loads, 1998.
UIE WG on Disturbances, Guide to Quality of Electrical Supply for Industrial Installations, Part 5:
Flicker and Voltage Fluctuations, 1999.
Xenis, C.P. and Perine, W., Slide rule yields lamp flicker data, Electrical World, October 1937.
ß 2006 by Taylor & Francis Group, LLC.