synchronous generators chuong (8)
Bạn đang xem bản rút gọn của tài liệu. Xem và tải ngay bản đầy đủ của tài liệu tại đây (1.18 MB, 57 trang )
© 2006 by Taylor & Francis Group, LLC
8-1
8
Testing of Synchronous
Generators
8.1 Acceptance Testing 8-2
A1: Insulation Resistance Testing • A2: Dielectric and Partial
Discharge Tests • A3: Resistance Measurements • A4–A5: Tests
for Short-Circuited Field Turns and Polarity Test for Field
Insulation • A6: Shaft Current and Bearing Insulation • A7:
Phase Sequence • A8: Telephone-Influence Factor (TIF) • A9:
Balanced Telephone-Influence Factor • A10: Line-to-Neutral
Telephone-Influence Factor • A11: Stator Terminal Voltage
Waveform Deviation and Distortion Factors • A12: Overspeed
Tests • A13: Line Charging Capacity • A14: Acoustic Noise
8.2 Testing for Performance (Saturation Curves,
Segregated Losses, Efficiency)
8-8
Separate Driving for Saturation Curves and Losses • Electric
Input (Idle-Motoring) Method for Saturation Curves and
Losses • Retardation (Free Deceleration Tests)
8.3 Excitation Current under Load and Voltage
Regulation
8-15
The Armature Leakage Reactance • The Potier Reactance •
Excitation Current for Specified Load • Excitation Current for
Stability Studies • Temperature Tests
8.4 The Need for Determining Electrical Parameters 8-22
8.5 Per Unit Values
8-23
8.6 Tests for Parameters under Steady State
8-25
X
du
, X
ds
Measurements • Quadrature-Axis Magnetic Saturation
X
q
from Slip Tests • Negative Sequence Impedance Z
2
• Zero
sequence impedance Z
o
• Short-Circuit Ratio • Angle δ, X
ds
, X
qs
Determination from Load Tests • Saturated Steady-State
Parameters from Standstill Flux Decay Tests
8.7 Tests To Estimate the Subtransient and Transient
Parameters
8-37
Three-Phase Sudden Short-Circuit Tests • Field Sudden Short-
Circuit Tests with Open Stator Circuit • Short-Circuit Armature
Time Constant T
a
• Transient and Subtransient Parameters
from d and q Axes Flux Decay Test at Standstill
8.8 Subtransient Reactances from Standstill
Single-Frequency AC Tests
8-41
8.9 Standstill Frequency Response Tests (SSFRs)
8-42
Background • From SSFR Measurements to Time Constants •
The SSFR Phase Method
8.10 Online Identification of SG Parameters 8-51
8.11 Summary
8-52
References
8-56
© 2006 by Taylor & Francis Group, LLC
8-2 Synchronous Generators
Testing of synchronous generators (SGs) is performed to obtain the steady-state performance character-
istics and the circuit parameters for dynamic (transients) analysis. The testing methods may be divided
into standard and research types. Tests of a more general nature are included in standards that are renewed
from time to time to include recent well-documented progress in the art. Institute of Electrical and
Electronics Engineers (IEEE) standards 115-1995 represent a comprehensive plethora of tests for syn-
chronous machines.
New procedures start as research tests. Some of them end up later as standard tests. Standstill frequency
response (SSFR) testing of synchronous generators for parameter estimation is such a happy case. In
what follows, a review of standard testing methods and the incumbent theory to calculate the steady-
state performance and, respectively, the parameter estimation for dynamics analysis is presented. In
addition, a few new (research) testing methods with strong potential to become standards in the future
are also treated in some detail.
Note that the term “research testing” may also be used with the meaning “tests to research for new
performance features of synchronous generators.” Determination of flux density distribution in the airgap
via search coil or Hall probes is such an example. We will not dwell on such “research testing methods”
in this chapter.
The standard testing methods are divided into the following:
• Acceptance tests
• (Steady-state) performance tests
• Parameter estimation tests (for dynamic analysis)
From the nonstandard research tests, we will treat mainly “standstill step voltage response” and the on-
load parameter estimation methods.
8.1 Acceptance Testing
According to IEEE standard 115-1995 SG, acceptance tests are classified as follows:
• A1: insulation resistance testing
• A2: dielectric and partial discharge tests
• A3: resistance measurements
• A4: tests for short-circuited field turns
• A5: polarity test
for field insulation
• A6: shaft current and bearing insulation
• A7: phase sequence
• A8: telephone-influence factor (TIF)
• A9: balanced telephone-influence factor
• A10: line to neutral telephone-influence factor
• A11: stator terminal voltage waveform deviation and distortion factors
• A12: overspeed tests
• A13: line charging capacity
• A14: acoustic noise
8.1.1 A1: Insulation Resistance Testing
Testing for insulation resistance, including polarization index, influences of temperature, moisture, and
voltage duration are all covered in IEEE standard 43-1974. If the moisture is too high in the windings,
the insulation resistance is very low, and the machine has to be dried out before further testing is
performed on it.
© 2006 by Taylor & Francis Group, LLC
Testing of Synchronous Generators 8-3
8.1.2 A2: Dielectric and Partial Discharge Tests
The magnitude, wave shape, and duration of the test voltage are given in American National Standards
Institute (ANSI)–National Electrical Manufacturers Association (NEMA) MGI-1978. As the applied
voltage is high, procedures to avoid injury to personnel are prescribed in IEEE standard 4-1978. The test
voltage is applied to each electrical circuit with all the other circuits and metal parts grounded. During
the testing of the field winding, the brushes are lifted. In brushless excitation SGs, the direct current
(DC) excitation leads should be disconnected unless the exciter is to be tested simultaneously. The
eventual diodes (thyristors) to be tested should be short-circuited but not grounded. The applied voltage
may be as follows:
• Alternating voltage at rated frequency
• Direct voltage (1.7 times the rated SG voltage), with the winding thoroughly grounded to dissipate
the charge
• Very low frequency voltage 0.1 Hz, 1.63 times the rated SG voltage
8.1.3 A3: Resistance Measurements
DC stator and field-winding resistance measurement procedures are given in IEEE standard 118-1978.
The measured resistance
R
test
at temperature t
test
may be corrected to a specified temperature t
s
:
(8.1)
where
k = 234.5 for pure copper (in °C).
The reference field-winding resistance may be DC measured either at standstill, with the rotor at
ambient temperature, and the current applied through clamping rings, or from a running test at normal
speed. The brush voltage drop has to be eliminated from voltage measurement.
If the same DC measurement is made at standstill, right after the SG running at rated field current,
the result may be used to determine the field-winding temperature at rated conditions, provided the
brush voltage drop is eliminated from the measurements.
8.1.4 A4–A5: Tests for Short-Circuited Field Turns and Polarity Test for
Field Insulation
The purpose of these tests is to check for field-coil short-circuited turns, for number of turns/coil, or for
short-circuit conductor size. Besides tests at standstill, a test at rated speed is required, as short-circuited
turns may occur at various speeds. There are DC and alternating current (AC) voltage tests for the scope.
The DC or AC voltage drop across each field coil is measured. A more than +2% difference between the
coil voltage drop indicates possible short-circuits in the respective coils. The method is adequate for
salient-pole rotors. For cylindrical rotors, the DC field-winding resistance is measured and compared
with values from previous tests. A smaller resistance indicates that short-circuited turns may be present.
Also, a short-circuited coil with a U-shaped core may be placed to bridge one coil slot. The U-shaped
core coil is placed successively on all rotor slots. The field-winding voltage or the impedance of the
winding voltage or the impedance of the exciting coil decreases in case there are some short-circuited
turns in the respective field coil. Alternatively, a Hall flux probe may be moved in the airgap from pole
to pole and measures the flux density value and polarity at standstill, with the field coil DC fed at 5 to
10% of rated current value.
If the flux density amplitude is higher or smaller than that for the neighboring poles, some field coil
turns are short-circuited (or the airgap is larger) for the corresponding rotor pole. If the flux density
does not switch polarity regularly (after each pole), the field coil connections are not correct.
RR
tk
tk
stest
s
test
=
+
+
© 2006 by Taylor & Francis Group, LLC
8-4 Synchronous Generators
8.1.5 A6: Shaft Current and Bearing Insulation
Irregularities in the SG magnetic circuit lead to a small axial flux that links the shaft. A parasitic current
occurs in the shaft, bearings, and machine frame, unless the bearings are insulated from stator core or
from rotor shaft. The presence of pulse-width modulator (PWM) static converters in the stator (or rotor)
of SG augments this phenomenon. The pertinent testing is performed with the machine at no load and
rated voltage. The voltage between shaft ends is measured with a high impedance voltmeter. The same
current flows through the bearing radially to the stator frame.
The presence of voltage across bearing oil film (in uninsulated bearings) is also an indication of the
shaft voltage.
If insulated bearings are used, their effectiveness is checked by shorting the insulation and observing
an increased shaft voltage. Shaft voltage above a few volts, with insulated bearings, is considered unac-
ceptable due to bearing in-time damage. Generally, grounded brushes in shaft ends are necessary to
prevent it.
8.1.6 A7: Phase Sequence
Phase sequencing is required for securing given rotation direction or for correct phasing of a generator
prepared for power bus connection. As known, phase sequencing can be reversed by interchanging any
two armature (stator) terminals.
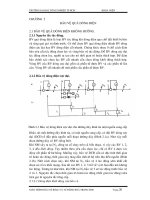
There are a few procedures used to check phase sequence:
• With a phase-sequence indicator (or induction machine)
• With a neon-lamp phase-sequence indicator (Figure 8.1a and Figure 8.1b)
• With the lamp method (Figure 8.1b)
When the SG no-load voltage sequence is 1–2–3 (clockwise), the neon lamp 1 will glow, while for the
1–3–2 sequence, the neon lamp 2 will glow. The test switch is open during these checks. The apparatus
works correctly if, when the test switch is closed, both lamps glow with the same intensity (Figure 8.1a).
With four voltage transformers and four lamps (Figure 8.1b), the relative sequence of SG phases to
power grid is checked. For direct voltage sequence, all four lamps brighten and dim simultaneously. For
the opposite sequence, the two groups of lamps brighten and dim one after the other.
8.1.7 A8: Telephone-Influence Factor (TIF)
TIF is measured for the SG alone, with the excitation supply replaced by a ripple-free supply. The step-
up transformers connected to SG terminals are disconnected. TIF is the ratio between the weighted root
mean squared (RMS) value of the SG no-load voltage fundamental plus harmonic
E
TIF
and the rms of
the fundamental
E
rms
:
FIGURE 8.1 Phase-sequence indicators: (a) independent (1–2–3 or 1–3–2) and (b) relative to power grid.
Neon
lamp
1
1
2
2
3
Neon
lamp
Power system
SG
∗
∗
∗
∗
∗
∗
∗
∗
Capacitor
Te st
switch
(a)
(b)
© 2006 by Taylor & Francis Group, LLC
Testing of Synchronous Generators 8-5
(8.2)
T
n
is the TIF weighting factor for the nth harmonic. If potential (voltage) transformers are used to reduce
the terminal voltage for measurements, care must be exercised to eliminate influences on the harmonics
content of the SG no-load voltage.
8.1.8 A9: Balanced Telephone-Influence Factor
For a definition, see IEEE standard 100-1992.
In essence, for a three-phase wye-connected stator, the TIF for two line voltages is measured at rated
speed and voltage on no-load conditions. The same factor may be computed (for wye connection) for
the line to neutral voltages, excluding the harmonics 3,6,9,12, ….
8.1.9 A10: Line-to-Neutral Telephone-Influence Factor
For machines connected in delta, a corner of delta may be open, at no load, rated speed, and rated
voltage. The TIF is calculated across the open delta corner:
(8.3)
Protection from accidental measured overvoltage is necessary, and usage of protection gap and fuses to
ground the instruments is recommended.
For machines that cannot be connected in delta, three identical potential transformers connected in
wye in the primary are open-delta connected in their secondaries. The neutral of the potential transformer
is connected to the SG neutral point.
All measurements are now made as above, but in the open-delta secondary of the potential transformers.
8.1.10 A11: Stator Terminal Voltage Waveform Deviation and
Distortion Factors
The line to neutral TIF is measured in the secondary of a potential transformer with its primary that is
connected between a SG phase terminal and its neutral points. A check of values balanced, residual, and
line to neutral TIFs is obtained from the following:
(8.4)
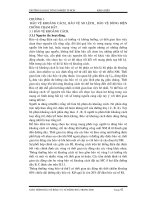
Definitions of deviation factor and distortion factor are given in IEEE standard 100-1992. In principle,
the no-load SG terminal voltage is acquired (recorded) with a digital scope (or digital data acquisition
system) at high speed, and only a half-period is retained (Figure 8.2).
The half-period time is divided into
J (at least 18) equal parts. The interval j is characterized by E
j
.
Consequently, the zero-to-peak amplitude of the equivalent sine wave
E
OM
is as follows:
(8.5)
TIF
E
E
TIF
rms
n
==
()
=
∞
∑
;E TE
TIF n n
1
Residual TIF
E
E
TIF opendelta
rms onephase
()
()
=
3
line to neutral TIF balanced TIF residu=+()(
2
aal TIF)
2
E
J
E
OM j
j
J
=
=
∑
2
2
1
© 2006 by Taylor & Francis Group, LLC
8-6 Synchronous Generators
A complete cycle is needed when even harmonics are present (fractionary windings). Waveform
analysis may be carried out by software codes to implement the above method. The maximum deviation
is
ΔE (Figure 8.2). Then, the deviation factor F
ΔEV
is as follows:
(8.6)
Any DC component
E
o
in the terminal voltage waveform has to be eliminated before completing
waveform analysis:
(8.7)
with
N equal to the samples per period.
When subtracting the DC component
E
o
from the waveform E
i
, E
j
is obtained:
(8.8)
The rms value
E
rms
is, thus,
(8.9)
The maximum deviation is searched for after the zero crossing points of the actual waveform and of
its fundamental are overlapped. A Fourier analysis of the voltage waveform is performed:
(8.10)
FIGURE 8.2 No-load voltage waveform for deviation factor.
0
E
j
E
OM
ΔE
180°
F
E
E
EV
OM
Δ
Δ
=
E
E
N
o
i
i
N
=
=
∑
1
EEE j N
jio
=− =…;1,,
E
N
EE E
rms j
j
n
OM rms
==
=
∑
1
2
2
1
;
a
N
E
nj
N
nj
j
n
=
=
∑
2
2
1
cos
π
b
N
E
nj
N
nj
j
n
=
=
∑
2
2
1
sin
π
Eab
nnn
=+
22
© 2006 by Taylor & Francis Group, LLC
Testing of Synchronous Generators 8-7
The distortion factor F
Δi
represents the ratio between the RMS harmonic content and the rms funda-
mental:
(8.11)
There are harmonic analyzers that directly output the distortion factor
F
Δi
. It should be mentioned
that
F
Δi
is limited by standards to rather small values, as detailed in Chapter 7 on SG design.
8.1.12 A12: Overspeed Tests
Overspeed tests are not mandatory but are performed upon request, especially for hydro or thermal
turbine-driven generators that experience transient overspeed upon loss of load. The SG has to be carefully
checked for mechanical integrity before overspeeding it by a motor (it could be the turbine [prime mover]).
If overspeeding above 115% is required, it is necessary to pause briefly at various speed steps to make
sure the machine is still OK. If the machine has to be excited, the level of excitation has to be reduced
to limit the terminal voltage at about 105%. Detailed inspection checks of the machine are recommended
after overspeeding and before starting it again.
8.1.13 A13: Line Charging Capacity
Line charging represents the SG reactive power capacity when at synchronism, at zero power factor, rated
voltage, and zero field current. In other words, the SG behaves as a reluctance generator at no load.
Approximately,
(8.12)
where
X
d
= the d axis synchronous reactance
V
ph
= the phase voltage (RMS)
The SG is driven at rated speed, while connected either to a no-load running overexcited synchronous
machine or to an infinite power source.
8.1.14 A14: Acoustic Noise
Airborne sound tests are given in IEEE standard 85-1973 and in ANSI standard C50.12-1982. Noise is
undesired sound. The duration in hours of human exposure per day to various noise levels is regulated
by health administration agencies.
An omnidirectional microphone with amplifier weighting filters, processing electronics, and an indi-
cating dial makes a sound-level measuring device. The ANSI “A” “B” “C” frequency domain is required
for noise control and its suppression according to pertinent standards.
φ
nnn
ba=
()
>
−
tan /
1
for a 0
n
φπ
nnn
ba=
()
+<
−
tan /
1
for a 0
n
F
E
E
i
n
n
rms
Δ
=
=
∞
∑
2
2
Q
V
X
ch e
ph
d
arg
≈
3
2
© 2006 by Taylor & Francis Group, LLC
8-8 Synchronous Generators
8.2 Testing for Performance (Saturation Curves, Segregated
Losses, Efficiency)
In large SGs, the efficiency is generally calculated based on segregated losses, measured in special tests
that avoid direct loading.
Individual losses are as follows:
• Windage and friction loss
• Core losses (on open circuit)
• Stray-load losses (on short-circuit)
• Stator (armature) winding loss: 3
I
s
2
R
a
with R
a
calculated at a specified temperature
• Field-winding loss I
fd
2
R
fd
with R
fd
calculated at a specified temperature
Among the widely accepted loss measurement methods, four are mentioned here:
• Separate drive method
• Electric input method
• Deceleration (retardation) method
• Heat transfer method
For the first three methods listed above, two tests are run: one with open circuit and the other with short-
circuit at SG terminals. In open-circuit tests, the windage-friction plus core losses plus field-winding
losses occur. In short-circuit tests, the stator-winding losses, windage-friction losses, and stray-load losses,
besides field-winding losses, are present.
During all these tests, the bearings temperature should be held constant. The coolant temperature,
humidity, and gas density should be known, and their appropriate influences on losses should be
considered. If a brushless exciter is used, its input power has to be known and subtracted from SG losses.
When the SG is driven by a prime mover that may not be uncoupled from the SG, the prime-mover
input and losses have to be known. In vertical shaft SGs with hydraulic turbine runners, only the thrust-
bearing loss corresponding to SG weight should be attributed to the SG.
Dewatering with runner seal cooling water shutoff of the hydraulic turbine generator is required.
Francis and propeller turbines may be dewatered at standstill and, generally, with the manufacturer’s
approval. To segregate open-circuit and short-circuit loss components, the no-load and short-circuit
saturation curves must also be obtained from measurements.
8.2.1 Separate Driving for Saturation Curves and Losses
If the speed can be controlled accurately, the SG prime mover can be used to drive the SG for open-
circuit and short-circuit tests, but only to determine the saturation open-circuit and short-circuit curves,
not to determine the loss measurements.
In general, a “separate” direct or through-belt gear coupled to the SG motor has to be used. If the
exciter is designed to act in this capacity, the best case is met. In general, the driving motor 3 to 5%
rating corresponds to the open-circuit test. For small- and medium-power SGs, a dynanometer driver is
adequate, as the torque and speed of the latter are measured, and thus, the input power to the tested SG
is known.
But today, when the torque and speed are estimated, in commercial direct-torque-controlled (DTC)
induction motor (IM) drives with PWM converters, the input to the SG for testing is also known, thereby
eliminating the dynamometer and providing for precise speed control (Figure 8.3).
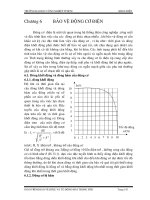
8.2.1.1 The Open-Circuit Saturation Curve
The open-circuit saturation curve is obtained when driving the SG at rated speed, on open circuit, and
acquiring the SG terminal voltage, frequency, and field current.
© 2006 by Taylor & Francis Group, LLC
Testing of Synchronous Generators 8-9
At least six readings below 60%, ten readings from 60 to 110%, two from 110 to 120%, and one at
about 120% of rated speed voltage are required. A monotonous increase in field current should be
observed. The step-up power transformer at SG terminals should be disconnected to avoid unintended
high-voltage operation (and excessive core losses) in the latter.
When the tests are performed at lower than rated speed (such as in hydraulic units), corrections for
frequency (speed) have to be made. A typical open-circuit saturation curve is shown in Figure 8.4. The
airgap line corresponds to the maximum slope from origin that is tangent to the saturation curve.
8.2.1.2 The Core Friction Windage Losses
The aggregated core, friction, and windage losses may be measured as the input power P
10
(Figure 8.3)
for each open-circuit voltage level reading. As the speed is kept constant, the windage and friction losses
FIGURE 8.3 Driving the synchronous generator for open-circuit and short-circuit tests.
FIGURE 8.4 Saturation curves.
PWM
converter
sensorless
DTC
(up to 2.5 MW)
1
2
Belt
IM
Estimated
torque
Estimated
speed
P
1
= T
e
w
r
/ p
1
Rating < 3–5% of SG rating
Open circuit: 1,2 open
Short circuit: 1,2 close
SG
T
ˆ
w
ˆ
1.4
1.0
0.7
0.3
1
E
1
V
n
⎯
I
sc3
I
n
V
1
(I
f
)
⎯
I
f
I
fn
⎯
Airgap line
Open circuit E1 (I
1
)
Short circuit saturation
Zero PF rated current saturation
© 2006 by Taylor & Francis Group, LLC
8-10 Synchronous Generators
are constant (P
fw
= constant). Only the core losses P
core
increase approximately with voltage squared
(Figure 8.5).
8.2.1.3 The Short-Circuit Saturation Curve
The SG is driven at rated speed with short-circuited armature, while acquiring the stator and field currents
I
sc
and I
f
. Values should be read at rated 25%, 50%, 75%, and 100%. Data at 125% rated current should
be given by the manufacturer, to avoid overheating the stator. The high current points should be taken first
so that the temperature during testing stays almost constant. The short-circuit saturation curve (Figure 8.4)
is a rather straight line, as expected, because the machine is unsaturated during steady-state short-circuit.
8.2.1.4 The Short-Circuit and Strayload Losses
At each value of short-circuit stator current, I
sc
, the input power to the tested SG (or the output power
of the drive motor) P
1sc
is measured. Their power contains the friction, windage losses, the stator winding
DC losses (3I
sc3
2
R
adc
), and the strayload loss P
stray
load (Figure 8.6):
(8.13)
During the tests, it may happen that the friction windage loss is modified because temperature rises.
For a specified time interval, an open-circuit test with zero field current is performed, when the whole
loss is the friction windage loss (P
10
= P
fw
). If P
fw
varies by more than 10%, corrections have to be made
for successive tests.
Advantage may be taken of the presence of the driving motor (rated at less than 5% SG ratings) to
run zero-power load tests at rated current and measure the field current I
f
, terminal voltage V
1
; from
rated voltage downward.
A variable reactance is required to load the SG at zero power factor. A running, underexcited synchro-
nous machine (SM) may constitute such a reactance, made variable through its field current. Adjusting
the field current of the SG and SM leads to voltage increasing points on the zero power factor saturation
curve (Figure 8.4).
8.2.2 Electric Input (Idle-Motoring) Method for Saturation Curves and Losses
According to this method, the SG performs as an unloaded synchronous motor supplied from a variable
voltage constant frequency power rating supply. Though standards indicate to conduct these tests at rated
FIGURE 8.5 Core (P
core
) and friction windage (P
fw
) losses vs. armature voltage squared at constant speed.
P
fw
+ P
core
P
core
P
fw
0.1 1
2
V
1
V
n
⎯
PP IRP
isc fw sc sdc strayload
=+ +3
3
2
© 2006 by Taylor & Francis Group, LLC
Testing of Synchronous Generators 8-11
speed only, there are generators that also work as motors. Gas-turbine generators with bidirectional static
converters that use variable speed for generation and turbine starting as a motor are a typical example.
The availability of PWM static converters with close to sinusoidal current waveforms recommends them
for the no-load motoring of SG. Alternatively, a nearly lower rating SG (below 3% of SG rating) may
provide for the variable voltage supply.
The testing scheme for the electric input method is described in Figure 8.7.
When supplied from the PWM static converter, the SG acting as an idling motor is accelerated to the
desired speed by a sensorless control system. The tested machine is vector controlled; thus, it is “in
synchronism” at all speeds.
In contrast, when the power supply is a nearby SG, the tested SG is started either as an asynchronous
motor or by accelerating the power supply generator simultaneously with the tested machine. Suppose
that the SG was brought to rated speed and acts as a no-load motor. To segregate the no-load loss
components, the idling motor is supplied with descending stator voltage and descending field current so
FIGURE 8.6 Short-circuit test losses breakdown.
FIGURE 8.7 Idle motoring test for loss segregation and open-circuit saturation curve.
Power loss
P
isc
P
fw
1
Rated
current
I
sc3
2
R
sdc
P
strayload
I
sc3
I
n
⎯
ac-dc variable
voltage supply
SG
as
idling motor
Power
analyzer
V, I, P, f
1
+
3~
3~
3~
3~
or
Variable
voltage
Prime
mover
PWM static
converter:
variable voltage
and frequency
SG
−
− +
ac-dc variable
voltage supply
© 2006 by Taylor & Francis Group, LLC
8-12 Synchronous Generators
as to keep unity power factor conditions (minimum stator current). The loss components of (input
electric power) P
om
are as follows:
(8.14)
The stator winding loss P
cu10
is
(8.15)
and may be subtracted from the electric input P
om
(Figure 8.8).
There is a minimum stator voltage V
1min
, at unity power factor, for which the idling synchronous motor
remains at synchronism. The difference P
om
– P
cu10
is represented in Figure 8.8 as a function of voltage
squared to underscore the core loss almost proportionally to voltage squared at given frequency (or to
V/f in general) A straight line is obtained through curve fitting. This straight line is prolonged to the
vertical axis, and thus, the mechanical loss P
fw
is obtained. So, the P
core
and P
fw
were segregated. The open-
circuit saturation curve may be obtained as a bonus (down to 30% rated voltage) by neglecting the voltage
drop over the synchronous reactance (current is small) and over the stator resistance, which is even
smaller. Moreover, if the synchronous reactance X
s
(an “average” of X
d
and X
q
) is known from design
data, at unity power factor, the no-load voltage (the electromagnetic field [emf] E
1
) is
(8.16)
The precision in E
1
is thus improved, and the obtained open-circuit saturation curve, E
1
(I
f
), is more
reliable. The initial 30% part of the open-circuit saturation curve is drawn as the airgap line (the tangent
through origin to the measured open-circuit magnetic curve section). To determine the short-circuit and
strayload losses, the idling motor is left to run at about 30% voltage (and at an even lower value, but for
stable operation). By controlling the field current at this low, but constant, voltage, about six current
step measurements are made from 125 to 25% of rated stator current. At least two points with very low
stator current are also required. Again, total losses for this idling test are
(8.17)
FIGURE 8.8 Loss segregation for idle-running motor testing.
E
1
120
105
90
75
60
45
30
15
E
1
Power (W)
P
om
P
cu10
P
core
P
fw
0.1 0.2 1 2
% V
10
V
10
V
1min
I
F
2
V
1
V
n
⎯
2
V
1min
V
n
⎯
0
PP P P
om cu coreo fw
=++
10
PRI
cu adc o10
2
3=
EVRIXI
ao s o11
222
≈−
()
+
PPPPP
om
lowvoltage
fw core cu strayload
()
=+ ++
1
© 2006 by Taylor & Francis Group, LLC
Testing of Synchronous Generators 8-13
This time, the test is done at constant voltage, but the field current is decreased to increase the stator
current up to 125%. So, the strayload losses become important. As the field current is reduced, the power
factor decreases, so care must be exercised to measure the input electric power with good precision. As
the P
fw
loss is already known from the previous testing, speed is constant, P
core
is known from the same
source at the same low voltage at unity power factor conditions, and only P
core
+ P
strayload
have to be
determined as a function of stator current.
Additionally, the dependence of I
a
on I
f
may be plotted from this low-voltage test (Figure 8.9). The
intersection of this curve side with the abscissa delivers the field current that corresponds to the testing
voltage V
1min
on the open-circuit magnetization curve. The short-circuit saturation curve is just parallel
to the V curve side I
a
(I
f
) (see Figure 8.10).
We may conclude that both separate driving and electric power input tests allow for the segregation
of all loss components in the machine and thus provide for the SG conventional efficiency computation:
FIGURE 8.9 P
cu1
+ P
strayload
.
FIGURE 8.10 V curve at low voltage V
1min
(1), open-circuit saturation curve (2), short-circuit saturation curve (3).
P
cu1
+
P
cu1
= 3R
adc
I
a
2
P
strayload
0.25 1 1.25
P
strayload
V
1
= 0.3 V
n
f
1
= f
n
I
a
I
n
⎯
I
a
I
f
E
1
V curve
side
V
1min
1
3
2
η
c
PP
P
=
−
∑
1
1
© 2006 by Taylor & Francis Group, LLC
8-14 Synchronous Generators
(8.18)
The rated stator-winding loss P
cu1
and the rated stray-load loss P
strayload
are determined in short-circuit
tests at rated current, while P
core
is determined from the open-circuit test at rated voltage. It is disputable
if the core losses calculated in the no-load test and strayload losses from the short-circuit test are the
same when the SG operates on loads of various active and reactive power levels.
8.2.3 Retardation (Free Deceleration Tests)
In essence, after the SG operates as an uncoupled motor at steady state to reach normal temperatures,
its speed is raised at 110% speed. Evidently, a separate SG supply capable of producing 110% rated
frequency is required. Alternatively, a lower rated PWM converter may be used to supply the SG to slowly
accelerate the SG as a motor. Then, the source is disconnected. The prime mover of the SG was decoupled
or “dewatered.”
The deceleration tests are performed with I
f
, I
a
= 0, then with I
f
≠ 0, I
a
= 0 (open circuit), and,
respectively, for I
f
= constant, and V
1
= 0 (short-circuit). In the three cases, the motion equation leads to
the following:
(8.19)
The speed vs. time during deceleration is measured, but its derivation with time has to be estimated
through an adequate digital filter to secure a smooth signal.
Provided the inertia J is a priori known, at about rated speed, the speed ω
rn
and its derivative dω
r
/dt
are acquired and used to calculate the losses for that rated speed, as shown on the right side of Equation
8.19 (Figure 8.11).
FIGURE 8.11 Retardation tests.
PP P P
I
I
P
I
I
fw core cu
a
n
strayload
a
n
∑
=+ +
⎛
⎝
⎜
⎞
⎠
⎟
+
1
2
⎛⎛
⎝
⎜
⎞
⎠
⎟
+
2
RI
fd F
J
pp
d
dt
d
dt
J
p
rr r
11 1
2
2
ωω ω
⎛
⎝
⎜
⎞
⎠
⎟
=
⎛
⎝
⎜
⎞
⎠
⎟
⎡
⎣
⎢
⎢
⎤
⎦
⎥
⎥
==−
()
=−
()
−
()
=−
()
−
P
PP
PI P
fw r
fw r core r
sc sc f
ω
ωω
3 wwr
ω
()
1.1
1
t
Short circuit
Open circuit
Open circuit with
zero field current
n(t)
n
n
⎯
© 2006 by Taylor & Francis Group, LLC
Testing of Synchronous Generators 8-15
With the retardation tests done at various field current levels, respectively, at different values of short-
circuit current, at rated speed, the dependence of E
1
(I
F
), P
core
(I
F
), and P
sc
(I
sc3
) may be obtained. Also,
(8.20)
In this way, the open-circuit saturation curve E
1
(I
f
) is obtained, provided the terminal voltage is also
acquired. Note that if the SG is excited from its exciter (brushless, in general), care must be exercised to
keep the excitation current constant, and the exciter input power should be deducted from losses.
If overspeeding is not permitted, the data are collected at lower than rated speed with the losses
corrected to rated speed (frequency). A tachometer, a speed recorder, or a frequency digital electronic
detector may be used.
As already pointed out, the inertia J has to be known a priori for retardation tests. Inertia may be
computed by using a number of methods, including through computation by manufacturer or from
Equation 8.19, provided the friction and windage loss at rated speed P
fw
(ω
rn
) are already known. With
the same test set, the SG is run as an idling motor at rated speed and voltage for unity power factor
(minimum current). Subtracting from input powers the stator winding loss, P
fw
+ P
core
,
corresponding
to no load at the same field current, I
f
is obtained. Then, Equation 8.19 is used again to obtain J.
Finally, the physical pendulum method may be applied to calculate J (see IEEE standard 115-1995,
paragraph 4.4.15).
For SGs with closed-loop water coolers, the calorimetric method may be used to directly measure the
losses. Finally, the efficiency may be calculated from the measured output to measured input to SG. This
direct approach is suitable for low- and medium-power SGs that can be fully loaded by the manufacturer
to directly measure the input and output with good precision (less than 0.1 to 0.2%).
8.3 Excitation Current under Load and Voltage Regulation
The excitation (field) current required to operate the SG at rated steady-state active power, power factor,
and voltage is a paramount factor in the thermal design of a machine.
Two essentially graphical methods — the Potier reactance and the partial saturation curves — were
introduced in Chapter 7 on design. Here we will treat, basically, in more detail, variants of the Potier
reactance method.
To determine the excitation current under specified load conditions, the Potier (or leakage) reactance
X
p
, the unsaturated d and q reactance X
du
and X
qu
, armature resistance R
a
, and the open-circuit saturation
curve are needed. Methods for determining the Potier and leakage reactance are given first.
8.3.1 The Armature Leakage Reactance
We can safely say that there is not yet a widely accepted (standardized) direct method with which to
measure the stator leakage (reactance) of SGs. To the valuable heritage of analytical expressions for the
various components of X
l
(see Chapter 7), finite element method (FEM) calculation procedures were
added [2, 3].
The stator leakage inductance may be calculated by subtracting two measured inductances:
(8.21)
(8.22)
PI RI P I
sc sc adc sc strayload sc33
2
3
3
()
=+
()
LL L
lduadu
=−
LL
N
L
V
I
adu afdu
af
afdu
n
nf
=⋅⋅ =
2
3
12
3
;
ω
ddbase
© 2006 by Taylor & Francis Group, LLC
8-16 Synchronous Generators
where L
du
is the unsaturated axis synchronous inductance, and L
adu
is the stator to field circuit mutual
inductance reduced to the stator. L
afdu
is the same mutual inductance but before reduction to stator. I
fd
(base value) is the field current that produces, on the airgap straight line, the rated stator voltage on the
open stator circuit. Finally, N
af
is the field-to-armature equivalent turn ratio that may be extracted from
design data or measured as shown later in this chapter.
The N
af
ratio may be directly calculated from design data as follows:
(8.23)
where i
fdbase
, I
fdbase
, and I
abase
are in amperes, but l
adu
is in P.U.
A method to directly measure the leakage inductance (reactance) is given in the literature [4]. The
reduction of the Potier reactance when the terminal voltage increases is documented in Reference [4]. A
simpler approach to estimate X
l
would be to average homopolar reactance X
o
and reactance of the machine
without the rotor in place, X
lair
:
(8.24)
In general, X
o
< X
l
and X
lair
> X
l
, so an average of them seems realistic.
Alternatively,
(8.25)
X
air
represents the reactance of the magnetic field that is closed through the stator bore when the rotor
is not in place. From two-dimensional field analysis, it was found that X
air
corresponds to an equivalent
airgap of τ/π (axial flux lines are neglected):
(8.26)
where
τ = the pole pitch
g = the airgap
l
i
= the stator stack length
K
ad
= L
adu
/L
mu
> 0.9 (see Chapter 7)
The measurement of X
o
will be presented later in this chapter, while X
lair
may be measured through a
three-phase AC test at a low voltage level, with the rotor out of place. As expected, magnetic saturation
is not present when measuring X
o
and X
lair
. In reality, for large values of stator currents and for very high
levels of magnetic saturation of stator teeth or rotor pole, the leakage flux paths get saturated, and X
l
slightly decreases. FEM inquiries [2, 3] suggest that such a phenomenon is notable.
When identifying the machine model under various conditions, a rather realistic, even though not
exact, value of leakage reactance is a priori given. The above methods may serve this purpose well, as
saturation will be accounted for through other components of the machine model.
8.3.2 The Potier Reactance
Difficulties in measuring the leakage reactance led, shortly after the year 1900, to an introduction by
Potier of an alternative reactance (Potier reactance) that can be measured from the zero-power-factor
N
IA
iA
i
af
abase
fd base
fdbase
=
()
()
()
3
2
; ==⋅Il
fdbase adu
X
XX
l
olair
≈
+
()
2
XX X
llairair
≈−
X
Wkw l
p
L
K
g
air
oi
adu
ad
=
()
()
≅⋅
6
111
2
2
1
1
μω τ
πτπ
ω
π
/
KK
c
τ
⎛
⎝
⎜
⎞
⎠
⎟
© 2006 by Taylor & Francis Group, LLC
Testing of Synchronous Generators 8-17
load tests, at given stator voltage. At rated voltage tests, the Potier reactance X
p
may be larger than the
actual leakage reactance by as much as 20 to 30%.
The open-circuit saturation and zero-power-factor rated current saturation curves are required to
determine the value of X
p
(Figure 8.12).
At rated voltage level, the segment a′d′ = ad is marked. A parallel to the airgap line through a′ intersects
the open-circuit saturation curve at point b′. The segment b′c′ is as follows:
(8.27)
It is argued that the value of X
p
obtained at rated voltage level may be notably larger than the leakage
reactance X
l
, at least for salient-pole rotor SGs. A simple way to correct this situation is to apply the same
method but at a higher level of voltage, where the level of saturation is higher, and thus, the seg-
ment and < X
p
and, approximately,
(8.28)
It is not yet clear what overvoltage level can be considered, but less than 110% is feasible if the SG
may be run at such overvoltage without excessive overheating, even if only for obtaining the zero-power-
factor saturation curve up to 110%.
When the synchronous machine is operated as an SG on full load, other methods to calculate X
p
from
measurements are applicable [1].
8.3.3 Excitation Current for Specified Load
The excitation field current for specified electric load conditions (voltage, current, power factor) may be
calculated by using the phasor diagram (Figure 8.13).
For given stator current I
a
, terminal voltage E
a
, and power factor angle ϕ, the power angle δ may be
calculated from the phasor diagram as follows:
FIGURE 8.12 Potier reactance from zero power factor saturation curve.
V
V
base
⎯
1.25
1
b″
a″
c″
X
p
I
a
X
I
I
a
d″
b′
a′
ab = a′b′ = a″b″
a′b′, a″b″ // to
the airgap line
c′ d′
d
a
b
0.75
P.U. stator voltage
P.U. field current
0.5
0.25
0.5 1.0 1.5 2.0 2.5 3.0 3.5
Z
ero PF estimation at rated
I
a
Open circuit
saturation curve
Airgap line
⎯⎯ ⎯
′′
=bc X I
pa
′′ ′′
<
′′
bc bc
′
X
p
XX
bc
I
lp
a
≈
′
≈
′′ ′′
© 2006 by Taylor & Francis Group, LLC
8-18 Synchronous Generators
(8.29)
(8.30)
Once the power angle is calculated, for given unsaturated reactances X
du
, X
qu
and stator resistance, the
computation of voltages E
QD
and E
Gu
, with the machine considered as unsaturated, is feasible:
(8.31)
(8.32)
Corresponding to E
Gu
, from the open-circuit saturation curve (Figure 8.13), the excitation current I
FU
is found. The voltage back of Potier reactance E
p
is simply as follows (Figure 8.13):
(8.33)
The excitation current under saturated conditions that produces E
p
along the open-circuit saturation
curve, is as follows (Figure 8.13):
(8.34)
The “saturation” field current supplement is I
FS
. The field current I
F
corresponds to the saturated machine
and is the excitation current under specified load. This information is crucial for the thermal design of
SG. The procedure is similar for the cylindrical rotor machine, where the difference between X
du
and X
qu
is small (less than 10%). For variants of this method see Reference [1].
All methods in Reference [1] have in common a critical simplification: the magnetic saturation
influence is the same in axes d and q, while the power angle δ calculated with unsaturated reactance X
qu
FIGURE 8.13 Phasor diagram with unsaturated reactances X
du
and X
qu
and the open-circuit saturation curve. E
a
is
the terminal phase voltage; δ is the power angle; I
a
is the terminal phase current; ϕ is the power factor angle; E
as
is
the voltage back of X
qu
; R
a
is the stator phase resistance; and E
Gu
is the voltage back of X
du
.
I
d
d axis
q axis
1.3
1.2
P.U. voltage
1.1
1
0.9
0.8
0.7
0.6
0.5
0.5 0.75 1
1.25
1.5 1.75
2
Per unit field current
I
a
E
a
E
p
jI
a
X
p
jI
a
X
qu
jI
q
X
qu
jI
d
X
du
jI
q
δ
ϕ
I
FS
I
FG
I
Fu
I
f
E
GU
E
P
δ
ϕϕ
ϕ
=
+
++
−
tan
sin cos
cos s
1
IR IX
EIR IX
aa a qu
aaa aqu
iin ϕ
⎡
⎣
⎢
⎢
⎤
⎦
⎥
⎥
II II
da qa
=+
()
=+
()
sin cosδϕ δϕ;
EERIjIXjXX
Gu
asa qqu ddu
=+ + +
EERI XI
Gu a a a du a
=+
()
++
()
cos sinδδϕ
EERIjXI
EE IXE I
pa
s
a
p
a
pa apa a
=+ +
=+
()
++sin cosϕϕ
2
RR
a
()
2
II I
FFuFS
=+
© 2006 by Taylor & Francis Group, LLC
Testing of Synchronous Generators 8-19
is considered to hold for all load conditions. The reality of saturation is much more complicated, but
these simplifications are still widely accepted, as they apparently allowed for acceptable results so far.
The consideration of different magnetization curves along axes d and q, even for cylindrical rotors,
and the presence of cross-coupling saturation were discussed in Chapter 7 on design, via the partial
magnetization curve method. This is not the only approach to the computation of excitation current
under load in a saturated SG, and new simplified methods to account for saturation under steady state
are being produced [5].
8.3.4 Excitation Current for Stability Studies
When investigating stability, the torque during transients is mandatory. Its formula is still as follows:
(8.35)
When damping windings effects are neglected, the transient model and phasor diagram may be used,
with X
d
′ replacing X
d
, while X
q
holds steady (Figure 8.14).
As seen from Figure 8.14, the total open-circuit voltage E
total
, which defines the required field current
I
ftotal
, is
(8.36)
(8.37)
This time, at the level of E
q
′ (rather than E
p
), the saturation increment in excitation (in P.U.), ΔX
adu
*I
fd
,
is determined from the open-circuit saturation curve (Figure 8.14). The nonreciprocal system (Equation
8.23) is used in P.U. It is again obvious that the difference in saturation levels in the d and q axes is
neglected. The voltage regulation is the relative difference between the no-load voltage E
total
(Figure 8.14)
corresponding to the excitation current under load, and the SG rated terminal voltage E
an
:
(8.38)
8.3.5 Temperature Tests
When determining the temperature rise of various points in an SG, it is crucial to check its capability to
deliver load power according to specifications. The temperature rise is calculated with respect to a
FIGURE 8.14 The transient model phasor diagram.
E
p
E
q
ʹ
E
q
ʹ
E
GU
Airgap line
I
fd
(P.U.)
ΔX
adu
I
fd
E
total
Voltage (P.U.)
E
i
jI
d
(X
du
− X
d
ʹ)
E
a
I
a
I
d
jI
q
jI
a
X
q
δ
ϕ
ΔX
adu
I
fd
jI
a
X
d
ʹ
TII
edqqd
=−ΨΨ
EEXXIXI
total q du d d adu fd
=
′
+−
′
()
+
′
=+
′
+
()
EE IX
qa ad
cos sinδδϕ
voltage regulation
E
E
total
an
=−1
© 2006 by Taylor & Francis Group, LLC
8-20 Synchronous Generators
reference temperature. Coolant temperature is now a widely accepted reference temperature. A temper-
ature rise at one (rated) or more specified load levels is required from temperature tests. When possible,
direct loading should be applied to do temperature testing, either at the manufacturer’s or at the user’s
site. Four common temperature testing methods are described here:
• Conventional (direct) loading
• Synchronous feedback (back-to-back motor [M] + generator [G]) loading
• Zero-power-factor load test
• Open-circuit and short-circuit loading
8.3.5.1 Conventional Loading
The SG is loaded for specified conditions of voltage, frequency, active power, armature current, and field
current (the voltage regulator is disengaged). The machine terminal voltage should be maintained within
±2% of rated value. If so, the temperature increases of different parts of the machine may be plotted vs.
P.U. squared apparent power (MVA)
2
. As the voltage-dependent and current-dependent losses are gen-
erally unequal, the stator-winding temperature rise may be plotted vs. armature current squared (A
2
),
while the field-winding temperature can be plotted vs. field-winding dissipated power:
Linear dependencies are expected. If temperature testing is to be done before com-
missioning the SG, then the last three methods listed above are to be used.
8.3.5.2 Synchronous Feedback (Back-to-Back) Loading Testing
Two identical SGs are coupled together with their rotor axes shifted with respect to each other by twice
the rated power angle (2δ
n
). They are driven to rated speed before connecting their stators (C
1
-open)
(Figure 8.15).
Then, the excitation of both machines is raised until both SMs show the same rated voltage. With
the synchronization conditions met, the power switch C
1
is closed. Further on, the excitation of one of
the two identical machines is reduced. That machine becomes a motor and the other a generator. Then,
simultaneously, SM excitation current is reduced and that of the SG is increased to keep the terminal
voltage at rated value. The current between the two machines increases until the excitation current of
the SG reaches its rated value, by now known for rated power, voltage, cos ϕ. The speed is maintained
constant through all these arrangements. The net output power of the driving motor covers the losses
of the two identical synchronous machines, 2Σ
p
, but the power exchanged between the two machines
is the rated power P
n
and can be measured. So, even the rated efficiency can be calculated, besides
offering adequate loading for temperature tests by taking measurements every half hour until temper-
atures stabilize.
Two identical machines are required for this arrangement, along with the lower (6%) rating driving
motor and its coupling. It is possible to use only the SM and SG, with SM driving the set, but then the
local power connectors have to be sized to the full rating of the tested machines.
FIGURE 8.15 Back-to-back loading.
SM
SG
Driving
motor (low
rating)
C
1
+ −
+ −
d
n
d
n
PRikW
exe F F
=
2
().
© 2006 by Taylor & Francis Group, LLC
Testing of Synchronous Generators 8-21
8.3.5.3 Zero-Power-Factor Load Test
The SG works as a synchronous motor uncoupled at the shaft, that is, a synchronous condenser (S.CON).
As the active power drawn from the power grid is equal to SM losses, the method is energy efficient.
There are, however, two problems:
• Starting and synchronizing the SM to the power source
• Making sure that the losses in the S.CON equal the losses in the SG at specified load conditions
Starting may be done through an existing SG supply that is accelerated in the same time with the SM,
up to the rated speed. A synchronous motor starting may be used instead. To adjust the stator winding,
core losses, and field-winding losses, for a given speed, and to provide for the rated mechanical losses,
the supply voltage (E
a
)
S.CON
and the field current may be adjusted.
In essence, the voltage (E
p
)
S.CON
has to provide the same voltage behind Potier reactance with the
S.CON as with the voltage E
a
of SG at a specified load (Figure 8.16):
(8.39)
There are two more problems with this otherwise good test method for heating. One problem is the
necessity of the variable voltage source at the level of the rated current of the SG. The second is related
to the danger of too high a temperature in the field winding in SGs designed for larger than 0.9 rated
power factor. The high level of E
p
in the SG tests claims too large a field current (larger than for the rated
load in the SG design).
Other adjustments have to be made for refined loss equivalence, such that the temperature rise is close
to that in the actual SG at specified (rated load) conditions.
8.3.5.4 Open-Circuit and Short-Circuit “Loading”
As elaborated upon in Chapter 7 on design, the total loss of the SG under load is obtained by adding
the open-circuit losses at rated voltage and the short-circuit loss at rated current and correcting for
duplication of heating due to windage losses.
In other words, the open-circuit and short-circuit tests are done sequentially, and the overtemperatures
Δt
t
= (Δt)
opencircuit
and Δt
sc
are added, while subtracting the additional temperature rise due to duplication
of mechanical losses Δt
w
:
FIGURE 8.16 Equalizing the voltage back of Potier reactance for synchronous condenser and synchronous generator
operation modes.
(E
a
)
SC
(E
a
)
SC
< (E
a
)
SG
(E
p
)
S.CON
(E
p
)
SG
(E
a
)
SG
jX
s
(I
a
)
base
jX
p
(I
a
)
base
(I
a
)
base
EE
p
SCON
p
SG
()
=
()
.
© 2006 by Taylor & Francis Group, LLC
8-22 Synchronous Generators
(8.40)
The temperature rise (Δt)
w
due to windage losses may be determined by a zero excitation open-circuit
run. For more details on practical temperature tests, see Reference [1].
8.4 The Need for Determining Electrical Parameters
Prior to the period from 1945 to 1965, SG transient and subtransient parameters were developed and
used to determine balanced and unbalanced fault currents. For stability response, a constant voltage
back-transient reactance model was applied in the same period.
The development of power electronics controlled exciters led, after 1965, to high initial excitation
response. Considerably more sophisticated SG and excitation control systems models became necessary.
Time-domain digital simulation tools were developed, and small-signal linear eigenvalue analysis became
the norm in SG stability and control studies. Besides second-order (two rotor circuits in parallel along
each orthogonal axis) SG models, third and higher rotor order models were developed to accommodate
the wider frequency spectrum encountered by some power electronics excitation systems. These practical
requirements led to the IEEE standard 115A-1987 on standstill frequency testing to deal with third rotor
order SG model identification.
Tests to determine the SG parameters for steady states and for transients were developed and stan-
dardized since 1965 at a rather high pace. Steady-state parameters — X
d
, unsaturated (X
du
) and saturated
(X
ds
), and X
q
, unsaturated (X
qu
) and saturated (X
qs
) — are required first in order to compute the active
and reactive power delivered by the SG at given power angle, voltage, armature current, and field current.
The field current required for given active, reactive powers, power factor, and voltage, as described in
previous paragraphs, is necessary in order to calculate the maximum reactive power that the SG can deliver
within given (rated) temperature constraints. The line-charging maximum-absorbed reactive power of the
SG at zero power factor (zero active power) is also calculated based on steady-state parameters.
Load flow studies are based on steady-state parameters as influenced by magnetic saturation and
temperature (resistances R
a
and R
f
). The subtransient and transient parameters
determined by processing the three-phase short-circuit tests, are generally used to study
the power system protection and circuit-breaker fault interruption requirements. The magnetic saturation
influence on these parameters is also needed for better precision when they are applied at rated voltage
and higher current conditions. Empirical corrections for saturation are still the norm.
Standstill frequency response (SSFR) tests are mainly used to determine third-order rotor model sub-
subtransient, subtransient, and transient reactances and time constraints at low values of stator current
(0.5% of rated current). They may be identified through various regression methods, and some have
been shown to fit well the SSFR from 0.001 Hz to 200 Hz. Such a broad frequency spectrum occurs in
very few transients. Also, the transients occur at rather high and variable local saturation levels in the SG.
In just how many real-life SG transients are such advanced SSFR methods a must is not yet very clear.
However, when lower frequency band response is required, SSFR results may be used to produce the
best-fit transient parameters for that limited frequency band, through the same regression methods.
The validation of these advanced third (or higher) rotor order models in most important real-time
transients led to the use of similar regression methods to identify the SG transient parameters from online
admissible (provoked) transients. Such a transient is a 30% variation of excitation voltage. Limited
frequency range oscillations of the exciter’s voltage may also be performed to identify SG models valid
for on-load transients, a posteriori.
The limits of short-circuit tests or SSFR taken separately appear clearly in such situations, and their
combination to identify SG models is one more way to better the SG modeling for on-load transients.
As all parameter estimation methods use P.U. values, we will revisit them here in the standardized form.
ΔΔ Δ Δtt t t
t
opencircuit shortcircuit w
=
()
+
()
−
()
(, ,,, ,
′′ ′ ′′ ′ ′′
XXTTX
d ddd q
′′′′′′′
XTTT
qddq
,,,),
000
© 2006 by Taylor & Francis Group, LLC
Testing of Synchronous Generators 8-23
8.5 Per Unit Values
Voltages, currents, powers, torque, reactances, inductances, and resistances are required, in general, to
be expressed in per unit (P.U.) values with the inertia and time constants left in seconds. Per-unitization
has to be consistent. In general, three base quantities are selected, while the others are derived from the
latter. The three commonly used quantities are three-phase base power, S
NΔ
, line-to-line base terminal
voltage E
NΔ
, and base frequency, f
N
.
To express a measurable physical quantity in P.U., its physical value is divided by the pertinent base
value expressed in the same units. Conversion of a P.U. quantity to a new base is done by multiplying
the old P.U. value by the ratio of the old to the new base quantity. The three-phase power S
NΔ
of an SG
is taken as its rated kilovoltampere (kVA) (or megavoltampere [MVA]) output (apparent power).
The single-phase base power S
N
is S
N
= S
NΔ
/3.
Base voltage is the rated line-to-neutral voltage E
N
:
(8.41)
RMS quantities are used.
When sinusoidal balanced operation is considered, the P.U. value of the line-to-line and of the phase-
neutral voltages is the same. Baseline current I
N
is that value of stator current that corresponds to rated
(base) power at rated (base) voltage:
(8.42)
For delta-connected SGs, the phase base current I
NΔ
is as follows:
(8.43)
The base impedance Z
N
is
(8.44)
The base impedance corresponds to the balanced load phase impedance at SG terminals that requires the
rated current I
N
at rated (base) line to neutral (base) voltage E
N
. Note that, in some cases, the field-circuit-
based impedance Z
fdbase
is defined in a different way (Z
N
is abandoned for the field-circuit P.U. quantities):
(8.45)
I
fdbase
is the field current in amperes required to induce, at stator terminals, on an open-circuit straight
line, the P.U. voltage E
a
:
E
E
EE
N
N
NLL
=
()
=
Δ
Δ
3
V,kV ;
I
S
V
S
E
SS
N
N
N
N
N
NN
==
()
=
Δ
Δ
Δ
3
3A; /
I
S
E
EE
N
N
N
NNΔ
Δ
Δ
Δ
==
3
as
Z
E
I
E
S
E
S
N
N
N
N
N
N
N
== =
22
Δ
Δ
Z
S
I
S
I
fbase
N
fdbase
N
fdbase
=
()
=
()
Δ
3
© 2006 by Taylor & Francis Group, LLC
8-24 Synchronous Generators
(8.46)
where
I
a
= the P.U. value of stator current I
N
X
adu
= the mutual P.U. reactance between the armature winding and field winding on the base Z
N
In general,
(8.47)
where
X
du
= the unsaturated d axis reactance
X
l
= the leakage reactance
The direct addition of terms in Equation 8.47 indicates that X
adu
is already reduced to the stator. Rankin
[6] designated i
fdbase
as the reciprocal system.
In the conventional (nonreciprocal) system, the base current of the field winding I
fdbase
corresponds to
the 1.0 P.U. volts E
a
on an open-circuit straight line:
(8.48)
The Rankin’s system is characterized by equal stator/field and field/stator mutual reactances in P.U.
values.
The correspondence between i
fdbase
and I
fdbase
is shown graphically in Figure 8.17.
All rotor quantities, such as field-winding voltage, reactance, and resistance, are expressed in P.U.
values according to either the conventional (I
fdbase
) or to the reciprocal (i
fdbase
) field current base quantity.
The base frequency is the rated frequency f
N
. Sometimes, the time also has a base value t
N
= 1/f
N
. The
theoretical foundations and the definitions behind expressions of SG parameters for steady-state and
transient conditions were described in Chapter 5 and Chapter 6. Here, they will be recalled at the moment
of utilization.
FIGURE 8.17 I
fdbase
and i
fdbase
base field current definitions.
EXI
aadua
P.U. P.U. P.U.
()
=
()()
XX X
du adu l
=+
iIX
fdbase fdbase dau
=
E
a
I
fdbase
i
fdbase
E
a
(P.U.) = X
adu
(P.U.)
Field current (A)
1.6
1.4
1.2
1
0.8
0.6
0.4
0.2
© 2006 by Taylor & Francis Group, LLC
Testing of Synchronous Generators 8-25
8.6 Tests for Parameters under Steady State
Steady-state operation of a three-phase SG usually takes place under balanced load conditions. That is,
phase currents are equal in amplitude but dephased by 120° with each other. There are, however, situations
when the SG has to operate under unbalanced steady-state conditions. As already detailed in Chapter 5
(on steady-state performance), unbalanced operation may be described through the method of symmet-
rical components. The steady-state reactances X
d
, X
q
, or X
1
, correspond to positive symmetrical compo-
nents: X
2
for the negative and X
o
for the zero components. Together with direct sequence parameters for
transients, X
2
and X
o
enter the expressions of generator current under unbalanced transients.
In essence, the tests that follow are designed for three-phase SGs, but with some adaptations, they
may also be used for single-phase generators. However, this latter case will be treated separately in Chapter
12 in Variable Speed Generators, on small power single-phase linear motion generators.
The parameters to be measured for steady-state modeling of an SG are as follows:
• X
du
is the unsaturated direct axis reactance
• X
ds
is the saturated direct axis reactance dependent on SG voltage, power (in MVA), and power
factor
• X
adu
is the unsaturated direct axis mutual (stator to excitation) reactance already reduced to the
stator (X
du
= X
adu
+ X
l
)
• X
l
is the stator leakage reactance
• X
ads
is the saturated (main flux) direct axis magnetization reactance (X
ds
= X
ads
+ X
l
)
• X
qu
is the unsaturated quadrature axis reactance
• X
qs
is the saturated quadrature axis reactance
• X
aqs
is the saturated quadrature axis magnetization reactance
• X
2
is the negative sequence resistance
• X
o
is the zero-sequence reactance
• R
o
is the zero-sequence resistance
• SCR is the short-circuit ratio (1/X
du
)
• δ is the internal power angle in radians or electrical degrees
All resistances and reactances above are in P.U.
8.6.1 X
du
, X
ds
Measurements
The unsaturated direct axis synchronous reactance X
du
(P.U.) can be calculated as a ratio between two
field currents:
(8.49)
where
I
FSI
= the field current on the short-circuit saturation curve that corresponds to base stator current
I
FG
= the field current on the open-loop saturation curve that holds for base voltage on the airgap
line (Figure 8.18)
Also,
(8.50)
When saturation occurs in the main flux path, X
adu
is replaced by its saturated value X
ads
:
X
I
I
du
FSI
FG
=
XX X
du adu l
=+