APPLICATIONS OF ION CHROMATOGRAPHY FOR PHARMACEUTICAL AND BIOLOGICAL PRODUCTS pptx
Bạn đang xem bản rút gọn của tài liệu. Xem và tải ngay bản đầy đủ của tài liệu tại đây (4.72 MB, 455 trang )
APPLICATIONS OF ION
CHROMATOGRAPHY
FOR PHARMACEUTICAL
AND BIOLOGICAL
PRODUCTS
PART I
PRINCIPLES, MECHANISM,
AND INSTRUMENTATION
1
ION CHROMATOGRAPHY—
PRINCIPLES AND APPLICATIONS
Lokesh Bhattacharyya
Division of Biological Standards and Quality Control, Office of Compliance
and Biologics Quality, Center for Biologics Evaluation and Research,
Food and Drug Administration, Rockville, MD
1.1 INTRODUCTION
Ionic methods of separation have been used since the industrial revolution in Europe
to reduce hardness of water. In the mid-nineteenth century, British researchers treated
various clays with ammonium sulfate or carbonate in solution to release calcium.
In the early twentieth century, zeolite columns were used to remove interfering
calcium and magnesium ions from solutions to permit determination of sulfate. Ionic
separation procedures were used in the Manhattan project to purify and concentrate
radioactive materials needed to make atom bombs. Peterson and Sober [1] reported
in 1956 a chromatographic method based on ion exchange to separate proteins.
However, ion chromatography (IC), in its modern form, was introduced in 1975 by
Small et al. [2]. The technique has since gained significant attention for the analysis
of a wide variety of analytes in pharmaceutical, biotechnology, environmental,
agricultural, and other industries. Several books and chapters on IC have provided
a detailed review of its principles and instrumentation [3–5]. In 2000, United States
Applications of Ion Chromatography for Pharmaceutical and Biological Products, First Edition.
Edited by Lokesh Bhattacharyya and Jeffrey S. Rohrer.
© 2012 John Wiley & Sons, Inc. Published 2012 by John Wiley & Sons, Inc.
3
4 ION CHROMATOGRAPHY— PRINCIPLES AND APPLICATIONS
Pharmacopeia-National Formulary (USP-NF) had only a few monographs that
described test methods involving IC [6] and no general chapter on this technique.
However, the number of monographs that include one or more IC-based test proce-
dures has increased dramatically in the last 10 years. In addition, the current USP-NF
[7] contains two general chapters on IC (<345
>
and <1065
>
) and at least four
general chapters that include IC-based test methods (<1045
>
, <1052
>
, <1055
>
,
<1086
>
), indicating its importance as a chromatographic technique for the analysis
of pharmaceutical drug substances, products and excipients. In General Chapter
<1065
>
, entitled “Ion Chromatography”, USP-NF describes ion chromatography
as “a high-performance liquid chromatography (HPLC) instrumental technique used
in USP test procedures such as identification tests and assays to measure inorganic
anions and cations, organic acids, carbohydrates, sugar alcohols, aminoglycosides,
amino acids, proteins, glycoproteins, and potentially other analytes” [7].
This chapter will present an introduction to IC providing an outline of its principles
and applications in the analysis of active and inactive ingredients, counter-ions, excip-
ients, degradation products, and impurities relevant to the analysis of pharmaceutical,
biologic and biotechnology-derived therapeutic and prophylactic products.
1.2 WHAT IS ION CHROMATOGRAPHY?
Modern IC is a form of HPLC, just as normal phase, reversed-phase and size
exclusion chromatographies are different forms of HPLC. The separation in IC is
based on ionic (or electrostatic) interactions between ionic and polar analytes, ions
present in the eluent, and ionic functional groups derivatized to the chromatographic
support. This can lead to two distinct mechanisms of separation—(a) ion exchange
due to competitive ionic binding (attraction), and (b) ion exclusion due to repulsion
between similarly charged analyte ions and the ions derivatized on the chromato-
graphic support. Separation based on ion exchange has been the predominant form
of IC to-date. In addition, chromatographic methods in which the separation due
to ion exchange or ion exclusion is modified by the hydrophobic characters of the
analyte or the chromatographic support material, by the presence of the organic
modifiers in the eluent or due to ion-pair agents, resulting in better resolution
that were not achieved otherwise, have gained popularity recently (mixed mode
separation).
Numerous studies have been conducted in the last 30 years to understand the
details of the mechanisms of ion-exchange and ion-exclusion chromatographies and
the effect of different elution parameters, including flow rate, salt concentration, pH,
presence of organic solvents, and temperature, on them. The current chapter is not
meant to provide a comprehensive review of the studies. Rather, it is meant to provide
a general introduction to both types of IC explaining in a qualitative non-mathematical
approach how they work, what types of analytes are suitable for separation by ion-
exchange and ion-exclusion chromatographies, and the effect of different factors on
their performance.
ION-EXCHANGE CHROMATOGRAPHY 5
1.3 ION-EXCHANGE CHROMATOGRAPHY
Ion-exchange chromatography involves separation of ionic and polar analytes using
chromatographic supports derivatized with ionic functional groups that have charges
opposite that of the analyte ions. That is, a column used to separate cations, called a
cation-exchange column, contains negatively charged functional groups. Similarly, an
anion-exchange column, which separates anions, is derivatized with positively charged
functional groups. Ion-exchange chromatography has been widely used in the analysis
of anions and cations, including metal ions, mono- and oligosaccharides, alditols
and other polyhydroxy compounds, aminoglycosides (antibiotics), amino acids and
peptides, organic acids, amines, alcohols, phenols, thiols, nucleotides and nucleosides,
and other polar molecules.
The analyte ions and similarly charged ions of the eluent compete to bind to
the oppositely charged ionic functional group on the surface of the stationary phase.
Assuming that the exchanging ions (analytes and ions in the mobile phase) are cations,
the competition can be represented by the following scheme:
S − X
−
C
+
+ M
+
↔ S − X
−
M
+
+ C
+
(1)
In this process, the cation M
+
of the eluent exchanges for the analyte cation C
+
bound to the anion X
−
derivatized on the surface of the chromatographic support
(S). If, on the other hand, the exchanging ions are anions, it is called anion-exchange
chromatography and is represented as:
S − X
+
A
−
+ B
−
↔ S − X
+
B
−
+ A
−
(2)
in which, the anion B
−
of the eluent exchanges for the analyte cation A
−
bound to
the positively charged ion X
+
on the surface of the stationary phase. The adsorption
of the analyte to the stationary phase and desorption by the eluent ions is repeated
as they travel along the length of the column, resulting in the separation due to
ion-exchange [8].
1.3.1 Mechanism
The mechanism of the two processes, cation exchange and anion exchange, are indeed,
very similar. In the first step of the process, analyte ions diffuse close to the stationary
phase and bind to the oppositely charged ionic sites derivatized on the stationary phase
through the Coulombic attraction. The Coulombic force of interaction (f ) between the
two ions in solution, in its simplified form, is given by the equation,
f = q
1
q
2
/εr
2
(3)
in which q
1
and q
2
are charges on two ions, ε is the dielectric constant of the medium,
and r is the distance between them. In most of the ion chromatographic separations,
6 ION CHROMATOGRAPHY— PRINCIPLES AND APPLICATIONS
except when organic solvents are included as modifiers, the medium is water (solutions
of acids, alkalis or salts). Therefore, we can consider ε to be a constant. If the charges
on both ions are similar (either both positive or both negative), the force is repulsive.
Where they are dissimilar (one positive and the other negative), the force is attrac-
tive. We need to remember two basic principles of thermodynamics to understand
the mechanism. (1) Attractive force between two oppositely charged ions results in
decrease in enthalpy (H ) and free energy (G). (2) The thermodynamic principles favor
the process in which the free energy change is negative.
In a column, the bound analyte ions face competition from similarly charged ions
present in the eluent as they compete for binding to the same oppositely charged
ionic sites of the stationary phase. For example, the negatively charged analyte ions
and the negative ions present in the eluent both compete for the positively charged
sites on the stationary phase. Overcoming binding due to the ionic attraction between
negatively charged analyte ions and the positively charged ionic site of the stationary
phase requires ‘work’ and leads to an increase in free energy (and enthalpy) of the
system and, as such, is not thermodynamically favorable. However, the increase is
overwhelmingly compensated by the decrease in free energy (and enthalpy) due to the
binding of the negative ions of the eluent because the concentration of the negative
ions of the eluent is overwhelmingly greater than that of the analyte ion concentration.
To illustrate this with a simple example, the typical concentration of an eluent in
IC ranges between 10–100 mM (in some cases, as low as 1 mM or as high as
500 mM). However, the typical concentration of each analyte is in the micromolar
to sub-micromolar range. Thus, the concentration of the eluent ion is 10
4
−10
5
fold
higher than that of the concentration of the analyte ion. The energy input needed
to displace an analyte ion from the stationary phase is significantly less than the
energy released due to attractive interactions between the stationary phase ion and the
overwhelmingly larger number of ions in the eluent resulting in a decrease of free
energy and the overall process is thermodynamically favored.
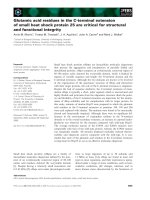
When ionic or polar analytes enter an ion-exchange column, they first bind to the
charged sites of the stationary phase in a layer. As different amounts of energy are
needed to unbind different analytes from the stationary phase, due to differences in
charge density and other factors (see later), the desorption takes place at a different
rate and/or requires different concentrations of eluent ions. This leads to separation
of the analytes—the analyte requiring lesser energy is desorbed (eluted) earlier from
the stationary phase. This adsorption-desorption phenomenon continues from layer to
layer as the analytes travel along the length of the chromatographic column, increasing
separation between the analytes (Figure 1.1). In an optimized separation procedure,
the analytes are resolved when they exit the column.
Equation (3) predicts that the force of attraction between a monovalent analyte
ion with one unit of charge (e.g., chloride) and an ionic site on the stationary phase
will be lesser than that between a divalent analyte ion (e.g., sulfate), which has two
units of charge, and the same stationary phase ionic site. Thus, a higher concentration
of eluent ion will be necessary to displace a divalent ion from the stationary phase
than that required to displace a monovalent ion, resulting in a separation of the two by
IC, and the monovalent ion will be eluted from the column earlier than a divalent ion.
ION-EXCHANGE CHROMATOGRAPHY 7
Figure 1.1. A schematic diagram of separation of analytes by ion-exchange chromatography.
Similarly, a trivalent ion will bind the stationary phase more strongly than a divalent
ion and will be eluted from the column after the divalent ion.
The above discussion, however, does not explain separation of monovalent ions
from an ion exchange column. It is conceivable that we should consider the charge
density on the surface of an ion rather than its actual charge, since the ions, particularly
those of interest in the analysis of pharmaceutical drugs, are not point masses and
the underlying assumption of equation (3) is that the charges are points. A larger
monovalent ion (e.g., chloride) will have less charge density than a smaller monovalent
ion (e.g., fluoride), since both have a total of one unit of charge. Thus, fluoride ion is
expected to bind more strongly on a stationary phase than chloride, require a higher
eluent concentration to displace, and elute later from the column. So, when a mixture
of fluoride, chloride and bromide is chromatographed on an IC column, bromide is
expected to be eluted first (being the largest and therefore having the lowest charge
density among the three ions), then chloride and then fluoride. In reality, however, the
elution order is found to be reversed. For example, when a mixture of different anions
are eluted from an IonPac AS11 column with sodium hydroxide [9], fluoride ion is
eluted first, then chloride and then bromide, that is, in the reverse order of what is
expected based on the charge density. In fact, the results from the same example show
that when a mixture of fluoride, chloride, bromide, nitrate, acetate, and benzoate, all of
which are monovalent ions, are eluted from an IonPac AS11 with sodium hydroxide
[9], the elution sequence of the ions is,
Fluoride
>
acetate
>
chloride
>
bromide
>
nitrate
>
benzoate (4)
With the exception of acetate, it appears that a smaller ion is eluted earlier than a larger
ion. Similarly, when a mixture of trivalent ions, phosphate and citrate, are eluted from
an IonPac AS11 column with sodium hydroxide, the less bulkier phosphate ion is
eluted before the bulkier citrate ion [10]. That is, the elution sequence is the reverse
of what is expected based on their charge densities.
It is of interest to note that the sequence in which these ions are eluted from the
column closely resembles the Hofmeister series (or the lyotropic series) [11]. It is
8 ION CHROMATOGRAPHY— PRINCIPLES AND APPLICATIONS
conceivable that the mechanism of separation is somehow related to the mechanism
that led to the Hofmeister series [12]. The binding of the analyte ions to the ions on
the stationary phase followed by competitive desorption by similar ions present in the
eluent, as discussed above, indeed, represent only part of the overall process. Water
molecules play a very critical role in the overall process.
An ion in aqueous solution (or for that matter in solution of a polar solvent) does
not exist as a free ion. It is hydrated (or generally speaking solvated) with several
molecules of water (or solvent). The hydration extends over several layers of water
molecules, primarily through coordinate bond formation, formation of hydrogen
bonds, and Van der Waals type ion-dipole and dipole-dipole interactions, depending
on the nature and charge of the ions, forming a hydration sheath around each ion. The
thickness of this sheath is roughly proportional to the charge density of the ion. The
water molecules of the sheath interact with the molecules of the bulk water through
ion-dipole and dipole-dipole interactions and thereby become part of an overall water
structure. Thus, when an eluent ion binds to the stationary phase, it has to free itself
from this structure. While free energy (G) is reduced due to the attractive binding bet-
ween the oppositely charged ions, a considerable amount of free energy is required to
break the water structure. However, the ion that was exchanged out of the stationary
phase due to the above binding has the same charge as the ion that exchanges in. The
former ion immediately forms its own water structure in the solution. While energy
needs to be put in to unbind the ion, a significant amount of free energy is released
due to the formation of the water structure. Schematically, the overall process can be
described as:
Destruction of water structure of the eluent ion −→ Increase in G
Binding of the eluent ion to the stationary phase −→ Decrease in G
Unbinding of an analyte ion from the stationary phase −→ Increase in G
Formation of the water structure around the analyte ion −→ Decrease in G
The overall change in free energy is a combination of the free energy changes of the
individual steps. A smaller ion will have a high charge density. So, it will be able to
form a significantly extended water structure around it resulting in a large decrease in
free energy. Thus, a smaller monovalent ion (e.g., fluoride) is eluted from the column
earlier than a larger monovalent ion (e.g., chloride) because of a larger reduction
of free energy as a result of extended hydration around it. Oxygenated ions such as
acetate can form a significantly thicker hydration sheath around it than is expected
from its charge density. The oxygen atoms present in these ions can form strong
hydrogen bonds with hydrogen atoms of water in the initial layer. Subsequent layers
of hydration are formed through hydrogen bonding among the water molecules as
well as due to strong ion-dipole and dipole-dipole interactions. Such ions in solution
can form a very stable structure permitting a large decrease in the free energy. Thus,
even though acetate ion is bulky it is eluted earlier from the column than the chloride
and bromide ions, which are smaller than acetate.
ION-EXCHANGE CHROMATOGRAPHY 9
1.3.2 Eluent
Typically the eluents used in ion exchange chromatography are acids, alkalis or salt
solutions, and do not contain an organic solvent (however, see later). The extremes
of pH conditions offered by acids or alkalis help ionize polar molecules into ions. An
excellent example is the ionization of neutral sugars and alditols under the high pH
conditions, typically 10–500 mM sodium hydroxide, used in High Performance Anion
Exchange Chromatography (HPAEC). However, such applications will require analyte
molecules to be stable in the acid or alkali used as the eluent. This sometimes limits the
application of IC in the analysis of pharmaceutical drugs because the analyte may not
be stable under the extreme pH conditions of acids or alkalis. If the analyte molecules
are ionic or strongly polarized, elution by salt solutions or buffers of controlled pH
conditions, often provide an excellent opportunity for separation by IC. [Using acids or
alkalis as eluents has an additional advantage, when suppressed conductivity detection
is used. This will be discussed later.]
The elution can be isocratic or with increasing salt concentrations, either by batch
or gradient elution, or by altering pH of the eluent. Less tightly bound ions are eluted
initially; more tightly bound analytes are eluted either under altered elution conditions
(e.g., higher salt concentration or different pH) or simply later, resulting in separation.
When gradient elution is used, the peak is expected to be slightly asymmetric and
the tailing factor [7] is expected to be greater than 1. As an analyte band travels
through the column (Figure 1.1), the eluent behind it has a concentration higher than
the concentration at which it is eluted. So, the back of the band cannot bind to the
column but can diffuse through the eluent. However, the eluent concentration at the
front of a band is lower than the concentration at which it is eluted. It, therefore, binds
to the column and its diffusion is restricted.
Changing eluent pH can change the ionic characters of the analytes and/or the
functional groups on the chromatographic support. Thus, an anion may become less
ionic at a lower pH. However, the actual ionic character depends on the pK
a
of the
acid containing the anion (A
−
), which is the negative logarithm of the equilibrium
constant of the following equilibrium:
A
−
+ H
+
↔ HA (5)
The further the elution pH is from the pK
a
, the more ionic it will be. Thus, the anion
with a lower pK
a
value (more acidic) will be eluted after an anion with a higher pK
a
value (less acidic). Similarly, a cation having a lower pK
b
value (more basic) will be
eluted after a cation with a higher pK
a
value (less basic).
1.3.3 Organic Solvents
Sometimes small quantities of organic solvents (organic modifier) are added to IC
eluent to achieve better separation, to reduce hydrophobic interaction with the column
packings, and for improving chromatographic/peak parameters (e.g., theoretical plate,
resolution, peak shape). We now need to consider the ε term used in Equation 3
10 ION CHROMATOGRAPHY— PRINCIPLES AND APPLICATIONS
above to understand the effect of organic modifiers. The dielectric constant of water
is around 80 at 20
◦
C. The value of this parameter is below 50 for most of the organic
solvents. Thus, when organic solvents are added to an aqueous eluent, the dielectric
constant of the medium is decreased. This results in a tighter binding of the analyte
and eluent ions to the stationary phase because this term appears in the denominator
in Equation 3, which alters the elution pattern.
Inclusion of organic solvents also affects the formation of water structure around
an ion by (a) altering the forces of ion-dipole and dipole-dipole interactions and hydro-
gen bonding due to altered dielectric constant, and (b) interferes with the formation
of water structure by inserting itself into the structure. The forces of ion-dipole and
dipole-dipole interactions, which, in turn, also affect hydrogen bond formation, are
governed by the Coulomb’s Law of interaction (Equation 3). The force of such inter-
action is, thereby, altered by the inclusion of organic solvents. However, the impact
will not be significant when a small quantity of organic solvent is used.
The polar organic solvent molecules, particularly those containing oxygen atoms,
also enter into the hydration sheath by forming hydrogen bonds. However, they cannot
form as extensive a hydrogen bond network as water due to the hydrophobic nature of
such molecules and their larger size, thereby weakening the water structure. Thus, less
free energy is needed to break such structures as an eluent ion binds to the stationary
phase. Similarly, there is a lower reduction of free energy when the analyte ion is
released into the eluent.
Inclusion of an organic solvent also reduces the effect of hydrophobic associa-
tion between the analyte molecules and the stationary phase. In particular, when the
analyte has a significant hydrophobic surface, as is the case for many pharmaceutical
drugs, it often shows a broad peak in IC due to its interaction with the hydrophobic
surface of the chromatographic support. Inclusion of a small quantity of organic sol-
vent often results in sharper peaks thereby improving peak characteristics and other
chromatographic parameters (e.g., resolution) by reducing the effect of hydrophobicity.
1.3.4 Other Factors
The dissociation constants of analytes vary with temperature, although the extent of
variation is usually small. This does not have any effect on the chromatographic pro-
file, where the analytes are fully ionized under the conditions of chromatography.
However, the retention times of analytes that are not fully ionized will vary slightly
with temperature. This variation does not pose a significant problem because samples
relevant to pharmaceutical applications are usually run with a reference standard. Thus,
ion-exchange chromatography is typically run under ambient or near ambient temper-
atures. Similarly, pressure does not affect elution profiles, as the effects of pressure
on dissociation constants are negligible. However, the columns should be operated at
their optimum operating pressures (or pressure range) to maintain high performance.
Since ion-exchange chromatography involves binding and unbinding of analyte
ions to charges on the surface of the chromatographic support, it is critical that analyte
ions are able to diffuse to the chromatographic support to bind to it and diffuse
away from the support when desorbed. Therefore, the flow rate must be such as to
ION-EXCLUSION CHROMATOGRAPHY 11
permit diffusion of the ions. This is usually not a problem for smaller ions, as their
diffusion rates are high. Larger ions may need more time. In most cases, a flow rate
of 0.5–2.0 mL per minute is sufficient to meet this condition. Anomalies have been
observed when higher flow rates are used due to incomplete binding and desorption.
1.4 ION-EXCLUSION CHROMATOGRAPHY
Introduced by Wheaton and Bauman in 1953 [13], Ion-exclusion Chromatography
uses strong cation- or anion-exchange chromatographic supports to separate ionic,
polar, weakly polar, and apolar analytes, and has been used in the analysis of organic
acids, alcohols, glycols and sugars. In contrast to ion-exchange chromatography, the
charge on the functional groups on the chromatographic support is the same as the
charge on the analyte ion. That is, to separate negatively charged or negatively polar-
ized analytes, the chromatographic supports are derivatized with negatively charged
functional groups (typically, sulfonate). Similarly, analytes with positive charge or
polarity are separated using a chromatographic support that carries positive charges
(most frequently, quaternary ammonium ions).
1.4.1 Mechanism
Although the actual mechanism of separation is not fully understood, it is widely held
that the separation is effected by partition of analytes between the stationary phase
and the mobile phase across a hypothetical semipermeable Donnan membrane. This
theory will be discussed briefly in this chapter. An alternate explanation is presented
in Chapter 2 of this book.
Water molecules bind to the ionic functional groups of the chromatographic
support through coordination, hydrogen bond, and Van der Waals type ion-dipole
interaction forming hydration spheres around the functional groups. Water molecules
in this hydration sphere and also those trapped in the interstitial spaces (and pores) of
the resins are immobilized around the chromatographic support forming the stationary
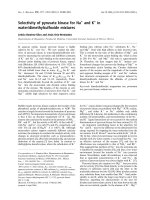
phase system. As a fully ionized analyte in the mobile phase approaches a station-
ary phase containing like charges (e.g., chloride ion approaching a stationary phase
around a sulfonate-derivatized resin), it is strongly repelled by the similar charge. The
repulsion is Coulombic and the repulsive force is given by the Equation 3 above. The
repulsive force increases rapidly as the ionic analyte approaches the stationary phase
because the Equation 3 contains the r
2
term in the denominator. The repulsion does
not permit the ionic analytes to come more than a certain distance from the station-
ary phase system forming the outer surface of the hypothetical Donnan membrane
(Figure 1.2) and such analytes elute from the column without being retained.
When an apolar molecule approaches the same stationary phase, it experiences
no repulsion as the q term corresponding to an apolar molecule in Equation 3 is zero.
So, it can freely penetrate deep into the immobilized water layer, which permits it
to stay longer in the column. Such molecules partition back and forth at different
layers as it they travels along the length of the column. Thus, an apolar analyte is
12 ION CHROMATOGRAPHY— PRINCIPLES AND APPLICATIONS
Stationary
phase
Mobile
phase
CH
3
COOH (Sample)
Donnan-Membrane
H
+
Cl
−
(Eluent)
H
2
O
H
2
O
H
2
O
H
2
O
H
2
O
9963
SO
3
−
H
+
SO
3
−
H
+
SO
3
−
H
+
SO
3
−
H
+
SO
3
−
H
+
δ
−
Figure 1.2. A schematic diagram of the formation of the hypothetical Donnan membrane
and mechanism of separation by ion-exclusion chromatography. (Reproduced from Application
Note 106, with permission from Dionex, Inc.)
eluted from the column well after ionic and polar analytes. A polar analyte, which
has partial separation of charges within the molecule (forming a dipole), experiences
less repulsion than an ion but more than an apolar molecule. Thus, the degree of
penetration of such an analyte is in between an ion and an apolar molecule and it is
eluted from the column in between ionic and apolar analytes.
It is also clear from Equation 3 above that the force of repulsion experienced by
a polar analyte depends on its dipolar character. An analyte that is more polar has
more ionic character, thus, experiences greater repulsion and, therefore, will penetrate
less into the stationary phase and will be eluted earlier from the column, compared to
a less polar analyte. Thus, less and less polar molecules elute later and later from the
column and an apolar molecule elutes at the end resulting in separation.
However, it appears that the partition mechanism does not fully explain many
of the separations achieved by ion-exclusion chromatography. Additional mechanisms
seem to play some role in the process (see Chapter 2 of this book).
Hydrophobic Properties of analyte molecules play an important role in the sepa-
ration. Molecules with extended hydrophobic surface are retained longer in the column
due to stronger hydrophobic association with the stationary phase system. For example,
the elution times of aliphatic carboxylic acids become longer as the length of the
alkyl groups increases [14]. The elution order of a mixture of the first three aliphatic
carboxylic acids is:
formic acid
>
acetic acid
>
propionic acid.
Calculations based on their pK
a
values indicate that these three aliphatic carboxylic
acids are strongly ionized in solution (60–97%). Thus, they should come out close
ION-EXCLUSION CHROMATOGRAPHY 13
to the void volume of the column based on the partition mechanism discussed above.
Although formic acid is eluted close to the void volume, the other two are eluted later.
Similarly, higher aliphatic amines (e.g., butylamine, pentylamine, diethylamine) show
longer elution time due to the hydrophobic character of their long aliphatic chains.
The elution times are reduced and the peak shapes are considerably improved when
an organic solvent is included in the mobile phase [15].
π –π interaction also plays a role in the separation by ion exclusion chro-
matography when the support contains a double bond or an aromatic ring (e.g.,
polystyrene). For example, acrylic acid, which contains a double bond, elutes after
propionic acid. Aromatic acids, which contain a benzene ring show long retention
time on the column [14].
Hydrogen bonding is an important factor, particularly in the separation of
molecules that contains several hydroxyl groups, e.g., carbohydrates. These molecules
are retained longer by the stationary phase, presumably due to hydrogen bonding
with the hydration sphere of the stationary phase system.
Steric factors also play a role in ion-exclusion chromatography. Molecules with
bulkier groups are excluded earlier. For example, a dicarboxylate (e.g., oxalate) is
eluted earlier than a monocarboxylate (e.g., acetate) when eluted with 7.5 mM sul-
furic acid. An iso-carboxylic acid (e.g., iso-butyric acid) is eluted earlier than the
corresponding normal carboxylic acid [14].
Complexation with the positive counter-ion of the chromatographic support also
plays a role in the separation of analytes containing hydroxyl groups (e.g., sugars).
Calcium and lead forms of a cation-exchange resin are often used to separate neutral
monosaccharides.
1.4.2 Eluent
Based on the partition mechanism discussed above, it is conceivable that deionized
water can be used as the eluent during ion-exclusion chromatography. However, sev-
eral problems have been encountered [14–16]. Although water is found suitable for the
resolution of very weak acids, such as carbonic and boric acids, or very weak bases,
strong or even moderately strong acids and bases are too ionized in water to be sepa-
rated. They are not retained sufficiently due to their high degree of ionization and are
eluted within the void volume or close to the void volume without adequate resolution.
Secondly, the peaks are often fronted, broad, and/or significantly tailed, due to factors
other than pure partition mechanism described above. Typically, dilute solutions of
strong acids and alkalis are used in the separation of anionic (e.g., carboxylic acids)
and cationic (e.g., amines) solutes, respectively, to overcome the problem. Sulfuric,
hydrochloric and aliphatic sulfonic acids are widely used. The strong acids suppress
ionization of carboxylic acids permitting them to be resolved. Phosphoric acid and
perfluorobutyric acid have been used successfully for the separation of weaker acids.
Amines are separated using dilute alkalis, such as sodium hydroxide. It is interest-
ing to note that eluents of the same pH, when used with the same stationary phase,
produce very similar chromatographic profiles, irrespective of the nature of the acid
14 ION CHROMATOGRAPHY— PRINCIPLES AND APPLICATIONS
used as the eluent. The choice of actual acid to be used as eluent, therefore, is often
determined by the detection system to be used.
Sometimes, addition of organic solvents to aqueous eluents leads to reduction
of run time, sharper peaks and higher resolution because organic solvents minimize
the hydrophobic effects. The organic solvent to be used and its concentration are
determined by its compatibility with the detection system.
1.4.3 Other Factors
Ion-exclusion chromatography is usually run at ambient temperature, however, higher
resolution is obtained at an elevated temperature because the partition rate is increased
and the hydrophobic effect is reduced. In some cases, pure water is used as eluent at
60–80
◦
C. [However, note that many analytes, including almost all proteins and some
of the pharmaceutical drug molecules, are not stable at such a high temperature.] The
efficiency of separation increases with decreased flow rate because it is necessary to
permit sufficient time to the analyte molecules to diffuse into the hydration sphere of
the stationary phase system to achieve optimal separation. A flow rate in the range of
0.3–0.5 mL/min is recommended for most separations. Ion-exclusion chromatography
requires columns that are usually large in size, typically 30 cm, because a consider-
able volume of chromatographic support material is necessary to provide sufficient
occluded liquid to obtain a stationary phase that permits separation of solutes of similar
characteristics.
1.5 INSTRUMENTATION
Figure 1.3 shows a schematic of the set up of an IC system. An examination of the
figure shows that the set up closely resembles that of a typical HPLC system. The
components include an autosampler, a high-pressure pump, an injection valve with
sample loop of suitable size (typically, 10–250 μL), a guard column, an analytical
column, an optional suppressor or a post-column reagent mixing system, a flow-
through detector, and a processing system ranging from a data-processing integrator
to a computerized system management unit, which contains software to run the system
using pre-programmed method and schedule (sequence) files, perform data acquisition
and processing to crunch out the final results.
Since the mobile phase generally contains dilute acids, alkalis or salt solutions, the
components in contact with mobile phase are typically made of a completely metal free
inert material, such as polyetheretherketone (PEEK). A conventional HPLC system
also may be used provided that its components are made of materials that are compat-
ible with the mobile phase. Following suitable preparation, the sample is introduced
through the injection valve. After optional chemical suppression or other post column
treatment of the effluent, the analyte is detected using a suitable detection system (see
later). Because IC typically uses an ionic mobile phase, a suppression of background
conductivity of the eluent is often necessary prior to conductometric detection, when
such a detector is used, although nonsuppressed conductometric detection has been
DETECTION 15
Eluent
Sample
High-
pressure
pump
Injection
valve
Suppression Device
or Post-Column
Derivatization
Detector
Data
Station
Guard
Column
Analytical
Column
Figure 1.3. A schematic diagram of the set-up and components of a typical IC system.
(Adapted from USP-NF General Chapter <1065
>
with permission.)
used in pharmaceutical analysis, particularly when water, weak acids or weak bases
are used as eluents, as is common in ion-exclusion chromatography.
A detailed description of each of the individual components of an IC system is
beyond the scope of this chapter. Furthermore, with the exception of the detector
system, including the suppressor, and the need to have metal-free components for
most IC applications, the components are no different from those used in a traditional
HPLC system. A brief discussion on the suppressor and the detectors used in IC is
provided below.
1.6 DETECTION
Any suitable detector can be used for the detection and quantitation of analytes by
IC. The choice of detector depends upon the nature of the analyte molecules. This
may include the universal refractive index (RI) detector, UV detector for analytes that
absorb UV, fluorescence detector for analytes that contains fluorophores, or radio-
chemical detectors, where appropriate [cf . 7]. However, traditionally, IC is associated
with electrochemical detectors. So, only a discussion of the electrochemical detector
systems is included in this chapter. It is not the intention of this chapter to suggest
that other types of detectors should not be used with IC. Indeed, they should be, if the
application dictates. However, the ability of electrochemical detectors is less appre-
ciated in the pharmaceutical industry, presumably because mechanisms of action of
these detectors are less understood compared to those of the traditional photometric
detectors mentioned above.
Two types of modern electrochemical detectors are widely used in IC —con-
ductivity (suppressed and nonsuppressed) and pulsed amperometry.
1.6.1 Conductivity Detection
When a constant voltage is applied across two electrodes between which the effluent
from a column flows, a current is generated because the effluent contains ions or
16 ION CHROMATOGRAPHY— PRINCIPLES AND APPLICATIONS
polar molecules. The strength of the current is proportional to the conductivity of
the solution, which, in turn, is proportional to the concentration of ionic species in
solution and their ion conductances. The concentration is the number of ions carrying
electricity. The ion conductance of an ion determines its ability to carry electricity.
The ions present in effluent provide the background (baseline) conductivity of a
chromatographic profile. The additional conductivity due to an analyte ion or a
polar molecule, when they are present in the effluent, provides the peak, which is
proportional to its concentration. Different analytes at the same concentration show
different peak areas (or peak heights) due to the difference in their ion conductances.
The problem, however, is that the conductivities of effluent solutions are often
significantly higher than the conductivities of the analytes, simply because, as men-
tioned above, the concentrations of ions in effluent are 10
4
−10
5
higher than that of the
analytes, particularly in ion-exchange chromatography. Thus, early attempts to apply
conductivity measurement to IC had significant limitations.
1.6.1.1 Suppressed and Nonsuppressed Conductivity Detections. This
limitation was overcome when Small et al. [2] introduced the concept of suppressed
IC. Small et al. used a packed-bed suppressor in the hydroxide form to achieve sen-
sitive detection of the ions by chemically modifying the effluent before it enters the
conductivity detector. The suppression was achieved by converting the mineral acid
eluent to water and thereby obtaining a very low background signal and low noise,
while converting the analyte to its base form, which is fully dissociated and actually
carries more current than the analyte itself, thereby increasing the sensitivity of the
detection (see later). In this system, the effluent containing HA (A being the anion)
passes through the suppressor that exchanges A
−
for OH
−
to produce water, which
does not conduct electricity. Noise is proportional to the background signal and elim-
ination of the background electrolyte lowers the noise, provides more stable baseline
and improves analyte sensitivity. However, in 1979, Gjerde et al. [17] reported an IC
method in which the analytical column is directly linked to a conductivity detector
without any suppressor. The methods employed a low capacity analytical column and
dilute solutions of weak acids or bases as eluents to achieve low background signals.
The question then is, to suppress or not to suppress. The conductivity of an
electrolyte, MX, is given by the following equation:
C = c
MX
MX
= c
MX
(λ
M
+ λ
X
) (6)
where C is the conductivity of the electrolyte, c
MX
is the concentration of MX in
Normality (N),
MX
is the equivalent conductance of the electrolyte MX, and λ
M
and λ
X
are equivalent ion conductances of M
+
and X
−
ions, respectively (including
their respective waters of hydrations). The ion conductances of a few common ions
are shown in Table 1.1.
To understand suppressed and nonsuppressed detection, let us consider two iden-
tical cation-exchange chromatographic runs of the analyte MX using a strong acid,
HA, as the eluent (where A is an anion), with the difference that in the first system
the effluent first passes through a suppressor before entering the conductivity cell,
whereas in the second system the effluent flows directly through the conductivity cell.
DETECTION 17
TABLE 1.1. Equivalent Ion Conductances of Common Ions
Cation Eq. Ion Conductance (mho) Anion Eq. Ion Conductance (mho)
H
+
349.8 OH
−
198.0
K
+
73.5 Br
−
78.4
Na
+
50.1 Cl
−
76.3
Li
+
38.7 HCO
3
−
44.5
NH
4
+
73.4 SO
4
2−
79.8
Mg
2+
53.1 Acetate 40.9
Ca
2+
59.5 Propionate 35.8
In the second (nonsuppressed) system, the analyte signal is measured by the
conductivity difference (C) between MX and HA, given by the following equation:
C = c
M
[(λ
M
− λ
H
) + (λ
X
− λ
A
)](7)
where c
M
is the concentration of M
+
(same as the concentration of MX) in the effluent.
The change in conductivity in Equation (7) is around −300 ± 30 times c
MX
because
the equivalent ion conductance values of anions are within approximately ±30 of each
other, except when the anion is the hydroxyl ion (Table 1.1). However, hydroxyl ion
cannot be used in a cation-exchange chromatography in which an acid is used as the
eluent. The result is, therefore, a negative peak, which can be viewed as a positive
peak by reversing the signal polarity of the detector. In the suppressed system, the MX
first passes through the suppressor, in which both X
−
and A
−
are converted to OH
−
.
Most of the OH
−
combines with H
+
of the acidic eluent to form water. Therefore,
the analyte is now detected essentially in a background of pure water, resulting in a
positive analyte response, given by the equation:
C = c
M
(λ
M
+ λ
OH
) (8)
The change in conductivity in Equation (7) is around 250 ± 20 times c
MX
(C
M
= C
MX
)
resulting in a positive peak (the equivalent ion conductances of cations are within range
of approximately ±20, except when the cation is H
+
).
The above calculation appears to indicate that the nonsuppressed conductivity is
about as much or more sensitive than the suppressed conductivity detection. How-
ever, we have not taken into consideration the difference in baseline conductivities. In
suppressed conductivity, the eluent that passes through the detector is essentially pure
water with the baseline conductivity approaching zero, compared to baseline conduc-
tivities of 1000–1500 μS when a strong acid is used as the eluent in a nonsuppressed
detection system and lower when a weak acid is used because a weak acid is not fully
dissociated. Thus, a peak equivalent to the conductivity of 250 times c
MX
is observed
against a background of essentially zero conductivity with suppressed conductivity
detection. The same chromatography produces a peak equivalent to around 300 times
c
MX
in a background of 1000–1500 μS when nonsuppressed conductivity is used.
18 ION CHROMATOGRAPHY— PRINCIPLES AND APPLICATIONS
As the baseline conductivity is proportional to the concentration of ions in the
eluent, it is critical to use dilute solutions of weak acids and bases when nonsup-
pressed conductivity detection is employed because they are slightly dissociated, even
in dilute solutions. Consequently, it is necessary to use low-capacity ion-exchange
columns. However, the capacity is much less of a factor while choosing a column
when suppressed conductivity detection is used, because high eluent concentrations
may be used without any significant change in the background conductance, as long
as the suppressor capacity is not exceeded.
The baseline conductivities (noise) in a typical suppressed conductivity detection
is found to be <0.5 nS (using strong acids or alkalis) while the same is ∼10 nS
(using weak acids or alkalis) with nonsuppressed detection. Thus, considering the
above example,
Signal-to-noise ratio for the suppressed system = 250.c
MX
/0.5 = 500.c
MX
Signal-to-noise ratio for the nonsuppressed system = 300.c
MX
/10 = 30.c
MX
Thus, suppressed conductivity detection provides about an order of magnitude better
signal-to-noise ratio than the nonsuppressed system.
Furthermore, Detection Limit and Quantitation Limit are related to the signal-to-
noise ratio [cf . 18]. Thus, both validation parameters are expected to be an order of
magnitude lower when suppressed conductivity detection is used compared to non-
suppressed detection, attributing greater detection and quantitation sensitivity to the
former technique.
When gradient elution is used, the baseline changes continuously with nonsup-
pressed conductivity detection. This makes peak area (or height) measurement less
accurate. The baseline does not change when gradient elution is used in conjunction
with suppressed conductivity detection.
However, for analytes that form weak bases from the suppressor reaction, such as
NH4
+
, a nonlinear calibration curve has been observed. Thus, a quadratic curve fit is
typically required for acceptable correlation of the calibration curve (see Chapter 4 of
this book for more details). A linear calibration curve is observed using nonsuppressed
conductivity detection.
1.6.1.2 Mechanism of Suppression. Although originally introduced by
Small et al. [2], chemical suppressors are seldom used today. The suppressors that
are widely used today operate electrolytically. The design and the mode of operation
of electrolytic suppressors from different manufacturers vary to some degree in
details but the basic mechanism of their operation is essentially the same, which will
be discussed here. More recently suppressors have been developed which recycle the
eluent back to the eluent delivery chambers, thereby resulting in reduction of the
operating cost. These suppressors work only in conjunction with electrolytic eluent
generation systems where the feed from the eluent chamber is water. The mechanism
of operation of such suppressors is discussed elsewhere in this book (see Chapter 4).
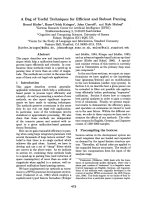
To explain the mechanism of operation of electrolytic autosuppressors, let us con-
sider anion suppression in the effluent from an anion-exchange column (Figure 1.4).
DETECTION 19
+
_
Anode Cathode
Waste/Vent
Waste/Vent
H
2
O,O
2
Na
+
X
−
in Na
+
OH
−
Eluent
H
2
O
H
2
O
H
2
O
H
2
O
Cation
Exchange
Membrane
Cation
Exchange
Membrane
H
+
Na
+
Na
+
OH
−
,H
2
H
+
+ O
2
H
+
+ OH
−
H
2
+ OH
−
OH
−
H
+
+ X
−
H
+
X
−
in H
2
O
H
2
O
H
+
X
−
To Detector
Figure 1.4. A Schematic diagram explaining the mechanism of ion suppression of an effluent
from an anion-exchange column by an electrolytic autosuppressor.
The analyte, X
−
, having Na
+
as the counter-ion, is eluted from the column by the elu-
ent, sodium hydroxide. As shown in Figure 1.4, the effluent enters into the suppressor
through the central chamber enclosed by a “semi-permeable membrane”, which per-
mits transfer of positive charges under the influence of an electric field but not transfer
of negative charges (for an anion suppressor) nor transfer of material by diffusion.
The central chamber has an anode chamber on one side and a cathode chamber on
the other. Water is pumped into both the cathode and the anode chambers. When an
electric field is applied, water in both chambers undergoes electrolysis. In the anode
chamber, the electrolysis generates hydrogen ion and oxygen molecules. Similarly,
hydroxyl ion and hydrogen is generated in the cathode chamber. Hydrogen ion travels
across the membrane from the anode chamber into the central chamber and sodium
ion moves out of the central chamber into the cathode chamber. Hydroxyl ion of the
eluent binds to the hydrogen ion in the central chamber to form water. Sodium ion that
has moved out of the central chamber is replaced by hydrogen ion that has moved in.
The central chamber now contains H
+
X
−
(instead of Na
+
X
−
) in pure water, which
moves to the detector. Thus, the acid form of the analyte X
−
in pure water enters the
detector and the eluent is converted to pure water, which provides essentially zero
background.
Similarly, when a cation suppressor is used, the “semi-permeable membrane”
permits transfer of negative charges only under an electric field and the analyte cation
with hydroxyl counter-ion in pure water goes to the detector.
The eluent is converted to pure water only when the eluent is either an acid or
an alkali. If a salt is used as an eluent, the anion will combine with the hydrogen ion
20 ION CHROMATOGRAPHY— PRINCIPLES AND APPLICATIONS
produced by the electrolysis of water to form the corresponding acid when an anion
suppressor is used (e.g., HCl if NaCl is used in the eluent). Similarly, the suppression
will produce the hydroxyl form of the cation, if a cation suppressor is used. The
suppression will not lead to near zero background under such conditions, however,
the background could be still acceptably low if the acid form of the anion is a very
weak acid or the hydroxyl form of the cation is a very weak base.
1.6.2 Pulsed Amperometric Detection
Used typically in combination with high-performance anion-exchange chromatography
(HPAEC), pulsed amperometric detection (PAD) has proved to be a powerful tool in
the detection of mono- and oligosaccharides, alditols, amino acids and peptides without
requiring any sample derivatization.
At high pH, the analytes are oxidized at the surface of the gold electrode by
the application of pulses of positive potentials. The current (hence amperometry)
generated is proportional to the analyte concentration, which therefore can be detected
and quantitated. When a single potential is applied to the electrode, oxidation products
that deposit on the electrode surface gradually “poison” the electrode surface, resulting
in loss of analyte signal. To prevent signal loss, the electrode surface is cleaned by
a series of potential pulses that are applied for fixed time periods after the detection
potential. Repeated application of a series of potentials designated E
1
,E
2
,E
3
, , over
defined time periods t
1
,t
2
,t
3
, constitutes the basis of pulsed amperometry. The series
of potentials applied for defined time periods is referred to as a waveform.
The potential E
1
applied over the time period, t
1
, is subdivided into two time
periods related to two functions. In the initial part, called the delay period (t
d
), time
is allowed to permit the current to stabilize due to changing potentials so that only
stable current from analyte oxidation is measured during the second part of E
1
,the
detection period (t
det
), also known as integration time (t
i
), as data acquisition takes
place to integrate peak areas during this time. The time periods during which each
potential is applied, is of the order of a millisecond or less so that data acquisition is
continuous for all practical purposes.
Several waveforms are used in the analysis of different molecules. They were
developed to increase detection sensitivity, and minimize the sensitivity to dissolved
oxygen, the baseline drift, and the loss of electrode surface, when used continuously.
Typically, an Ag/AgCl reference electrode is used as half electrode (in combina-
tion with gold electrode) in PAD. The principles and applications of PAD are described
in further details in Chapter 3.
REFERENCES
1. Peterson EA, Sober HA. Chromatography of proteins: I. Cellulose ion exchange adsorbents.
J. Amer. Chem. Soc. 1956;78:751–755.
2. Small H, Stevens TS, Bauman WC. Novel ion-exchange chromatographic method using
conductometric detection. Anal. Chem. 1975;47:1801–1809.
REFERENCES 21
3. Haddad PR, Jackson PE. Ion Chromatography—Principles and Applications. Amsterdam
(The Netherlands): ElsivierElsevier; 1990.
4. Fritz, J, Gjerde, DT. Ion Chromatography, 3
rd
ed. Weinheim (Germany): Wiley-VCH; 2000.
5. Weiss J. Ion Chromatography, 3
rd
ed. Weinheim (Germany): VCH Verlag; 2004.
6. Bhattacharyya L. Ion chromatography in biological and pharmaceutical drug analysis: USP
perspectives, presented at the Intl. IC Symp. Baltimore: September 29–October 2, 2002.
7. USP33-NF28, Rockville:US Pharmacopeial Convention; 2010.
8. Himmelhoch SR. Chromatography of proteins on ion-exchange adsorbents. Methods Enzy-
mol. 1971;22:273–286.
9. Dionex Corporation, Application Note 116: Quantification of anions in pharmaceuticals.
10. DeBorba BM, Rohrer JS, Bhattacharyya L. Development and validation of an assay for
citric acid/citrate and phosphate in pharmaceutical dosage forms using ion chromatography
with suppressed conductivity detection. J. Pharm. Biomed. Anal. 2004;36:517–524.
11. Hofmeister F. Exp. Pathol. Pharmacol. 1888;24:247–260.
12. Zhang Y, Cremer PS. Interactions between macromolecules and ions: The Hofmeister
series. Current Opinion Chem. Biol. 2006;10:658–663.
13. Wheaton RM, Bauman WC. Ion exclusion. Annals of the NY Acad. Sci. 1953;57:
159–176.
14. Harlow GA, Morman DH. Automatic Ion exclusion-partition chromatography of acids.
Anal. Chem. 1964;36:2438–2442.
15. Morris J, Fritz, JS. Eluent modifiers for the liquid chromatographic separation of carboxylic
acids using conductivity detection. Anal. Chem. 1994;66:2390 –2395.
16. Ohta K, Tanaka K, Haddad PR. Ion-exclusion chromatography of aliphatic carboxylic acids
on an unmodified silica gel column. J. Chromatogr. A 1996;739:359– 365.
17. Gjerde DT, Fritz JS, Schmuckler G. Anion chromatography with low-conductivity eluents.
J. Chromatogr. 1979;186:509–519.
18. ICH Harmonised Tripartite Guideline. Validation of analytical procedures: text and method-
ology, Q2(R1). International conference on harmonisation of technical requirements for
registration of pharmaceuticals for human use, November 2005.
2
RETENTION PROCESSES IN
ION-EXCLUSION
CHROMATOGRAPHY: A NEW
PERSPECTIVE
Milko Novi
ˇ
c
Faculty of Chemistry and Chemical Technology, Aˇskerˇceva, Ljubljana, Slovenia
Paul R. Haddad
Australian Centre for Research On Separation Science (ACROSS), School of
Chemistry, Faculty of Science and Engineering, University of Tasmania, Hobart,
Tasmania, Australia
2.1 INTRODUCTION
Ion-exclusion chromatography (IEC) is a type of liquid chromatography that was first
introduced by Wheaton and Bauman in 1953 [1]. Since then IEC has attracted the
intensive interest of researchers because of its ability to separate biologically interest-
ing species (low fatty acids, amines, alcohols etc.), which are of special importance
for the pharmaceutical industry [2–8].
IEC is based on the separation of partially ionized species on strong anion- or
strong cation-exchange stationary phases, with Donnan exclusion of the analytes from
the charged stationary phase being considered to be the basic separation mechanism.
IEC is referred to by a variety of alternative names which reflect the continuous
search for the exact separation mechanism of the technique [10]. Examples include:
ion-exclusion partition chromatography, Donnan exclusion chromatography, and ion-
moderated partition chromatography. It has been demonstrated that the retention of
Applications of Ion Chromatography for Pharmaceutical and Biological Products, First Edition.
Edited by Lokesh Bhattacharyya and Jeffrey S. Rohrer.
© 2012 John Wiley & Sons, Inc. Published 2012 by John Wiley & Sons, Inc.
23
24 RETENTION PROCESSES IN ION-EXCLUSION CHROMATOGRAPHY: A NEW PERSPECTIVE
an analyte is influenced by a large number of parameters. These include: the degree
of ionization of the analyte [11], the molecular size and structure of the analyte
[12–14], the eluent concentration and its pH value [15,16], the presence of organic
solvents in the eluent [17,18], the ionic strength of the eluent [19,20], the temperature
of the column [10,21,22], the material comprising the ion-exchanger used and its
hydrophobicity [23], the type of ion-exchange functional group on the stationary phase
[20], the degree of cross-linking of the polymer used in the stationary phase [11], the
ion-exchange capacity [24], and the ionic form of the resin [14].
According to the currently accepted theory, the mechanism of IEC can be repre-
sented schematically as in Figure 2.1. The analytical column used in IEC separations of
anionic analytes is usually packed with fully sulfonated (typical total cation-exchange
capacity of approx. 5.4 meq/g of dry resin) polystyrene-divinylbenzene (PS-DVB)
co-polymer (usually 8% cross-linked) of an average diameter of approximately 7 μm.
[Fully sulfonated means that there is one sulfonic group attached to each aromatic
ring.] In the case where cationic analytes are to be separated, the resin is usually fully
functionalized with quaternary ammonium groups. For simplicity, only IEC of anions
is considered further in this chapter. That is, the stationary phase will be assumed to
be a fully sulfonated resin.
The current mechanism of IEC proposes that the sulfonate groups are fixed mostly
on the surface of the PS-DVB resin and form a negatively charged shield on the poly-
meric surface, often referred to as the “Donnan membrane”. The interior of the resin
contains some occluded, or trapped, eluent, which is considered to act as the station-
ary phase. There is no general agreement regarding the precise morphology of this
occluded eluent, but for the retention mechanism to be operative, this eluent liquid
must be physically trapped within the polymer network and remain stationary. For
convenience, we will refer to this eluent as being contained in “pores”, but use of
this term does not imply that a physical pore exists in the polymeric structure. For
example, the eluent liquid might be trapped within a loose network of polymer chains.
Eluent Phase
Occluded liquid
Donnan membrane
H
+
A
−
H
+
H
+
H
+
H
+
HA
HA
HA
HA
HA
HA
A
−
A
−
A
−
Resin phase
−
−
−
−
−
−
−
−
−
−
−
−
−
−
−
−
−
−
−
−
−
−
−
−
−
−
−
−
−
−
−
−
−
−
−
Figure 2.1. Schematic representation of the current ion-exclusion chromatography separation
mechanism based on Donnan exclusion effects.
DEFICIENCIES OF THE CURRENT IEC SEPARATION MECHANISM 25
The interstitial fraction of the eluent moves outside the pores and constitutes the car-
rier stream for the injected analytes. The Donnan membrane separates the moving
fraction of the eluent (i.e. the mobile phase) from the static, occluded component of
the eluent (i.e. the stationary phase). Once the analytes enter the column, they interact
with the sulfonated PS-DVB co-polymer in such a way that the dissociated fraction
of the analyte is repelled from the vicinity of the Donnan membrane into the bulk
of the interstitial eluent, while the protonated fraction penetrates the membrane and
enters the occluded fraction of the eluent, where it may experience additional retention
by surface adsorption onto the unfunctionalized parts of the resin [25–28]. The higher
the pKa of an individual acid, the higher the protonated fraction and consequently the
longer its retention time. Anomalies for analyte acids showing significantly different
retention times but having almost identical pKa values have been explained by the
increased hydrophobic character of some acids which leads to increased hydrophobic
adsorption.
We will critically examine some of these concepts using experimental data based
predominantly on conversion of the stationary phase from the eluent form to the
analyte form and vice-versa. These data are used to indicate some potential shortcom-
ings of the current retention mechanism and will lead to the suggestion of a possible
alternative mechanism.
2.2 DEFICIENCIES OF THE CURRENT IEC SEPARATION MECHANISM
In the current IEC mechanism, negative charge originating from sulfonate groups
bound covalently to the resin are considered to form a Donnan membrane which acts
as a “filter” to resist the passage of negatively charged analytes into the occluded
eluent comprising the stationary phase. It is customary to consider only the analyte
as carrying an average charge determined by the equilibrium existing between the
protonated and dissociated forms. The average negative charge on the analyte (given
by the relative concentrations of the protonated and deprotonated [dissociated] forms)
then determines the extent to which the analyte cloud as a whole is repelled by the
Donnan membrane.
Prolonged retention times of some long chain aliphatic carboxylic acids having
almost the same pKa values as shorter chained species are explained currently as a
consequence of the increased hydrophobic character of the longer chain aliphatic acids
and their subsequent hydrophobic interaction with the PS-DVB resin. In the case of
aromatic acids, strong π –π interactions with the PS-DVB resin are also proposed to
contribute significantly to retention. For example, benzoic acid (pKa = 4.00) shows a
very much longer retention time than acetic acid (pKa = 4.56). In both of the above
cases, the analyte is assumed to come into direct contact with the resin, but it is not
stated specifically whether this contact occurs inside the pores or elsewhere on the
resin. This explanation becomes questionable in terms of two aspects. First, the number
of sites for hydrophobic adsorption on a fully sulfonated polymer of high ion-exchange
capacity is likely to be small. Second, poor peak shapes (namely, strongly tailed peaks)
should be evident for analytes which are retained by hydrophobic adsorption in the
26 RETENTION PROCESSES IN ION-EXCLUSION CHROMATOGRAPHY: A NEW PERSPECTIVE
fully aqueous eluents used typically in IEC. However, almost all analytes (including
aromatic acids) show strong peak fronting when water is used as the eluent, while
when an aqueous acidic eluent is used, those analytes having strong retention in IEC
normally show symmetrical peaks.
The current IEC separation mechanism is based on the penetration of the Donnan
membrane by the analyte into the pores of the fully functionalized PS-DVB resin. The
mass-transfer for this process is driven only by diffusion resulting from the concentra-
tion gradient existing between the two liquid phases and there is no identifiable peak
re-focusing mechanism which can counteract the diffusional broadening. This sug-
gests the likelihood of broad peaks, but peaks in IEC generally show good separation
efficiencies.
There are some other phenomena occurring in IEC, the origins of which are not
readily apparent from current theory. These include the appearance of system peaks,
temperature effects on retention, the ability to perform indirect spectrophotometric
detection [29–31], and the ability to perform vacancy ion-exclusion chromatography
wherein the sample is used as eluent and water is injected as sample [32,33].
2.2.1 Dynamic Column Capacity
The active ingredients in typical acidic IEC eluents can be broadly classified as strong
mineral acids (sulfuric acid, hydrochloric acid, etc.) or weaker acids having Ka values
usually less than 0.01. Interesting behavior occurs when breakthrough experiments
are conducted to convert a column from the water form to the acid eluent form and
vice-versa [34], as shown in Figures 2.2 and 2.3. Figure 2.2a shows the conversion
of the column from the water form into the sulfuric acid form, while Figure 2.2b
shows the same data for acetic acid. As can be seen in Figure 2.2a, the time for
conversion of the column from the water form to the sulfuric acid form was relatively
short (approx. 5 min), reflecting the relatively low dynamic capacity of the column
towards sulfuric acid in the tested concentration range. Figure 2.3a shows the reverse
interconversion process. The column conversion from the water form to the acetic acid
form (Figure 2.2b) and also the reverse process (Figure 2.3b) were significantly longer
than in the case of sulfuric acid, indicating that the column showed significantly higher
dynamic capacity for acetic acid than for sulfuric acid (by approx. a factor of 3).
The results presented in Figures 2.2 and 2.3 demonstrate some very important
characteristics of a fully sulfonated microporous IEC stationary phase:
(i) The total capacity of the stationary phase (measured as the number of meq. of
the eluent species retained and able to be replaced by water) increased with
the pKa value of the active eluent component.
(ii) The detector response obtained during the complete back-conversion to the
water form (e.g., from 0 to 4 min in Figure 2.3a and 0 to 11 min in Figure 2.3b)
was constant and was identical to the detector response occurring after the same
eluent had been used to equilibrate the column from the water form. That is,
the stationary phase fully loaded with the eluent acid released this acid at a
concentration identical to that which had been used to load it.