TECHNOLOGIES AND APPROACHES TO REDUCING THE FUEL CONSUMPTION OF MEDIUM- AND HEAVY-DUTY VEHICLES docx
Bạn đang xem bản rút gọn của tài liệu. Xem và tải ngay bản đầy đủ của tài liệu tại đây (11.96 MB, 251 trang )
Committee to Assess Fuel Economy Technologies for
Medium- and Heavy-Duty Vehicles
Board on Energy and Environmental Systems
Division on Engineering and Physical Sciences
Transportation Research Board
TECHNOLOGIES AND APPROACHES TO
REDUCING THE FUEL CONSUMPTION OF
MEDIUM- AND HEAVY-DUTY VEHICLES
THE NATIONAL ACADEMIES PRESS 500 Fifth Street, N.W. Washington, DC 20001
NOTICE: The project that is the subject of this report was approved by the Governing Board of the
National Research Council, whose members are drawn from the councils of the National Academy
of Sciences, the National Academy of Engineering, and the Institute of Medicine. The members of
the committee responsible for the report were chosen for their special competences and with regard
for appropriate balance.
This study was supported by Contract DTNH22-08-H-00222 between the National Academy of Sci-
ences and the U.S. Department of Transportation, National Highway Traffic Safety Administration.
Any opinions, findings, conclusions, or recommendations expressed in this publication are those of
the author(s) and do not necessarily reflect the views of the organizations or agencies that provided
support for the project.
International Standard Book Number-13: 978-0-309-14982-2
International Standard Book Number-10: 0-309-14982-7
Copies of this report are available in limited supply, free of charge, from:
Board on Energy and Environmental Systems
National Research Council
500 Fifth Street, N.W.
Keck W934
Washington, DC 20001
202-334-3344
Additional copies of this report are available for sale from:
The National Academies Press
500 Fifth Street, N.W.
Lockbox 285
Washington, DC 20055
(800) 624-6242 or (202) 334-3313
(in the Washington metropolitan area)
Internet:
Copyright 2010 by the National Academy of Sciences. All rights reserved.
Printed in the United States of America
The National Academy of Sciences is a private, nonprofit, self-perpetuating society of distinguished
scholars engaged in scientific and engineering research, dedicated to the furtherance of science and
technology and to their use for the general welfare. Upon the authority of the charter granted to it by
the Congress in 1863, the Academy has a mandate that requires it to advise the federal government
on scientific and technical matters. Dr. Ralph J. Cicerone is president of the National Academy of
Sciences.
The National Academy of Engineering was established in 1964, under the charter of the National
Academy of Sciences, as a parallel organization of outstanding engineers. It is autonomous in its
administration and in the selection of its members, sharing with the National Academy of Sciences
the responsibility for advising the federal government. The National Academy of Engineering also
sponsors engineering programs aimed at meeting national needs, encourages education and research,
and recognizes the superior achievements of engineers. Dr. Charles M. Vest is president of the Na-
tional Academy of Engineering.
The Institute of Medicine was established in 1970 by the National Academy of Sciences to secure
the services of eminent members of appropriate professions in the examination of policy matters
pertaining to the health of the public. The Institute acts under the responsibility given to the National
Academy of Sciences by its congressional charter to be an adviser to the federal government and,
upon its own initiative, to identify issues of medical care, research, and education. Dr. Harvey V.
Fineberg is president of the Institute of Medicine.
The National Research Council was organized by the National Academy of Sciences in 1916 to
associate the broad community of science and technology with the Academy’s purposes of furthering
knowledge and advising the federal government. Functioning in accordance with general policies
determined by the Academy, the Council has become the principal operating agency of both the Na-
tional Academy of Sciences and the National Academy of Engineering in providing services to the
government, the public, and the scientific and engineering communities. The Council is administered
jointly by both Academies and the Institute of Medicine. Dr. Ralph J. Cicerone and Dr. Charles M.
Vest are chair and vice chair, respectively, of the National Research Council.
www.national-academies.org
v
COMMITTEE TO ASSESS FUEL ECONOMY TECHNOLOGIES FOR MEDIUM- AND
HEAVY-DUTY VEHICLES
ANDREW BROWN, JR., Chair, NAE, Delphi Corporation
DENNIS N. ASSANIS, NAE, University of Michigan
ROGER BEZDEK, Management Information Services, Inc.
NIGEL N. CLARK, West Virginia University
THOMAS M. CORSI, University of Maryland
DUKE DRINKARD, Southeastern Freight Lines
DAVID E. FOSTER, University of Wisconsin
ROGER D. FRUECHTE, Consultant
RON GRAVES, Oak Ridge National Laboratory
GARRICK HU, Consultant
JOHN H. JOHNSON, Michigan Technological University
DREW KODJAK, International Council on Clean Transportation
DAVID F. MERRION, Detroit Diesel (retired)
THOMAS E. REINHART, Southwest Research Institute
AYMERIC P. ROUSSEAU, Argonne National Laboratory
CHARLES K. SALTER, Consultant
JAMES J. WINEBRAKE, Rochester Institute of Technology
JOHN WOODROOFFE, University of Michigan Transportation Research Institute
MARTIN B. ZIMMERMAN, University of Michigan
Staff
DUNCAN BROWN, Study Director
DANA CAINES, Financial Associate
LANITA JONES, Administrative Coordinator
JOSEPH MORRIS, Senior Program Officer, Transportation Research Board
JASON ORTEGO, Senior Program Assistant (until December 2009)
MADELINE WOODRUFF, Senior Program Officer
E. JONATHAN YANGER, Senior Project Assistant
JAMES J. ZUCCHETTO, Director, Board on Energy and Environmental Systems
vi
BOARD ON ENERGY AND ENVIRONMENTAL SYSTEMS
DOUGLAS CHAPIN, Chair, NAE,
1
MPR Associates, Inc., Alexandria, Virginia
RAKESH AGRAWAL, NAE, Purdue University, West Lafayette, Indiana
WILLIAM BANHOLZER, NAE, The Dow Chemical Company, Midland, Michigan
ANDREW BROWN, JR., NAE, Delphi Technologies, Troy, Michigan
MARILYN BROWN, Georgia Institute of Technology, Atlanta, Georgia
MICHAEL CORRADINI, NAE, University of Wisconsin, Madison, Wisconsin
PAUL DECOTIS, Long Island Power Authority, Long Island, NY
E. LINN DRAPER, JR., NAE, American Electric Power, Lampasas, Texas
CHRISTINE EHLIG-ECONOMIDES, NAE, Texas A&M University, College Station,
Texas
WILLIAM FRIEND, NAE, University of California Presidents Council on National
Laboratories, Washington, DC
SHERRI GOODMAN, CNA, Alexandria, Virginia
NARAIN HINGORANI, NAE, Independent Consultant, Los Altos Hills, California
MICHAEL OPPENHEIMER, Princeton University, Princeton, New Jersey
MICHAEL RAMAGE, NAE, ExxonMobil Research and Engineering Company
(retired), Moorestown, New Jersey
DAN REICHER, Google.org, Warren, Vermont
BERNARD ROBERTSON, NAE, Daimler-Chrysler (retired), Bloomfield Hills,
Michigan
MAXINE SAVITZ, NAE, Honeywell, Inc. (retired), Los Angeles, California
MARK THIEMENS, NAS,
2
University of California, San Diego
RICHARD WHITE, Oppenheimer’s Private Equity & Special Products, New York, NY
Staff
JAMES J. ZUCCHETTO, Director, Board on Energy and Environmental Systems
DUNCAN BROWN, Senior Program Officer
DANA CAINES, Financial Associate
ALAN CRANE, Senior Program Officer
K. JOHN HOLMES, Senior Program Officer
LANITA JONES, Administrative Coordinator
MADELINE WOODRUFF, Senior Program Officer
E. JONATHAN YANGER, Senior Project Assistant
1
National Academy of Engineering.
2
National Acaedemy of Science.
vii
Acknowledgments
The Committee to Assess Fuel Economy Technologies
for Medium- and Heavy-Duty Vehicles is grateful to all of
the company, agency, industry, association, and national
laboratory representatives who contributed significantly
of their time and efforts to this National Research Council
(NRC) study, either by giving presentations at meetings or
by responding to committee requests for information.
We acknowledge the valuable contributions of individu-
als and organizations that provided information and made
presentations at our meetings, as listed in Appendix B. We
especially recognize the organizations that hosted site visits
for the committee’s work as outlined in Chapter 1.
The committee was aided by consultants in various roles
who provided analyses to the committee, which it used in
addition to other sources of information. Special recognition
is afforded the TIAX team of Michael Jackson, Matthew
Kromer, and Wendy Bockholt; and the Argonne National
Laboratory team of Aymeric Rousseau, Antoine Delorme,
Dominik Karbowski, and Ram Vijayagopal.
We wish to recognize the committee members for taking
on this daunting charter and accomplishing it on schedule
within tight budget requirements. The staff of the NRC Board
on Energy and Environmental Systems has been exceptional
in organizing and planning meetings, gathering information,
and drafting sections of the report. Duncan Brown, Dana
Caines, LaNita Jones, Joseph Morris, Jason Ortego, Jonathan
Yanger, and James Zucchetto have done an outstanding job
of facilitating the work of the committee and providing their
knowledge and experience to help the committee in its delib-
erations. Lastly, the committee chair expresses his personal
appreciation to Lori Motley, Delphi executive assistant, for
her administrative support provided to this overall effort.
This report has been reviewed in draft form by individuals
chosen for their diverse perspectives and technical expertise,
in accordance with procedures approved by the NRC’s Re-
port Review Committee. The purpose of this independent
review is to provide candid and critical comments that will
assist the institution in making its published report as sound
as possible and to ensure that the report meets institutional
standards for objectivity, evidence, and responsiveness to the
study charge. The review comments and draft manuscript
remain confidential to protect the integrity of the deliberative
process.
We wish to thank the following individuals for their re-
view of this report:
Paul Blumberg, Consultant
Fred Browand, University of Southern California
Douglas Chapin, MPR Associates, Inc.
Robert Clarke, Truck Manufacturers Association
Coralie Cooper, Northeast States for Coordinated Air
Management
Joe Fleming, Consultant
Winston Harrington, Resources for the Future
John Heywood, Massachusetts Institute of Technology
Larry Howell, General Motors (retired)
Thomas Jahns, University of Wisconsin
James Kirtley, Massachusetts Institute of Technology
Priyaranjan Prasad, Ford Motor Company (retired)
Mike Roeth, Consultant
Russell Truemner, AVL Powertrain Engineering, Inc.
Although the reviewers listed above have provided many
constructive comments and suggestions, they were not asked
to endorse the conclusions or recommendations, nor did
they see the final draft of the report before its release. The
review of this report was overseen by Elisabeth Drake, NAE,
Massachusetts Institute of Technology (retired). Appointed
by the NRC, she was responsible for making certain that an
independent examination of this report was carried out in
accordance with institutional procedures and that all review
comments were carefully considered. Responsibility for the
final content of this report rests entirely with the authoring
committee and the institution.
Andrew Brown, Jr., Chair
Committee to Assess Fuel Economy Technologies
for Medium- and Heavy-Duty Vehicles
ix
Contents
SUMMARY 1
1 INTRODUCTION 9
Origin of Study and Statement of Task, 9
Policy Motivation, 10
Weight Classes and Use Categories, 12
Energy Consumption Trends and Trucking Industry Activity, 13
Factors Affecting Improvements in Fuel Consumption, 14
Task Organization and Execution, 14
Report Structure, 15
Bibliography, 15
2 VEHICLE FUNDAMENTALS, FUEL CONSUMPTION, AND EMISSIONS 17
Truck and Bus Types and Their Applications, 17
Sales of Vehicles by Class and Manufacturer, 17
Industry Structure, 19
Metrics to Determine the Fuel Efficiency of Vehicles, 20
Truck Tractive Forces and Energy Inventory, 28
Test Protocols, 28
Test-Cycle Development and Characteristics, 31
Findings and Recommendations, 39
Bibliography, 39
3 REVIEW OF CURRENT REGULATORY APPROACHES FOR TRUCKS AND CARS 41
European Approach, 41
Japanese Approach, 42
U.S. Approach: EPA Smartway Voluntary Certification Program, 43
California Regulation Based on EPA Smartway Program, 45
Light-Duty-Vehicle Fuel Economy Standards, 45
Heavy-Duty-Engine Emissions Regulations, 45
Regulatory Example from Truck Safety Brake Test and Equipment, 49
Findings, 50
References, 50
4 POWER TRAIN TECHNOLOGIES FOR REDUCING LOAD-SPECIFIC FUEL 51
CONSUMPTION
Diesel Engine Technologies, 51
Gasoline Engine Technologies, 57
Diesel Engines versus Gasoline Engines, 63
Transmission and Driveline Technologies, 65
Hybrid Power Trains, 68
x CONTENTS
Findings and Recommendations, 86
Bibliography, 87
5 VEHICLE TECHNOLOGIES FOR REDUCING LOAD-SPECIFIC FUEL 91
CONSUMPTION
Vehicle Energy Balances, 91
Aerodynamics, 92
Auxiliary Loads, 110
Rolling Resistance, 111
Vehicle Mass (Weight), 116
Idle Reduction, 120
Intelligent Vehicle Technologies, 124
Finding and Recommendations, 128
Bibliography, 129
6 COSTS AND BENEFITS OF INTEGRATING FUEL CONSUMPTION 131
REDUCTION TECHNOLOGIES INTO MEDIUM- AND HEAVY-DUTY VEHICLES
Direct Costs and Benefits, 132
Summary of Fuel Consumption and Cost Data, 146
Operating and Maintenance Costs, 149
Indirect Effects and Externalities, 149
Findings and Recommendations, 155
Bibliography, 157
7 ALTERNATIVE APPROACHES TO REDUCING FUEL CONSUMPTION IN 159
MEDIUM- AND HEAVY-DUTY VEHICLES
Overview, 159
Changing Fuel Price Signals, 159
Technology-Specific Mandates and Subsidies, 161
Alternative and Complementary Regulations, 163
Other Complementary Approaches, 168
Findings and Recommendations, 176
References, 177
8 APPROACHES TO FUEL ECONOMY AND REGULATIONS 179
Purpose and Objectives of a Regulatory Program, 179
Regulated Vehicle Types, 180
Regulated Parties, 182
Metrics for Fuel Consumption, 183
Methods for Certification and Compliance, 184
Findings and Recommendations, 189
Bibliography, 191
Annex 8-1, 192
Annex 8-2, 195
APPENDIXES
A Statement of Task 199
B Presentations and Committee Meetings 201
C Committee Biographical Sketches 204
D Abbreviations and Acronyms 211
E Fuel Economy and Fuel Consumption as Metrics to Judge the 214
Fuel Efficiency of Vehicles
F Details of Aerodynamic Trailer Device Technology 219
G Vehicle Simulation 221
H Model-Based Design 227
xi
Tables and Figures
TABLES
S-1 Range of Fuel Consumption Reduction Potential, 2015-2020, for Power Train
Technologies, 4
S-2 Range of Fuel Consumption Reduction Potential, 2015-2020, for Vehicle
Technologies, 4
S-3 Fuel Consumption Reduction Potential for Typical New Vehicles, 2015-2020, and Cost-
Effectiveness Comparisons for Seven Vehicle Configurations, 5
2-1 Comparing Light-Duty Vehicles with Medium- and Heavy-Duty Vehicles, 18
2-2 Product Ranges of U.S. Heavy-Duty Vehicle Manufacturers, 20
2-3 Top 10 Commercial Fleets in North America, 21
2-4 Top 10 Transit Bus Fleets in the United States and Canada, 21
2-5 Top 10 Motor Coach Operators, 2008, United States and Canada, 22
2-6 Medium- and Heavy-Duty-Vehicle Sales by Calendar Year, 22
2-7 Truck Sales, by Manufacturer, 2004-2008, 23
2-8 Engines Manufactured for Class 2b Through Class 8 Trucks, 2004-2008, 23
2-9 Vehicle, Engine, and Cycle Variables, 27
2-10 Validation, Accuracy, and Precision, 30
2-11 Characteristics of Selected Cycles, 33
3-1 Fuel Economy Vehicle Testing, 47
3-2 Stopping Distance Requirements by FMCSS 121 Regulation, 49
4-1 Diesel Engine Fuel Consumption (percentage) by Years and Applications, 59
4-2 Technologies for Fuel Consumption Reduction Applicable to Gasoline-Powered Engines
for the Medium-Duty Vehicle Class and the Estimated Fuel Consumption Reduction and
Incremental Costs, 63
4-3 Diesel Truck Sales as a Percentage of Total Truck Sales, 64
4-4 TIAX Summary of Transmission and Driveline Potential Fuel Consumption Reduction
(percentage) by Range of Years and by Application, 68
4-5 Different Vehicle Architectures, Their Status as of Today and Primary Applications, 77
4-6 Production-Intent Medium-Duty and Heavy-Duty HEV Systems, No ePTO, 77
4-7 Hybrid Technology, Benefits and Added Weight for Class 3 to Class 6 Box Trucks, 77
4-8 Hybrid Technology, Benefits and Added Weight for Class 3 to Class 6 Bucket Trucks, 77
4-9 Hybrid Technology, Benefits and Added Weight for Refuse Haulers, 77
4-10 Hybrid Technology, Benefits and Added Weight for Transit Buses, 78
4-11 Characteristics of Primary Drive Cycles, 79
4-12 Profiles of Primary Drive Cycles, 79
xii TABLES AND FIGURES
4-13 Fuel Economy and Exhaust Emissions of Hybrid Electric Transit Bus with Various
Control Strategies, Taipei City Bus Cycle, 84
4-14 Predicted Fuel Consumption Comparison: Conventional (non-hybrid), Dynamic
Programming (DP), Rule-Based (RB), 85
4-15 Hybrid Fuel Consumption Reduction Potential (percentage) Compared to a Baseline
Vehicle Without a Hybrid Power Train, by Range of Years and Application, 86
4-16 Estimated Fuel Consumption Reduction Potential for Hybrid Power Trains, 86
5-1 Energy Balance for a Fully Loaded Class 8 Vehicle Operating on a Level Road at 65
mph for One Hour, 92
5-2 Energy Balance for a Fully Loaded Class 3 to Class 6 Medium-Duty Truck (26,000 lb)
Operating on a Level Road at 40 mph for One Hour, 92
5-3 Energy Balance for a 40-ft Transit Bus Operating over the Central Business District
Cycle for One Hour, 92
5-4 Operational Losses from Class 8 Tractor with Sleeper Cab-Van Trailer at 65 mph and
GVW of 80,000 lb, 92
5-5 Class 8 Tractor Aerodynamics Technologies, Considering the 2012 Time Frame, 98
5-6 Current Van Trailer Aero-Component Performance, 99
5-7 Florida Trailer Population by Body Style, 105
5-8 Motor Coach—Applicable Aerodynamic Technologies, 109
5-9 Class 2b Van and Pickup—Applicable Aerodynamic Technologies, 109
5-10 Aerodynamic-Related Fuel Consumption Reduction Packages by Sector and by Time
Frame, 110
5-11 Examples of Power Requirement for Selected Auxiliary Loads, 110
5-12 Auxiliary Use for Line-Haul Duty Cycles, 110
5-13 Results of Truck Model Showing Effect of Coefficient of Rolling Resistance, C
rr
, on
Fuel Economy for Several Drive Cycles, 113
5-14 Rolling Resistance Fuel Consumption Reduction Potential by Class, 115
5-15 Typical Weights of Trucks, Empty Versus Gross Weight, 116
5-16 Summary of Impacts of Weight on Fuel Consumption of Trucks by Class, 120
5-17 Summary of Weight-Reduction Estimates and Weight-Increase Offsets, 121
5-18 Weight-Reduction-Related Fuel Consumption Reduction Potential (percentage)
by Class, 122
5-19 Comparison of Automatic Shutdown/Startup Systems, 122
5-20 Idling-Reduction Technologies, 123
5-21 Comparison of Fuel-Operated Heaters, 123
5-22 Comparison of Auxiliary Power Units, 124
5-23 Comparison of Truck Stop Electrification Systems, 124
5-24 Comparison of Idle Reduction Systems, 125
6-1 Technologies and Vehicle Classes Likely to See Benefits, 132
6-2 Fuel Consumption Reduction (percentage) by Application and Vehicle Type, 133
6-3 Idle-Reduction Packages, 135
6-4 Technology for Class 8 Tractor Trailers in the 2015-2020 Time Frame, 135
6-5 Tractor Trailers Benefit from Advances in Every Technology Category, 135
6-6 Straight Box Truck Aerodynamic Technologies, 137
6-7 Class 3 to Class 6 Straight Box Truck with 2015-2020 Technology Package, 139
6-8 Class 3 to Class 6 Bucket Truck with 2015-2020 Technology Package, 139
6-9 Class 2b Pickups and Vans with 2015-2020 Technology Package, 141
6-10 Class 8 Refuse Packer with a Hydraulic Hybrid System, 2015-2020, 142
6-11 Transit Bus Tire and Wheel Technologies, 143
6-12 Driveline and Transmission Strategies for Transit Buses, 143
6-13 Weight Reduction Cost and Benefit for Transit Buses, 143
6-14 Results for Urban Transit Buses—Selected Sources, 144
6-15 Hybrid Technology Cost and Benefits for Transit Buses, 144
TABLES AND FIGURES xiii
6-16 Urban Transit Buses Can Benefit from Hybridization and from Weight Reduction, 144
6-17 Motor Coaches Benefit from Aerodynamics and from Engine Improvements, including
Waste-Heat Recovery, 145
6-18 Fuel Consumption Improvement, Cost, and CCPPR, 2015-2020 Vehicle Technology, 146
6-19 Fuel Consumption Improvement, Cost, and Cost-Effectiveness, 2013-2015 Vehicle
Technology, 147
6-20 Fuel Consumption Reduction Potential for Typical New Vehicles, 2015-2020, and Cost-
Effectiveness Comparisons for Seven Vehicle Configurations, 148
6-21 Motor Carrier Marginal Expenses, 149
6-22 Incremental Operations and Maintenance Costs, 149
6-23 Fuel Efficiency Technology Versus NO
x
Emissions Trade-off, 153
6-24 Estimated Costs for Crashes Involving Truck Tractor with One Trailer, 2006, 154
6-25 Summary of Potential Fuel Consumption Reduction, Cost, and Cost-Benefit, 156
7-1 Some Illustrative Projections of Fuel Consumption Savings, 165
8-1 Mileage and Fuel Consumption by Vehicle Weight Class, 180
8-2 Advantages and Disadvantages of Each Choice of Regulated Party, 183
8-3 Options for Certification of Heavy-Duty Vehicles to a Standard, 185
E-1 Gross Vehicle Weight Groups, 216
E-2 Average Payload (lb) by Commodities and Gross Vehicle Weight Group VIUS—
National, 217
E-3 Vehicle Groups and National Average Payload (lb), 218
F-1 Trailer Skirt Information from Manufacturers, 219
F-2 Trailer Base Device Information from Manufacturers, 220
F-3 Trailer Face Device Information from Manufacturers, 220
G-1 Main Vectors for Component Models, 221
FIGURES
S-1 Comparison of 2015-2020 new-vehicle potential fuel-saving technologies for seven
vehicle types, 4
1-1 Energy consumption by major source end-use sector, 1949-2008, 10
1-2 Motor vehicle mileage, fuel consumption, and fuel rates, 11
1-3 U.S average payload-specific fuel consumption, 12
1-4 Illustrations of typical vehicle weight classes, 13
1-5 Total revenue of for-hire transportation services compared with total revenue of other
sectors of the transportation industry, 2002, 14
2-1
The 25 largest private and for-hire fleets, 19
2-2 Fuel consumption (FC) versus fuel economy (FE), showing the effect of a 50 percent
decrease in FC and a 100 percent increase in FE for various values of FE, including fuel
saved over 10,000 miles, 24
2-3 Percentage fuel consumption (FC) decrease versus percentage fuel economy (FE)
increase, 25
2-4 Fuel economy versus payload, 26
2-5 Fuel consumption versus payload, 26
2-6 Load-specific fuel consumption versus payload, 27
2-7 Energy “loss” range of vehicle attributes as impacted by duty cycle, on a level road, 29
2-8 The Heavy-Duty Urban Dynamometer Driving Schedule, 31
2-9 The creep (top) and cruise (bottom) modes of the HHDDT Schedule, 32
xiv TABLES AND FIGURES
2-10 Central Business District segment of SAE Recommended Practice J1376, 33
2-11 Orange County Transit Authority cycle derived from transit bus activity data, 33
2-12 PSAT simulation results for steady-state operation and for selected transient test cycles
for a Class 8 truck (top) and a Class 6 truck (bottom), 34
2-13 Standard deviation of speed changes (coefficient of variance rises) as the average speed
drops for typical bus activity, 35
2-14 Percentage of time spent idling rises and there are more stops per unit distance as the
average speed drops for typical bus activity, 35
2-15 Curves based on chassis dynamometer for fuel economy versus average speed for
conventional and hybrid buses, 36
2-16 “V” diagram for software development, 38
3-1 Overview of simulation tool and methodology proposed for use in the
European Union, 42
3-2 Japanese fuel economy targets for heavy-duty vehicles by weight class, 43
3-3 Japanese simulation method incorporating urban and interurban driving modes, 43
3-4 Japanese simulation method overview, 44
3-5 Japanese hardware-in-the-loop simulation (HILS) testing of hybrid vehicles,
3-6 EPA’s SmartWay logos, 45
3-7 Some of the aerodynamic technologies included in the SmartWay certification
program, 45
3-8 FTP speed (top) and torque (bottom) from a specific engine following the transient FTP
on a dynamometer, 48
4-1 Energy audit for a typical diesel engine, 52
4-2 Historical trend of heavy-duty truck engine fuel consumption as a function of NO
x
requirement, 55
4-3 Research roadmap for 49.1 percent thermal efficiency by 2016, 58
4-4 Research roadmap for 52.9 percent thermal efficiency by 2019, 59
4-5 Partitioning of the fuel energy in a gasoline-fueled engine, 60
4-6 Power density versus energy density of various technologies, 70
4-7 Series hybrid electric vehicle, 70
4-8 Series engine hybrid hydraulic vehicle, 71
4-9 Parallel hybrid electric vehicle, 72
4-10 Example of integrated starter generator configuration coupled through a belt, 72
4-11 Example of pre-transmission parallel configuration, 72
4-12 Example of post-transmission configuration, 73
4-13 Parallel hydraulic launch assist hybrid architecture, 73
4-14 Power-split hybrid electric vehicle, 73
4-15 Battery type versus specific power and energy, 75
4-16 Li-ion status versus targets (for power-assist HEV), 76
4-17 Hybrid configurations considered in ANL study, 79
4-18 Fuel savings with respect to conventional cycles on standard drive cycles under (left) a
50 percent load and (right) a 100 percent load, 80
4-19 Percentage of braking energy recovered at the wheels under (left) a 50 percent load and
(right) a 100 percent load, 80
4-20 Percentage average engine efficiency of conventional and hybrid trucks for (left) a 50
percent load and (right) a 100 percent load on standard cycles, 80
4-21 HHDDT 65 cycle repeated five times with stops (left) and without stops (right), 81
4-22 Fuel consumption reduction due to stop removal, with respect to conventional vehicles
without stops, and with respect to conventional vehicles with stops (50 percent load on
the left, 100 percent load on the right), 81
4-23 Representation of the grades considered, 82
4-24 Fuel savings of hybrid trucks with respect to conventional trucks as a function of
maximum grade for various hill periods; (left) 50 percent load and (right) 100 percent
load, 82
TABLES AND FIGURES xv
4-25 Dynamic programming process and rule extraction from the result, 85
4-26 Implementing dynamic programming as a rule-based algorithm in SIMULINK, 85
5-1 Energy balance of a fully loaded Class 8 tractor-trailer on a level road at 65 mph,
representing the losses shown in Table 5-1, 91
5-2 University of Maryland, streamlined tractor, closed gap, three-quarter trailer skirt, full
boat tail, 93
5-3 National Research Council of Canada: smoke pictures, cab with deflector (right), 93
5-4 Kenworth 1985 T600 aerodynamic tractor, 94
5-5 Aerodynamic sleeper tractor aerodynamic feature identification, 94
5-6 2009 model year Mack Pinnacle (left) and Freightliner Cascadia (right) SmartWay
specification trucks, 96
5-7 Aerodynamic and tire power losses for tractor-van trailer combination, 96
5-8 Tractor-trailer combination truck showing aerodynamic losses and areas of energy-
saving opportunities, 97
5-9 Volvo full sleeper cab (left) and day cab (right), 97
5-10 Peterbilt Traditional Model 389 (left) and Aerodynamic Model 387 2 (right)
(SmartWay), 99
5-11 ATDynamics trailer tail (left) and FreightWing trailer skirt (right), 101
5-12 Nose cone trailer “eyebrow,” 101
5-13 Laydon vortex stabilizer (left) and nose fairing (right), 101
5-14 Trailer bogie cover, 102
5-15 Summary of trailer aerodynamic device fuel consumption reduction, 102
5-16 Drag coefficient for aerodynamic tractor with single or double trailers, 104
5-17 Laydon double trailer arrangement with trailer skirts and vortex stabilizers on both
trailers, 104
5-18 Refrigerated van trailer with Freight Wing skirts, 106
5-19 Freight Wing skirts on flatbed trailer, 106
5-20 New 40-ft-long container built by TRS Containers (left) and container chassis
(right), 106
5-21 Container chassis with Freight Wing trailer skirt, 106
5-22 Tank trailer with Freight Wing skirts, 106
5-23 Sturdy-Lite curtain side design for flatbed trailers, 107
5-24 Walmart’s 2008 low fuel consumption tractor trailer, 107
5-25 Mack truck with aerodynamic device combination, 108
5-26 Nose Cone fairing on face of straight truck, 108
5-27 Laydon skirt on straight truck, 109
5-28 Rolling resistance technology, 1910-2002, 112
5-29 New-generation wide-base single tire (right) to reduce the rolling resistance of
conventional dual tires (left), 112
5-30 Example rolling resistance coefficients for heavy-duty truck tires, 113
5-31 Tractor-trailer tandem-axle misalignment conditions, 114
5-32 Weight distribution of major component categories in Class 8 tractors, 117
5-33 Typical weights of specific components in Class 8 sleeper tractors, 117
5-34 Truck weight distribution, 118
5-35 Truck weight distribution from 2008 weigh-in-motion, 118
5-36 Truck weight versus trip frequency for six trucks of a single fleet operator, 119
5-37 Effect of weight on truck fuel economy for a monitored fleet of six trucks with
combination of dual and wide single tires for a variety of drive routes, 119
5-38 Weight reduction opportunities with aluminum, 121
6-1 Comparison of 2015-2020 new-vehicle potential fuel-saving technologies for seven
vehicle types, 132
6-2 New retail Class 8 truck sales, 1990-2007, 151
xvi TABLES AND FIGURES
7-1 Five-axle tractor-semi vehicle-miles traveled by operating weight (cumulative
percentage), 165
7-2 U.S. national ITS architecture, 168
7-3 Example of truck-only lanes, 171
7-4 Concept for reducing the need for additional road right-of-way,172
7-5 Elevated truck lanes, 172
8-1 Shared responsibility for major elements that affect heavy-duty-vehicle fuel
efficiency, 180
8-2 Illustration of diversity of trailer and power unit (tractor) options, 181
8-3 Identical tractors used to pull trailers of different mass capacity but identical volume
capacity, 184
8-4 CIL test of a hybrid vehicle power train to determine vehicle fuel consumption on a
specific test route, 187
8-2-1 Identical GVW rated straight trucks for high- and low-density commodities, 196
8-2-2 Options for performance metrics, 196
E-1 Fuel consumption (FC) versus fuel economy (FE) (upper half of figure) and slope of
FC/FE curve (lower half of figure), 215
G-1 Vehicle modeling tool requirements, 222
G-2 Different nomenclatures within each company currently make model exchange very
difficult, 225
H-1 V diagram for software development, 228
H-2 Different levels of modeling required throughout the model-based design process, 228
H-3 Simulation, 229
H-4 Rapid control prototyping, 229
H-5 On-target rapid prototyping, 229
H-6 Production code generation, 229
H-7 Software-in-the-loop, 229
H-8 Processor-in-the-loop, 229
H-9 Hardware-in-the-loop, 230
H-10 Engine on dynamometer, 230
H-11 Battery connected to a DC power source, 231
H-12 Several components in the loop—MATT example, 231
H-13 Mixing components hardware and software—MATT example, 231
H-14 Example of potential process use, 232
H-15 Mean particulate matter results with two standard deviation error bars, 233
H-16 Main phases requiring standardized processes, 234
1
Summary
Liquid fuel consumption by medium- and heavy-duty
vehicles (MHDVs) represents 26 percent of all U.S. liq-
uid transportation fuels consumed and has increased more
rapidly—in both absolute and percentage terms—than
consumption by other sectors. In early recognition of these
trends, which are forecast to continue until 2035 (DOE, EIA,
2009), the Energy Independence and Security Act of 2007
(EISA; Public Law 110-140, Dec. 19, 2007), Section 108,
was passed, requiring the U.S. Department of Transportation
(DOT), for the first time in history, to establish fuel economy
standards for MHDVs. In December 2009 the U.S. Envi-
ronmental Protection Agency (EPA) formally declared that
greenhouse gas (GHG) emissions endanger public health and
the environment within the meaning of the Clean Air Act, a
decision that compels EPA to consider establishing first-ever
GHG emission standards for new motor vehicles, including
MHDVs. If the United States is to reduce its reliance on
foreign sources of oil, and reduce GHG emissions from the
transportation sector, it is important to consider how the fuel
consumption of MHDVs can be reduced.
Following the passage of EISA, the National Research
Council appointed the Committee to Assess Fuel Economy
Technologies for Medium- and Heavy-Duty Vehicles.
The committee considered approaches to measuring fuel
economy (the committee uses fuel consumption), assessed
current and future technologies for reducing fuel consump-
tion, addressed how such technologies may be practically
implemented in vehicles, discussed the pros and cons of ap-
proaches to improving the fuel efficiency of moving goods as
opposed to setting vehicle fuel consumption standards, and
identified potential costs and other impacts on the operation
of MHDVs (see Chapter 1 and Appendix A for the complete
statement of task).
The legislation also requires DOT’s National Highway
Traffic Safety Administration (NHTSA) to conduct its own
study on the fuel consumption of commercial medium- and
heavy-duty highway vehicles and work trucks and then to
establish a rulemaking to implement a commercial medium-
and heavy-duty on-highway and work-truck fuel efficiency
improvement program.
The organization of this Summary follows that of the
report’s chapters: Chapter 1 provides background; Chapter 2
provides vehicle fundamentals; Chapter 3 surveys the current
U.S., European, and Asian approaches to fuel economy and
regulations; Chapters 4 and 5 review and assess technologies
to reduce fuel consumption; Chapter 6 assesses direct and
indirect costs and benefits of integrating fuel consumption
reduction technologies into vehicles; Chapter 7 presents a
review of potential unintended consequences and the alter-
native nontechnology approaches to reducing fuel consump-
tion; and Chapter 8 reviews options for regulatory design.
The Summary presents the committee’s major findings and
recommendations from each chapter; fuller discussion and
additional findings are found in the report.
VEHICLE FUNDAMENTALS, FUEL CONSUMPTION,
AND EMISSIONS
Medium- and heavy-duty trucks, motor coaches, and tran-
sit buses, Class 2b through Class 8, are used in every sector
of the economy. The purposes of these vehicles range from
carrying passengers to moving goods. For some vehicles and
driving cycles this simple relationship breaks down (as with a
bucket truck, which carries one or two passengers but deliv-
ers no freight). It brings services and capability (the bucket,
tools, and spare parts) to a job site. This results in a broad
range of varying duty cycles, from high-speed operation on
highways with few stops to lower-speed urban operation
with many stops per mile. For the purposes of estimating fuel
consumption benefits of various technologies in this report,
the committee examined seven different types of vehicles
and made assumptions about the duty cycles that would
characterize their operations: (1) tractor trailer, (2) Class
6 box truck, (3) Class 6 bucket truck, (4) refuse truck, (5)
transit bus, (6) motor coach, and (7) pickup/van. When DOT
promulgates standards for fuel consumption, it will have to
2 TECHNOLOGIES AND APPROACHES TO REDUCING THE FUEL CONSUMPTION OF MEDIUM- AND HEAVY-DUTY VEHICLES
address the duty cycles that characterize different types of
vehicles and their wide range of applications.
The fundamental engineering metric for measuring the
fuel efficiency of a vehicle is fuel consumption, the amount
of fuel used, assuming some standard duty or driving cycle,
to deliver a given transportation service, for example, the
amount of fuel a vehicle needs to go a mile or the amount
of fuel needed to transport a ton of goods a mile. For light-
duty vehicles (cars and light trucks), the corporate average
fuel economy (CAFE) program uses miles per gallon (mpg).
This measure, although derived from measurements of fuel
consumption in gallons/mile, is not the appropriate measure
for MHDVs, since these vehicles are designed to carry loads
in an efficient and timely manner. A partially loaded tractor
trailer would consume less fuel per mile than a fully loaded
truck, but this would not be an accurate measure of the fuel
efficiency of moving goods. However, normalizing fuel con-
sumption by the payload and using the calculation of gallon/
ton-mile—the load-specific fuel consumption (LSFC)—the
fully loaded truck would have a much lower LSFC number
than the partially loaded truck, reflecting the ability of the
truck to accomplish the task of delivering goods.
Major Findings and Recommendations—
Chapters 1 and 2: Introduction and Fundamentals
Finding 2-1. Fuel consumption (fuel used per distance trav-
eled; e.g., gallons per mile) has been shown to be the funda-
mental metric to properly judge fuel efficiency improvements
from both engineering and regulatory viewpoints, including
yearly fuel savings for different technology vehicles.
Finding 2-2. The relationship between the percent improve-
ment in fuel economy (FE) and the percent reduction in fuel
consumption (FC) is nonlinear; e.g., a 10 percent increase in
FE (miles per gallon) corresponds to a 9.1 percent decrease
in FC, whereas a 100 percent increase in FE corresponds
to a 50 percent decrease in FC. This nonlinearity leads to
widespread consumer confusion as to the fuel-savings po-
tential of the various technologies, especially at low absolute
values of FE.
Finding 2-3. MHDVs are designed as load-carrying ve-
hicles, and consequently their most meaningful metric of
fuel efficiency will be in relation to the work performed,
such as fuel consumption per unit payload carried, which
is load-specific fuel consumption (LSFC). Methods to in-
crease payload may be combined with technology to reduce
fuel consumption to improve LSFC. Future standards might
require different values to accurately reflect the applications
of the various vehicle classes (e.g., buses, utility, line haul,
pickup, and delivery).
Recommendation 2-1. Any regulation of medium- and
heavy-duty vehicle fuel consumption should use LSFC as the
metric and be based on using an average (or typical) payload
based on national data representative of the classes and duty
cycle of the vehicle. Standards might require different values
of LSFC due to the various functions of the vehicle classes
e.g., buses, utility, line haul, pickup, and delivery. Regula-
tors need to use a common procedure to develop baseline
LSFC data for various applications, to determine if separate
standards are required for different vehicles that have a com-
mon function. Any data reporting or labeling should state an
LSFC value at specified tons of payload.
COMPARING THE REGULATORY APPROACHES
OF THE UNITED STATES, JAPAN, AND EUROPEAN
COMMUNITY
Although a CAFE regulatory program has been imple-
mented for light-duty vehicles, where the responsibility for
the manufacture and certification of vehicles is well defined
and the configurations of cars and light trucks for sale are
well defined and of limited number, the MHDV world is
much more complicated. There are literally thousands of
different configurations for vehicles, including bucket trucks,
pickup trucks, garbage trucks, delivery vehicles, and long-
haul tractor trailers. Their duty cycles vary greatly. Some
stop and go every few seconds; others spend most of their
time at highway speeds. Furthermore, the party responsible
for the final truck configuration is often not well defined.
For example, a body builder (vehicle integrator) may be the
manufacturer of record, but the body builder may not design
or even specify the chassis and power train. For tractor-trailer
combinations, the tractor and trailer are always made and
often owned by different companies, and a given tractor may
pull hundreds of different trailers of different configurations
over its life. Many trucks are custom made, literally one of
a kind.
Even though the regulation of such vehicles will be much
more complicated than it is for light-duty vehicles, the barri-
ers are not insurmountable. Safety and emission regulations
have been implemented, and regulations for fuel consump-
tion in medium- and heavy-duty trucks already exist in Japan
and are under development by the European Commission.
California is building on the EPA’s SmartWay Partnership
to implement its own approach to regulating truck fuel
consumption.
Major Findings and Recommendations—
Chapter 3: Current Regulatory Approaches
Finding 3-1. Although it took years of development and
substantial effort, regulators have dealt effectively with the
diversity and complexity of the vehicle industry for cur-
rent laws on fuel consumption and emissions for light-duty
vehicles. Engine-based certification procedures have been
applied to address emissions from heavy-duty vehicles and
the myriad of nontransportation engines.
SUMMARY 3
Finding 3-2. The heavy-duty-truck fuel consumption regu-
lations in Japan, and those under consideration and study by
the European Commission, provide valuable input and expe-
rience to the U.S. plans. In Japan the complexity of MHDV
configurations and duty cycles was determined to lend itself
to the use of computer simulation as a cost-effectives means
to calculate fuel efficiency, and Japan is not using extensive
full-vehicle testing in the certification process.
TECHNOLOGIES AND COSTS OF REDUCING FUEL
CONSUMPTION
The committee has evaluated a wide range of fuel-saving
technologies for medium- and heavy-duty vehicles. Some
technologies, such as certain aerodynamic features, automat-
ed manual transmissions, and wide-base single low-rolling-
resistance tires, are already available in production. Some
of the technologies are in varying stages of development,
while others have only been studied using simulation models.
Reliable, peer-reviewed data on fuel-saving performance is
available only for a few technologies in a few applications.
As a result, the committee had to rely on information from a
wide range of sources, (e.g., information gathered from ve-
hicle manufacturers, component suppliers, research labs, and
major fleets during site visits by the committee), including
many results that have not been duplicated by other research-
ers or verified over a range of duty cycles.
There is a tendency among researchers to evaluate
technologies under conditions which are best suited to that
specific technology. This can be a serious issue in situations
where performance is strongly dependent on duty cycle, as
is the case for many of the technologies evaluated in this re-
port. One result is that the reported performance of a specific
technology may be better than what would be achieved by
the overall vehicle fleet in actual operation. Another issue
with technologies that are not fully developed is a tendency
to underestimate the problems that could emerge as the
technology matures to commercial application. Such issues
often result in implementation delays as well as a loss of
performance compared to initial projections. As a result of
these issues, some of the technologies evaluated in this report
may be available later than expected, or at a lower level of
performance than expected. Extensive additional research
would be needed to quantify these issues, and regulators will
need to allow for the fact that some technologies may not
mature as expected.
The fuel-saving technologies that are already available
on the market generally result in increased vehicle cost, and
purchasers must weigh the additional cost against the fuel
savings that will accrue. In most cases, market penetration
is low at this time. Most fuel-saving technologies that are
under development will also result in increased vehicle cost,
and in some cases, the cost increases will be substantial. As
a result, many technologies may struggle to achieve market
acceptance, despite the sometimes substantial fuel savings,
unless driven by regulation or by higher fuel prices. Power-
train technologies (for diesel engines, gasoline engines,
transmissions, and hybrids) as well as vehicle technologies
(for aerodynamics, rolling resistance, mass/weight reduc-
tion, idle reduction, and intelligent vehicles) are analyzed in
Chapters 4 and 5. Tables S-1 and S-2 provide the committee’s
estimate of the range of fuel consumption reduction that is
potentially achievable with new technologies in the period
2015 to 2020, compared to a 2008 baseline.
1
Figure S-1
provides estimates for potential fuel consumption reductions
for typical new vehicles in the 2015 to 2020 time frame.
The technologies were grouped into time periods based
on the committee’s estimate of when the technologies would
be proven and available. In practice, the timing of their in-
troduction will vary by manufacturer, based in large part on
individual company product development cycles. In order
to manage product development costs, manufacturers must
consider the overall product life cycle and the timing of new
product introductions. As a result, widespread availability
of some technologies may not occur in the time frames
shown.
The percent fuel consumption reduction (% FCR) num-
bers shown for individual technologies and other options are
not additive. For each vehicle class, the % FCR associated
with combined options is as follows:
% FCR
package
= 100 [1 – (1 – {% FCR
tech1
/100}) (1 –
{% FCR
tech2
/100}) … {(1 – {% FCR
techN
/100})]
where % FCR
techx
is the percent benefit of an individual
technology.
The major enabling technologies necessary to achieve
these reductions are hybridization, advanced diesel engines,
and aerodynamics. Hybridization is particularly important
in those applications with the stop-and-go duty cycles
characteristic of many MHDVs, such as refuse trucks and
transit buses, as well as bucket trucks. Diesel and gasoline
engine advancements are helpful in all applications and will
include continuing improvements to fuel injection systems,
emissions control, and air handling systems, in addition to
commercialization of waste heat recovery systems. Essen-
tially all Class 8 vehicles will continue with diesel engines
as the prime mover. The third major technology improvement
is total vehicle aerodynamics, especially in over-the-road
applications like tractor trailers and motor coaches. Other
technologies that will play a role in reducing fuel consump-
tion in all vehicle segments include low-rolling-resistance
tires, improved transmissions, idle-reduction technologies,
weight reduction, and driver management and coaching.
The applications of these technologies can be put into
packages and then applied to the seven types of MHDVs
analyzed. The resulting fuel consumption reduction for each
1
More information on the baseline can be found in Chapter 6 and in
TIAX (2009).
4 TECHNOLOGIES AND APPROACHES TO REDUCING THE FUEL CONSUMPTION OF MEDIUM- AND HEAVY-DUTY VEHICLES
vehicle type will be dependent on the typical vehicle applica-
tion and the typical duty cycle. The results of the packages on
fuel consumption reduction from a 2008 baseline are shown
for the 2015 to 2020 time frame in Figure S-1.
The technology packages that result in the fuel consump-
tion reduction for each application also have projected costs.
The costs are estimated assuming the technologies will be
produced at large enough volumes to achieve economies of
scale in the 2015 to 2020 time frame. The committee has also
determined several ways to measure costs versus benefits.
TABLE S-1 Range of Fuel Consumption Reduction
Potential, 2015-2020, for Power Train Technologies
Technology Fuel Consumption Reduction (%)
Diesel engines 15 to 21
Gasoline engines Up to 24
Diesel over gasoline engines 6 to 24
Improved transmissions 4 to 8
Hybrid power trains 5 to 50
NOTE: Potential fuel reductions are not additive. For each vehicle class,
the fuel consumption benefit of the combined technology packages is cal-
culated as follows: [% FCR
package
= 100 [1 – (1 – {% FCR
tech1
/100}) (1 –
{% FCR
tech2
/100)} … (1 – {% FCR
techN
/100})]. Values shown are for one set
of input assumptions. Results will vary depending on these assumptions.
TABLE S-2 Range of Fuel Consumption Reduction
Potential, 2015-2020, for Vehicle Technologies
Technology Fuel Consumption Reduction (%)
Aerodynamics 3 to 15
Auxiliary loads 1 to 2.5
Rolling resistance 4.5 to 9
Mass (weight) reduction 2 to 5
Idle reduction 5 to 9
Intelligent vehicle 8 to 15
NOTE: Potential fuel reductions are not additive. For each vehicle class,
the fuel consumption benefit of the combined technology packages is cal-
culated as follows: [% FCR
package
= 100 [1 – (1 – {% FCR
tech1
/100 }) (1 –
{% FCR
tech2
/100)} … (1 – {% FCR
techN
/100})]. Values shown are for one set
of input assumptions. Results will vary depending on these assumptions.
SOURCE: Adapted from TIAX (2009).
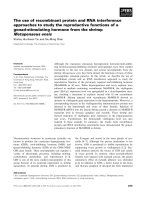
FIGURE S-1 Comparison of 2015-2020 new-vehicle potential fuel-saving technologies for seven vehicle types: tractor trailer (TT), Class 3-6
box (box), Class 3-6 bucket (bucket), Class 8 refuse (refuse), transit bus (bus), motor coach (coach), and Class 2b pickups and vans (2b).
NOTE: TIAX (2009) only evaluated the potential benefits of driver management and coaching for the tractor-trailer class of vehicles. It is
clear to the committee that other vehicle classes would also benefit from driver management and coaching, but studies showing the benefits
for specific vehicle classes are not available. For more information, see the subsection “Driver Training and Behavior” in Chapter 7. Also,
potential fuel reductions are not additive. For each vehicle class, the fuel consumption benefit of the combined technology packages is cal-
culated as follows: [% FCR
package
= 100 [1 – (1 – {% FCR
tech1
/100}) (1 – {% FCR
tech2
/100)} … (1 – {% FCR
techN
/100})]. Values shown are
for one set of input assumptions. Results will vary depending on these assumptions. SOURCE: TIAX (2009).
Figure S-1 Comparison of 2015-2020 and Class 2b pickups.eps
bitmap
The first measure, dollars per percent fuel saved, is the cost
of the technology package divided by the percent reduction
in fuel consumption. The second measure, dollars per gallon
saved per year, accounts for the fact that some vehicles are
normally driven more miles than others. The measure calcu-
lates how much it costs to save one gallon of fuel each year
for the life of the vehicle by adopting the relevant technol-
ogy. The third measure, “breakeven” fuel price, represents
the fuel price that would make the present discounted value
SUMMARY 5
of the fuel savings equal to the total costs of the technology
package applied to the vehicle class.
The breakeven fuel price shown in Table S-3 does not
necessarily reflect how vehicle buyers would evaluate tech-
nologies, because they often do not plan to own a vehicle for
its full life, they may use a different discount rate, and they
would need to consider operation and maintenance costs,
which are excluded from the calculation. However, a life-
time breakeven price is a useful metric for considering both
the private and the societal costs and benefits of regulation.
Although incomplete, the measures shown in Table S-3 are
suggestive of the differences in economic viability of the
various technology options for the indicated vehicle classes.
It is important to remember, however, that these breakeven
prices are calculated assuming that all the technologies are
applied as a package. In fact, individual fuel-saving technolo-
gies applied in a given vehicle class may face much lower
or much higher breakeven values than the aggregate figures
listed in Table S-3. For more detailed information on the
values summarized in Table S-3, see Tables 6-18 and 6-19
in Chapter 6.
The findings and recommendations below combine mate-
rial from Chapters 4 through 6 and therefore do not match
the numbering in those chapters but are presented instead as
“Finding 4/5/6-X.”
Major Findings and Recommendations—
Chapters 4, 5, and 6: Technologies and Direct Impacts
Finding 4/5/6-1. The fuel consumption reduction potential
of specific power train and vehicle technologies is extremely
dependent on application (pickup vs. tractor trailer) and duty
cycle (start-stop vs. steady state, variations in load, etc.).
Finding 4/5/6-2. Technologies vary significantly in the
cost-benefit evaluation. Some technologies are economi-
cally viable at today’s fuel prices. Others examined require
significantly higher fuel prices or correspondingly high valu-
ations of environmental and security externalities to justify
their application.
Finding 4/5/6-3. Cost per percent fuel saved is a widely
used metric for evaluating the cost/benefit of fuel-saving
technologies, and this metric is also used here. Unfortunately,
this metric can be very misleading, because it leaves out the
critical component of total annual vehicle fuel consumption.
Table S-3 shows great discrepancies between cost per percent
fuel saved and cost per gallon saved.
Recommendation 4/5/6-1. The federal government should
continue to support programs in industries, national labora-
tories, private companies, and universities to develop MHDV
technologies for reducing fuel consumption.
INDIRECT EFFECTS AND EXTERNALITIES
In addition to the direct costs and benefits associated
with the application of new technologies, there are also in-
direct costs, benefits, and externalities (impacts that are not
expressed in market terms) that should be discussed and ad-
dressed. Some of these indirect effects represent unintended
consequences associated with technologies or policies de-
signed to spur greater fuel efficiency in MHDVs. Although
it recognizes that it did not address an exhaustive list of
indirect effects, the committee emphasizes the importance
of assessment of such effects during policy development to
help avoid or mitigate negative unintended consequences.
Major Findings and Recommendations—
Chapter 6: Indirect Effects and Externalities
Finding 6-9. A number of indirect effects and unintended
consequences associated with regulations aimed at reducing
fuel consumption in the trucking sector can be important. In
particular, regulators should consider the following effects in
the development of any regulatory proposals: rate of replace-
ment of older vehicles (fleet turnover impacts), increased
ton-miles shipped due to the lower cost of shipping (rebound
effect), purchasing one class of vehicle rather than another
in response to a regulatory change (vehicle class shifting),
environmental co-benefits and costs, congestion, safety, and
incremental weight impacts.
TABLE S-3 Fuel Consumption Reduction Potential for
Typical New Vehicles, 2015-2020, and Cost-Effectiveness
Comparisons for Seven Vehicle Configurations
Vehicle Class
Fuel
Consumption
Reduction
(%)
Capital
Cost
($)
Cost-Effectiveness Metric
Dollars
per
Percent
Fuel
Saved
Dollars
per
Gallon
Saved
per Year
Breakeven
Fuel
Price
a
($/gal)
Tractor-
trailer
51 84,600 1,670 7.70 1.10
Class 6 box
truck
47 43,120 920 29.30 4.20
Class 6
bucket
truck
50 49,870 1,010 37.80 5.40
Class 2b
pickup
45 14,710 330 33.70 4.80
Refuse truck 38 50,800 1,320 18.90 2.70
Transit bus 48 250,400 5,230 48.00 6.80
Motor coach 32 36,350 1,140 11.60 1.70
NOTE: Numbers in last three columns are rounded. Also, these point es-
timates will vary depending on input assumptions. For each vehicle class,
the fuel consumption benefit of the combined technology packages is cal-
culated as follows: [% FCR
package
= 100 [1 – (1 – {% FCR
tech1
/100}) (1 –
{% FCR
tech2
/100)} … (1 – {% FCR
techN
/100})]. Values shown are for one set
of input assumptions. Results will vary depending on these assumptions.
a
Calculated assuming a 7 percent discount rate and a 10-year life, ex-
cluding incremental operating and maintenance costs associated with the
technologies.
SOURCE: Adapted from TIAX (2009).
6 TECHNOLOGIES AND APPROACHES TO REDUCING THE FUEL CONSUMPTION OF MEDIUM- AND HEAVY-DUTY VEHICLES
Finding 6-10. Consumer buying in anticipation of new
regulations (pre-buy) and retention of older vehicles can
slow the rate of fleet turnover and the rate at which regulatory
standards can affect fleet-wide fuel consumption.
Finding 6-11. Elasticity estimates vary over a wide range,
and it is not possible to calculate with a great deal of con-
fidence what the magnitude of the “rebound” effect is for
heavy-duty trucks. The rebound effect measures the increase
in ton-miles shipped resulting from a reduction in the cost of
shipping. Estimates of fuel savings from regulatory standards
will be somewhat misestimated if the “rebound” effect is not
considered.
Finding 6-12. Standards that differentially affect the capital
and operating costs of individual vehicle classes can cause
purchase of vehicles that are not optimized for particular
operating conditions. The complexity of truck use and the
variability of duty cycles increase the probability of these
unintended consequences.
Finding 6-16. Some fuel-efficiency-improving technologies
will add weight to vehicles and push those vehicles over
federal threshold weights, thereby triggering new operational
conditions and affecting, in turn, vehicle purchase decisions.
More research is needed to assess the significance of this
potential impact.
Finding 6-17. Some fuel-efficiency-improving technolo-
gies will reduce cargo capacity for trucks that are currently
“weighed-out” and will therefore force additional trucks onto
the road. More research is needed to assess the significance
of this potential impact.
Recommendation 6-1. NHTSA, in its study, should do
an economic/payback analysis based on fuel usage by ap-
plication and different fuel price scenarios. Operating and
maintenance costs should be part of any study.
ALTERNATIVE APPROACHES
There may be more effective, less costly, and comple-
mentary approaches than vehicle fuel efficiency standards
for reducing fuel consumption of MHDVs, such as training
truck drivers on best practices, adjusting size and weight re-
strictions on trucks, implementing market-based instruments
(e.g., fuel taxes), providing incentives for mode shifting,
or developing intelligent vehicle and highway systems. As
DOT/NHTSA conduct regulatory analyses of fuel efficiency
options, indirect costs and alternative approaches will have
to be identified.
Major Findings and Recommendations—Chapter 7
Finding 7-1. The committee examined a number of ap-
proaches for reducing fuel consumption in the trucking sec-
tor and found suggestive evidence that several approaches—
particularly driver training and longer combination vehicles
(LCVs)—offer potential fuel savings for the trucking sector
that rival the savings available from technology adoption for
certain vehicle classes and/or types. Any government action
taken to reduce fuel consumption in the trucking sector
should consider these alternatives.
Finding 7-2. Fuel taxes offer a transparent and efficient
method for internalizing the potential societal costs of cli-
mate change and oil imports (e.g., energy security) and re-
ducing fuel consumption in road transport. Fuel taxes operate
to make fuel-saving technologies more attractive and provide
incentives for saving fuel in operations, while involving
fewer unintended consequences than standards.
Recommendation 7-1. Although the committee recognizes
the political difficulty associated with increasing fuel taxes,
it strongly recommends that Congress consider fuel taxes
as an alternative to mandating fuel efficiency standards for
medium- and heavy-duty trucks.
Finding 7-5. A cap-and-trade system, such as is being con-
sidered by Congress that would limit total carbon dioxide
(CO
2
) emissions by primary energy producers, would have
implications for the trucking sector. Regulators would then
not need to develop standards for CO
2
emissions that apply
to specific trucks and trucking operations, avoiding the com-
plexity of different classes and duty cycles of trucks. On the
other hand, the cap-and-trade system would likely involve
new administrative burdens for monitoring emissions from
the primary producers and policing the system.
Finding 7-7. When there are several fuel-saving options
and complex truck operating conditions, performance
standards are likely to be superior to specific technology
requirements.
Finding 7-8. Increasing vehicle size and weight limits of-
fers potentially significant fuel savings for the entire tractor-
trailer combination truck fleet. This approach would need to
be weighed against increased costs of road repair. Example
case studies explored in this report demonstrate fuel savings
of up to 15 percent or more. These savings are similar in size
but independent and accumulative of other actions that may
be taken to improve fuel consumption of vehicles; therefore
the net potential benefit is substantial. To achieve these sav-
ings would require the federal government to:
• Change regulatory limits that currently restrict vehicle
weight to 80,000 lb and that freeze LCV operations on
the Federal Interstate System.
• Establish a regulatory structure that assures safety and
compatibility with the infrastructure. One possible
regulatory structure has been proposed by the Trans-
portation Research Board in Regulation of Weights,
SUMMARY 7
Lengths, and Widths of Commercial Motor Vehicles,
Special Report 267 (TRB, 2002).
• Consider the necessary changes that would be re-
quired to permit reasonable access of LCVs to vehicle
breakdown yards and major shipping facilities in close
proximity to the interstate.
Recommendation 7-2. Congress should give serious con-
sideration to liberalizing weight and size restrictions and
should consider how the potential fuel savings and other
benefits of such liberalization can be realized in a way that
maintains safety and minimizes the cost of potential infra-
structure changes.
Finding 7-10. Intelligent transportation systems enable
more efficient use of the existing roadway system by improv-
ing traffic flow and reducing or avoiding congestion.
Finding 7-12. There are significant opportunities for sav-
ings in fuel, equipment, maintenance, and labor when driv-
ers are trained properly. Indications are that this could be
one of the most cost-effective and best ways to reduce fuel
consumption and improve the productivity of the trucking
sector. For example, cases evaluated herein demonstrate
potential fuel savings of ~2 to 17 percent with appropriately
trained drivers.
Recommendation 7-3. The federal government should
encourage and incentivize the dissemination of information
related to the relationship between driving behavior and fuel
savings. For example, one step in this direction could be to
establish a curriculum and process for certifying fuel-saving
driving techniques as part of commercial driver license
certification and to regularly evaluate the effects of such a
curriculum.
APPROACHES TO FUEL CONSUMPTION REDUCTION
AND REGULATIONS
This is an important juncture for the nation. The choices
that will be made over the course of the next few years will
establish the regulatory design for MHDV fuel consumption
standards for the next several decades at least. While the strin-
gency of the standards themselves may be revisited from time
to time, the regulatory design elements (regulated parties, cer-
tification tests and procedures, compliance methods)—once
established—are far more difficult to modify.
In many cases, the commercial vehicle market is sophis-
ticated, driven by knowledgeable purchasers who focus on
the efficiency of their operations, including the fuel costs
associated with accomplishing their tasks. Thus, one of the
most important challenges facing NHTSA is how to enhance
and improve upon the commercial trucking industry’s exist-
ing desire to maximize the fuel economy of its trucks and
fleets.
At the same time, there are commonly acknowledged
characteristics in the commercial truck and buses market-
place that may be improved by a regulatory approach, such as
split incentives between owners and operators (e.g., trailers)
and the short payback period of 18 months to 2 years, that
create barriers to the adoption of efficiency technologies for
many purchasers, suggesting that a well-designed regulatory
program may yield important benefits.
Due to the complexity of the vehicle market, the commit-
tee was not able to give adequate consideration to the non-
commercial markets such as personal pickup trucks, school
buses, and personal motor homes. NHTSA should consider
these applications in its regulatory proposal.
A fundamental concern raised by the committee and
those who testified during its public sessions was the tension
between the need to set a uniform test cycle for regulatory
purposes and existing industry practices of seeking to mini-
mize fuel consumption of medium- and heavy-duty vehicles
designed for specific routes that may include grades, loads,
work tasks, or speeds inconsistent with the regulatory test
cycle. This concern emphasizes the critical importance of
achieving fidelity between certification values and real-world
results, in order to avoid driving decisions that hurt rather
than help real-world fuel consumption.
Because regulations can lead to unintended consequences,
either because the variability of tasks within a vehicle class
is not adequately dealt with or because regulations may lead
to distortions between classes in the costs of accomplishing
similar tasks, the committee urges NHTSA to carefully con-
sider all factors when developing its regulatory proposal.
Major Finding and Recommendations—Chapter 8
Finding 8-1. While it may seem expedient to focus initially
on those classes of vehicles with the largest fuel consump-
tion (i.e., Class 8, Class 6, and Class 2b, which together
account for approximately 90 percent of fuel consumption
of MHDVs), the committee believes that selectively regulat-
ing only certain vehicle classes would lead to very serious
unintended consequences and would compromise the intent
of the regulation. Within vehicle classes, there may be certain
subclasses of vehicles (e.g., fire trucks) that could be exempt
from the regulation without creating market distortions.
Finding 8-2. Large original equipment manufacturers
(OEMs), which have significant engineering capability, de-
sign and manufacture almost all Class 2b, 3, and 8b vehicles.
Small companies with limited engineering resources make
a significant percentage of vehicles in Classes 4 through 8a,
although in many cases they buy the complete chassis from
larger OEMs. Regulators will need to take the limitations of
these smaller companies into account.
Finding 8-3. Commercial trailers are produced by a separate
group of manufacturers that are not associated with truck
8 TECHNOLOGIES AND APPROACHES TO REDUCING THE FUEL CONSUMPTION OF MEDIUM- AND HEAVY-DUTY VEHICLES
manufacturers. Trailers, which present an important op-
portunity for fuel consumption reduction, can benefit from
improvements in aerodynamics and tires.
Recommendation 8-1. When NHTSA regulates, it should
regulate the final-stage vehicle manufacturers since they have
the greatest control over the design of the vehicle and its
major subsystems that affect fuel consumption. Component
manufacturers will have to provide consistent component
performance data. As the components are generally tested at
this time, there is a need for a standardized test protocol and
safeguards for the confidentiality of the data and information.
It may be necessary for the vehicle manufacturers to provide
the same level of data to the tier suppliers of the engines,
transmissions, and after-treatment and hybrid systems.
Recommendation 8-3. NHTSA should establish fuel con-
sumption metrics tied to the task associated with a particular
type of MHDV and set targets based on potential improve-
ments in vehicle efficiency and vehicle or trailer changes to
increase cargo-carrying capacity. NHTSA should determine
whether a system of standards for full but lightly loaded
(cubed-out) vehicles can be developed using only the LSFC
metric or whether these vehicles need a different metric to
properly measure fuel efficiency without compromising the
design of the vehicles.
Finding 8-7. Some certification and compliance methods
seem more practical than others, and the committee ac-
knowledges that there may be other options or variations
that have yet to be identified. Regulating total vehicle fuel
consumption of MHDVs will be a formidable task due to the
complexity of the fleet, the various work tasks performed,
and the variations in fuel-consumption-related technologies
within given classes, including vehicles of the same model
and manufacturer.
Finding 8-9. Using the process and results from existing
engine dynamometer testing for criteria emissions to certify
fuel economy standards for MHDVs would build on proven,
accurate, and repeatable methods and put less additional
administrative burden on the industry. However, to account
for the fuel consumption benefits of hybrid power trains and
transmission technology, the present engine-only tests for
emissions certification will need to be augmented with other
power train components added to the engine test cell, either
as real hardware or as simulated components. Similarly, the
vehicle attributes (aerodynamics, tires, mass) will need to
be accounted for, one approach being to use vehicle-specific
prescribed loads (via models) in the test cycle. This will
require close cooperation among component manufacturers
and vehicle manufacturers.
Recommendation 8-4. Simulation modeling should be used
with component test data and additional tested inputs from
power train tests, which could lower the cost and adminis-
trative burden yet achieve the needed accuracy of results.
This is similar to the approach taken in Japan, but with the
important clarification that the program would represent all
of the parameters of the vehicle (power train, aerodynamics,
and tires) and relate fuel consumption to the vehicle task.
Finding 8-13. There is an immediate need to take the
findings and recommendations in this report and begin the
development of a regulatory approach. Significant engineer-
ing work is needed to produce an approach that results in
fuel efficiency standards that are cost-effective and that ac-
curately represent the effects of fuel-consumption-reducing
technologies. The regulations should fit into the engineering
and development cycle of the industry and provide meaning-
ful data to vehicle purchasers.
Recommendation 8-5. Congress should appropriate money
for and NHTSA should implement as soon as possible a
major engineering contract that would analyze several ac-
tual vehicles covering several applications and develop an
approach to component testing and related data collection
in conjunction with vehicle simulation modeling to arrive at
LSFC data for these vehicles. The actual vehicles should also
be tested by appropriate full-scale test procedures to confirm
the actual LSFC values and the reductions measured with
fuel consumption reduction technologies in order to validate
the evaluation method.
Recommendation 8-6. NHTSA should conduct a pilot
program to “test drive” the certification process and validate
the regulatory instrument proof of concept. It should have
these elements:
• Gain experience with certification testing, data gath-
ering, compiling, and reporting. There needs to be a
concerted effort to determine the accuracy and repeat-
ability of all the test methods and simulation strategies
that will be used with any proposed regulatory stan-
dards and a willingness to fix issues that are found.
• Gather data on fuel consumption from several repre-
sentative fleets of vehicles. This should continue to
provide a real-world check on the effectiveness of the
regulatory design on the fuel consumption of trucking
fleets in various parts of the marketplace and in various
regions of the country.
REFERENCES
DOE, EIA. 2009. Annual Energy Outlook 2010 (Preliminary). Washington,
D.C., December.
TIAX, LLC. 2009. Assessment of Fuel Economy Technologies for Medium-
and Heavy-Duty Vehicles. Final Report. Report to the National Academy
of Sciences. Cambridge, Mass. September.
TRB (Transportation Research Board). 2002. Special Report 267: Regula-
tion of Weights, Lengths, and Widths of Commercial Motor Vehicles.
Washington, D.C.: TRB.