martensitic transformation of pure iron at a grain boundary atomistic evidence for a two step kurdjumov sachs pitsch pathway
Bạn đang xem bản rút gọn của tài liệu. Xem và tải ngay bản đầy đủ của tài liệu tại đây (5.39 MB, 7 trang )
Martensitic transformation of pure iron at a grain boundary: Atomistic evidence for a
two-step Kurdjumov-Sachs–Pitsch pathway
Jerome Meiser and Herbert M. Urbassek
Citation: AIP Advances 6, 085017 (2016); doi: 10.1063/1.4961739
View online: />View Table of Contents: />Published by the American Institute of Physics
AIP ADVANCES 6, 085017 (2016)
Martensitic transformation of pure iron at a grain
boundary: Atomistic evidence for a two-step
Kurdjumov-Sachs–Pitsch pathway
Jerome Meiser and Herbert M. Urbasseka
Physics Department and Research Center OPTIMAS, University Kaiserslautern,
Erwin-Schrưdinger-Stre, D-67663 Kaiserslautern, Germany
(Received 19 July 2016; accepted 16 August 2016; published online 23 August 2016)
Using classical molecular dynamics simulations and the Meyer-Entel interaction
potential, we study the martensitic transformation pathway in a pure iron bi-crystal
containing a symmetric tilt grain boundary. Upon cooling the system from the
austenitic phase, the transformation starts with the nucleation of the martensitic
phase near the grain boundary in a plate-like arrangement. The Kurdjumov-Sachs
orientation relations are fulfilled at the plates. During further cooling, the plates
expand and merge. In contrast to the orientation relation in the plate structure, the
complete transformation proceeds via the Pitsch pathway. C 2016 Author(s). All
article content, except where otherwise noted, is licensed under a Creative
Commons Attribution (CC BY) license ( />[ />The martensitic phase transformation in iron and steel has been intensely studied as it influences many processes in the production of these materials and also in their applications.1–3 Besides experiments,4,5 molecular dynamics (MD) simulations provide important information on this
topic. Since they deliver an atomistic view on the processes occurring in the sample during the
transformation, they may be used to help understand the experimental results.6–8
MD simulations studied the martensitic transformation in pure iron9–16 and iron alloys17–21;
bulk samples as well as thin films22 and nanowires23,24 were studied. The transformation process
follows in these cases well-known orientation relationships. Based on the Bain relationship,25 the
orientation relationships proposed by Kurdjumov and Sachs (KS)26 and by Nishiyama and Wassermann27,28 could be identified in MD simulations. Another orientation relationship was found in
1959 by Pitsch in thin FeN foils by analyzing TEM diffraction experiments29; this Pitsch relationship has to our knowledge not been established in MD simulations.
In experiments, more complex transformation paths have been observed. Thus in FeMnC and
FeCrNi alloys30–32 a two-step pathway via an intermediate hcp phase was identified. Also in theoretical work, transformation processes were proposed that involve an intermediate switching between
various orientation relationships.33,34
Grain boundaries (GBs) in the austenite phase may act as nucleation sites of the martensite
phase; this feature was directly observed in electron backscatter diffraction experiments.35,36 In MD
simulations, Song and Hoyt16,37 investigated the martensitic phase transition in a polycrystalline
austenitic Fe matrix. They observed the nucleation of the martensitic phase with a predominantly
KS orientation relationship at the GB. These investigations were performed with an interatomic
interaction potential38 that features the bcc phase as the stable phase at all temperatures below the
melting point.
In the present paper, classical MD simulations are employed to study the martensitic phase
transformation in an iron bi-crystalline system containing a symmetric tilt GB. We use the MeyerEntel potential17 since it implements the phase transition between the α and γ phase with a transition temperature of 550 ± 50 K.12,14,23 In previous work it has been shown to allow for a detailed
a ; />
2158-3226/2016/6(8)/085017/6
6, 085017-1
© Author(s) 2016.
085017-2
J. Meiser and H. M. Urbassek
AIP Advances 6, 085017 (2016)
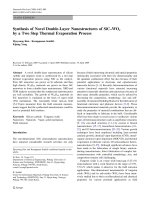
FIG. 1. Evolution of the martensitic phase transition: (a) initial sample, t = 0 ps; (b) nucleation of the new phase at 1058 ps;
(c) a state during the phase transition process showing the plate structure at 1068 ps; (d) final state displaying a twinned
martensitic structure in each of the original crystal domains. The colors denote the local crystal structure: green, bcc; dark
blue, fcc; light blue, hcp; red, unknown.
atomistic description of the transformation process.12,15,22,23,39–42 The cubic simulation box contains
two equally sized fcc crystallites which are separated by a symmetric tilt GB, see Fig. 1(a). While
we performed simulations with several tilt angles, we show here the results only for the specific
case of a 53.13◦ tilt angle, since the martensitic transformation followed the same pathway in all
cases; this tilt angle describes a Σ5 (210) GB. We denote by x the direction normal to the GB.
The z direction of the simulation box is the [001] direction of the fcc crystal structure. The sample
contains around 96000 atoms; it extends 162.8 (488.3, 14.6) Å in x ( y, z) direction. We use periodic
boundary conditions, and thus effectively study a linear array of grains separated by tilt GBs.
The system is relaxed using conjugate-gradient energy minimization and then equilibrated
for 50 ps at the starting temperature of 400 K. We note that while this temperature is below the
equilibrium transformation temperature, the transformation does not occur on the time scale of our
simulations of 1.2 ns if the system is held at this temperature. However, upon cooling the system the
transformation is induced. The simulations are performed by cooling the system by a Nose-Hoover
thermostat43,44 with a cooling rate of 0.333 K/ps; during this process we keep the pressure components in the cartesian directions constant by a barostat. The simulations are terminated at 1.2 ns,
when the crystal reached 0 K.
All calculations are performed with the open-source LAMMPS code.45 The local lattice structure is determined by common neighbor analysis (CNA).46,47 The free software tool OVITO48 is
used to visualize the local structure of the atoms.
Fig. 1 shows the evolution of the martensitic transformation. We give here a view on the x– y
plane of the sample, corresponding to an (001)fcc plane of the austenite phase before the transformation. The sample has a perfect fcc crystal structure between the two GBs, see Fig. 1(a). Upon
cooling the new phase nucleates at a temperature of 82 K at the GBs, see Fig. 1(b); this feature is
in agreement with previous findings.16 Note that the position of the GB plane is stable during the
transformation process.
In the new phase parallel arrays of plates of the martensitic crystal structure are formed with
¯ fcc plane. We note
two different plane orientations, see Fig. 1(c): the (111)fcc plane and the (111)
that the occurrence of thin martensite plates was observed experimentally in TEM images by Maki
et al.49 In our simulation, these plates widen upon cooling and grow together until the transformation from the fcc structure to the bcc structure is completed. At the places where the two bcc
variants meet, GBs are formed; these are marked as ‘unknown’ atoms in Fig. 1(d).
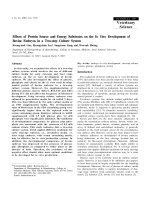
We shed light on these complex transformation processes by plotting the evolution of the
system volume and temperature in Fig. 2. The phase transformation starts when the temperature
reaches a value of 82 K, corresponding to a time of 1058 ps. After this time the volume starts
decreasing quickly while the temperature increases due to the energy dissipated in the crystals by
085017-3
J. Meiser and H. M. Urbassek
AIP Advances 6, 085017 (2016)
FIG. 2. Indicators for a two-step path: change of (a) volume and (b) temperature during the transformation. The vertical
black lines separate the two steps.
the atom re-ordering during the transformation. We can recognize that the transformation proceeds
in two steps, with a dividing line at around 1068 ps after start of the cooling process. After this
time the volume change is temporarily halted, and the temperature even starts decreasing again;
soon later the transformation process is taken up again. The entire transformation is completed after
1092 ps; it has thus taken a time of 34 ps.
We now explore in detail the orientation relationships during the two transformation steps.
¯ direction of the bcc phase are paralIn the martensitic plate structure, the (011) plane and the [111]
¯
lel to the (111) plane and the [101] direction, respectively, of the fcc phase. We denote these directions as the ‘preserved directions’, and include them in Fig. 3(a). These orientation relationships
correspond to the KS scheme,
(111)fcc ∥ (011)bcc
and
¯ fcc ∥ [111]
¯ bcc.
[101]
Let us study the equilateral triangle formed by the ⟨110⟩ directions in a (111)fcc plane, see Fig. 3(b).
During the transformation it becomes deformed, see Fig. 3(c). From theoretical considerations33,34
we expect that the three 60◦ angles of the triangle are transformed to one 70◦ angle and two 55◦
angles. Indeed we measure angles that are close to the theoretical expectations as shown in Fig. 3(c).
The crystallographic orientations before and after the complete transformation process are
shown in Fig. 3(d). The orientation relations of the Pitsch path,
¯ bcc
(001)fcc ∥ (101)
and
[110]fcc ∥ [111]bcc ,
are fulfilled. The (001) plane and the [110] direction of the fcc structure are conserved and finally
¯
transform into the (110)
plane and [111] direction of the bcc structure. Note that the close-packed
¯
[111] direction of the bcc structure is conserved both in the KS and the Pitsch path. Finally, Fig. 3(e)
demonstrates the twin character of the bcc variants formed after the complete transformation. The
GB is a (111)bcc plane in both twin crystallites and hence constitutes a twin boundary (TB).
We emphasize that the KS and the Pitsch path cannot co-exist simultaneously because the
(001)fcc plane and the [110]fcc direction are not conserved in the KS path. The (001)fcc planes
become tilted during the KS transformation process, and in the two bcc variants different tilts are
established. These are twins.
Thus we observe a Pitsch transformation executed consecutively after a KS transformation.
Such a switching between the Pitsch and the KS pathways was previously described theoretically
by Cayron.33,34 The Pitsch transformation was originally found in thin foils of Fe-Ni alloys with a
thickness of some 10 nm.29 In our case because of the periodic boundary conditions our sample has
bulk character.
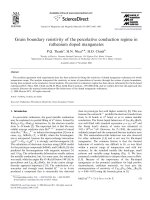
We shed further light on the working of the Pitsch transformation by studying the behavior of
individual atoms in the sample. To this end we study the (001) surface plane of the fcc structure
10 ps after the start of the transformation. Fig. 4(a) zooms into the structure after the formation of
the martensite platelets. Fig. 4(c) shows that this plane has become corrugated by the martensite
formation; the martensite plates stick out above the remaining austenite. The plane has acquired a
085017-4
J. Meiser and H. M. Urbassek
AIP Advances 6, 085017 (2016)
FIG. 3. The two steps of the transformation process: (a-c) show the KS, and (d-e) the Pitsch orientation relationship.
(a) visualizes a top view at 1068 ps on a close-packed (111)fcc plane that is transforming to a close-packed (110)bcc plane.
Arrows denote the preserved directions. (b) gives a zoom into the fcc region, and (c) into the bcc region of (a). The deformation
of the triangle formed by the close-packed fcc directions is indicated. (d) visualizes a top view on the (100)fcc plane before
and after transformation and the black atoms highlight a unit cell. (e) zooms into a (110)bcc plane in the vicinity of a twin
boundary (TB) in the fully transformed structure. The red rectangles show the unit cells of the symmetric bcc structures at
the both sides of the twin plane. The TB plane is observed to be a (111) plane for both bcc variants. The colors denote the
crystal structure as in Fig. 2.
wavy structure with the wave vector showing in the close-packed [110]fcc direction. Note that in the
¯ fcc direction.
other bcc variant that has formed, the wave vector shows in [110]
Finally, Fig. 4(b) shows the forces acting on the atoms in z direction – i.e., along the corrugation amplitude – along the line marked by the black atoms in Fig. 4(a). Atoms at the highest z
position are subject to large negative forces, i.e., in the direction opposing the further expansion of
the platelets. Atoms in the austenite phase – characterized by low z values – suffer positive forces.
This mechanical non-equilibrium situation lets the martensite phase grow laterally until the platelets
¯ bcc
merge. After completion of the transformation the original (001)fcc planes have converted to (101)
planes; the observed bcc twin structure is typical of the Pitsch transformation.29
In conclusion, the martensitic transformation follows in the vicinity of GBs a different pathway
than in the bulk. MD simulations were used repeatedly for studying the transformation path of the
085017-5
J. Meiser and H. M. Urbassek
AIP Advances 6, 085017 (2016)
FIG. 4. Atomistic behavior during the plate formation process at 1068 ps. (a) Zoom into the (001)fcc plane of the transforming
sample; the view corresponds to the lower left corner of the sample in Fig. 1(c). The black atoms are used to study the
transition behavior in (b). (b) Comparison of the z positions and the forces in z direction of the black atoms in (a). z = 0
corresponds to the original position of the atoms in the (001)fcc plane before the transformation. (c) Corrugation of the plane.
martensitic transformation in pure iron,9–11,13,14 and always showed a single pathway to be operative. Here we observe a sequential path, in which first martensitic plates are formed that follow a KS
relation; after merging of the plates the bulk material transforms according to the Pitsch path. The
generation of the plate structure naturally explains the twin structure generated in the martensite.
While the Pitsch path was originally proposed to work in thin-film geometries, i.e., close to free
surfaces, we show here that it also is operative at GBs.
ACKNOWLEDGMENTS
We acknowledge support by the Deutsche Forschungsgemeinschaft via the Sonderforschungsbereich 926. Furthermore we appreciate the computational resources provided by the compute
cluster ‘Elwetritsch’ of the University of Kaiserslautern.
1
D. A. Porter and K. E. Easterling, Phase transformations in metals and alloys, 2nd ed. (Chapman & Hall, London, 1992).
W. Pepperhoff and M. Acet, Constitution and Magnetism of Iron and its Alloys (Springer, Berlin, 2001).
3 Phase transformations in steels, edited by E. Pereloma and D. V. Edmonds, Diffusionless transformations, high strength
steels, modelling and advanced analytical techniques Vol. 2 (Woodhead Publishing Limited, Cambridge, UK, 2012).
4 G. P. Krielaart, C. M. Brakman, and S. Van der Zwaag, J. Mater. Sci. 31, 1501 (1996).
5 J. P. Rueff, M. Krisch, Y. Q. Cai, A. Kaprolat, M. Hanfland, M. Lorenzen, C. Masciovecchio, R. Verbeni, and F. Sette, Phys.
Rev. B 60, 14510 (1999).
6 Z. Yang and R. A. Johnson, Model. Simul. Mater. Sci. Eng. 1, 707 (1993).
7 C. Bos, J. Sietsma, and B. J. Thijsse, Phys. Rev. B 73, 104117 (2006).
8 H. M. Urbassek and L. Sandoval, in Phase transformations in steels, edited by E. Pereloma and D. V. Edmonds, Diffusionless
transformations, high strength steels, modelling and advanced analytical techniques Vol. 2 (Woodhead Publishing Limited,
Cambridge, UK, 2012), pp. 433–463.
2
085017-6
9
J. Meiser and H. M. Urbassek
AIP Advances 6, 085017 (2016)
S. Tateyama, Y. Shibuta, and T. Suzuki, Scr. Mater. 59, 971 (2008).
S. Tateyama, Y. Shibuta, and T. Suzuki, ISIJ Int. 50, 1211 (2010).
11 S. Tateyama, Y. Shibuta, T. Kumagai, and T. Suzuki, ISIJ Int. 51, 1710 (2011).
12 L. Sandoval, H. M. Urbassek, and P. Entel, Phys. Rev. B 80, 214108 (2009).
13 L. Sandoval and H. M. Urbassek, Appl. Phys. Lett. 95, 191909 (2009).
14 L. Sandoval, H. M. Urbassek, and P. Entel, New J. Phys. 11, 103027 (2009).
15 B. Wang and H. M. Urbassek, Phys. Rev. B 87, 104108 (2013).
16 H. Song and J. J. Hoyt, Model. Simul. Mater. Sci. Eng. 23, 085012 (2015).
17 R. Meyer and P. Entel, Phys. Rev. B 57, 5140 (1998).
18 B. Wang, E. Sak-Saracino, N. Gunkelmann, and H. M. Urbassek, Comput. Mater. Sci. 82, 399 (2014).
19 B. Wang, E. Sak-Saracino, L. Sandoval, and H. M. Urbassek, Model. Simul. Mater. Sci. Eng. 22, 045003 (2014).
20 E. Sak-Saracino and H. M. Urbassek, Eur. Phys. J. B 88, 169 (2015).
21 E. Sak-Saracino and H. M. Urbassek, Int. J. Mod. Phys. C 27, 1650124 (2016).
22 B. Wang and H. M. Urbassek, Model. Simul. Mater. Sci. Eng. 21, 085007 (2013).
23 L. Sandoval and H. M. Urbassek, Nano Lett. 9, 2290 (2009).
24 L. Sandoval and H. M. Urbassek, Nanotechnology 20, 325704 (2009).
25 E. C. Bain, Trans. AIME 70, 25 (1924).
26 G. V. Kurdjumov and G. Sachs, Z. Phys. 64, 325 (1930).
27 Z. Nishiyama, Sci. Rep. Tohoku Imp. Univ. 23, 637 (1934).
28 G. Wassermann, Arch. Eisenhüttenwes. 6, 347 (1933).
29 W. Pitsch, Philos. Mag. 4, 577 (1959).
30 K. Shimizu and Y. Tanaka, Trans. JIM 19, 685 (1978).
31 J. A. Venables, Philos. Mag. 7, 35 (1962).
32 C. Cayron, F. Barcelo, and Y. de Carlan, Acta Mater. 58, 1395 (2010).
33 C. Cayron, “One-step theory of fcc-bcc martensitic transformation,” arXiv:1211.0495 [cond-mat.mtrl-sci] (2012).
34 C. Cayron, Acta Mater. 96, 189 (2015).
35 K. Verbeken, L. BarbÉ, and D. Raabe, ISIJ Int. 49, 1601 (2009).
36 G. H. Zhang, T. Takeuchi, M. Enomoto, and Y. Adachi, Metall. Trans. A 42, 1597 (2011).
37 H. Song and J. J. Hoyt, Comput. Mater. Sci. 117, 151 (2016).
38 G. J. Ackland, D. J. Bacon, A. F. Calder, and T. Harry, Philos. Mag. A 75, 713 (1997).
39 R. Meyer and P. Entel, J. Phys. IV 7, 29 (1997).
40 B. Wang and H. M. Urbassek, Acta Mater. 61, 5979 (2013).
41 B. Wang and H. M. Urbassek, Comput. Mater. Sci. 81, 170 (2014).
42 B. Wang, Y. Gao, and H. M. Urbassek, Phys. Rev. B 89, 104105 (2014).
43 S. Nose, J. Chem. Phys. 81, 511 (1984).
44 W. G. Hoover, Phys. Rev. A 31, 1695 (1985).
45 S. Plimpton, J. Comput. Phys. 117, 1 (1995), />46 J. D. Honeycutt and H. C. Andersen, J. Phys. Chem. 91, 4950 (1987).
47 D. Faken and H. Jonsson, Comput. Mater. Sci. 2, 279 (1994).
48 A. Stukowski, Model. Simul. Mater. Sci. Eng. 18, 015012 (2010), />49 T. Maki, S. Furutani, and I. Tamura, ISIJ Int. 29, 438 (1989).
10