Báo cáo "The role of color luminescence centers Mn, Cu, Co in the semicondutors with wide band gap ZnS, ZnO and their applications " pptx
Bạn đang xem bản rút gọn của tài liệu. Xem và tải ngay bản đầy đủ của tài liệu tại đây (1.47 MB, 7 trang )
VNU Journal of Science, Mathematics - Physics 24 (2008) 181-187
181
The role of color luminescence centers Mn, Cu, Co in the
semicondutors with wide band gap ZnS, ZnO and
their applications
Pham Van Ben*, Phan Trong Tue
Department of Physics, College of Science, VNU
334 Nguyen Trai, Thanh Xuan, Hanoi, Vietnam
Received 22 May 2008; received in revised form 15 December 2008
Abstract. In this paper, materials of ZnS:Cu, ZnS:Mn and ZnO:Co were prepared by ceramic
method and co-precipitated method. The presence of transition metals such as Cu
2+
(3d
9
),
Mn
2+
(3d
5
) in ZnS and Co
2+
(3d
7
) in ZnO make blue bands at around 476 nm, 486 nm and green
band at around 514 nm disappeared. Simultaneously, there are luminescence bands at around 533
nm, 582 nm, 693 nm for bulk samples of ZnS:Cu, ZnS:Mn, ZnO:Co and 603 nm for
nanocrystalline sample of ZnS:Mn. These bands are characterized by Cu
2+
ions, Mn
2+
ions:
[
4
T
1
-
6
A
1
] and Co
2+
ions: [
4
T
1
-
4
A
2
] in ZnS:Cu, ZnS:Mn and ZnO:Co, respectively. Time-resolved
luminescence spectra of these samples show that lifetime of electrons at excited states is 1.90 ms,
0.79 ms and 8.60
s
µ
corresponding to bulk sample ZnS:Mn, nanocrystalline sample ZnS:Mn and
bulk sample ZnS:Cu. The luminescence material of ZnS:Cu has been tested in off-set print for
anti-imitated stamps.
Keywords: ZnS, ZnO, photoluminescence (PL), time-resolved PL spectra.
1. Introduction
ZnS, ZnO are semiconductors with wide band gap (E
g
= 3.70 eV and 3.37 eV for ZnS, ZnO at
4.2K, respectively). These materials were applied widely in the field of electroluminescence displays
such as luminescence diodes, cathode ray tube, transparent windows… [1-4]
In visible region, the photoluminescence (PL) spectra of ZnS materials include two wide
luminescence bands at around 460 nm (blue band) and 515 nm (green band). These bands are
characterized by the vacancies of Zn bonding to Cl (V
Zn
-Cl) and some impurities in ZnS crystal [5].
PL spectra of ZnO include luminescence bands at around 380 - 410 nm, 500 - 530 nm and 590 - 620
nm These bands are characterized by the radiation of free excitons, donor-acceptor pairs relating to
vacancies of oxygen, zinc and some impurities in ZnO crystal [6].
______
*
Corresponding author. E-mail:
P.V. Ben, P.T.Tue / VNU Journal of Science, Mathematics - Physics 24 (2008) 181-187
182
When doping Cu, Mn in ZnS and Co in ZnO, the self-activated luminescence bands characterized
by vacancies of zinc and oxygen are extinguished or their intensities decrease. In PL spectra of
ZnS:Cu, ZnS:Mn and ZnO:Co appear luminescence bands at around 533 nm, 582 nm and 693 nm,
respectively. These luminescence bands are characterized by Cu
2+
, Mn
2+
, Co
2+
ions [7-11]. In this
paper, we study the role of color luminescence centers Cu, Mn, Co in the semiconductors with wide
band gap of ZnS, ZnO and test application of ZnS:Cu material.
2. Samples and experimental devices
Bulk samples of ZnS, ZnS:Cu (x
Cu
= 0÷5.10
-4
mol%), ZnS:Mn (x
Mn
= 0÷1.2.10
-2
mol%) were
prepared by the solid state reaction method in argon and ZnO:Co (x
Co
= 2.10
-2
÷2.10
-1
mol%) in air
enviroment. Annealing temperature and time were varied in range from 700
o
C to 1250
o
C and from 15
minutes to 36 hours [12-14]. Nanocrystalline sample ZnS:Mn (x
Mn
= 10
-3
÷10
-2
mol%) was prepared by
the co-precipitated method with initial chemical ZnCl
2
, Na
2
S and MnCl
2
and annealed in argon[15].
The crystalline structure of these samples was investigated by X-Ray diffraction (XRD) patterns
on D8-Advance Brucker equipment using CuK
α
radiation (λ
α
= 1.5056 A
0
, 2θ = 10
0
– 70
0
). The
scanning electron microscopy (SEM) image measurement is carried out on JEOL5410-VL equipment.
PL spectra of these materials at 300 K were excited by the wavelengths of 325 nm from He-Cd laser,
632.8 nm from He-Ne laser and recorded on Microspec 2300i, Varian 100 spectrometer. Time-
resolved PL spectra measurements were excited by the wavelength of 337 nm from N
2
laser and
recorded on Jobin Yvon HRD1, GDM-1000 spectrometer using boxca technique.
3. Results and discussion
3.1. Study of structure properties
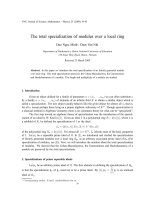
Fig.
2
.
SEM images of bulk
samples
ZnS:Mn (a),
ZnS:Cu(b), ZnO:Co (c) and nanocrystalline
sample ZnS:Mn (d).
a
b
c
d
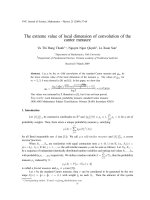
Fig. 1. XRD patterns of bulk samples ZnS:Mn (a), ZnS:Cu
(b)
ZnO:Co (c) and nanocrystalline ZnS:Mn (d)
.
(
111
)
(220)
(3
11
)
(100)
(002)
(101)
(102)
(110)
(010)
(111)
(011)
(012)
(220)
(013)
(311)
(ceramic)
(ceramic
)
(
112
)
(
103
)
P.V. Ben, P.T.Tue / VNU Journal of Science, Mathematics - Physics 24 (2008) 181-187
183
XRD patterns of bulk samples ZnS:Mn, ZnS:Cu show that they have hexagonal structures with
main diffraction planes (010), (111), (011), (012), (220), (013), (311) (Fig.1a,1b). As changing
concentration of Cu (0÷5.10
-4
mol%), Mn (0÷1.2.10
-2
mol%), the position of peaks and lattice
constants of bulk samples of ZnS:Mn and ZnS:Cu almost do not change. Fig.1c shows XRD pattern of
ZnO:Co with main peaks corresponding to the (100), (002), (101), (102), (110), (103), (112) planes.
The lattice constants a, c decrease gradually when concentration of Co increases. This is due to the
fact that ionic radius of Co
2+
(0.83 A
o
) is smaller than that of Zn
2+
(0.88 A
o
). The XRD pattern of
nanocrystalline sample ZnS:Mn concludes three broad bands corresponding to the (111), (220) and
(311) planes (Fig.3d). The average crystalline size calculated by using the Scherer’s formula is about 5
nm. Values of average crystalline size do not show any systematic change with Mn content variation
in range of 10
-3
÷10
-2
mol%. The reported Bohr's radius value for ZnS is about 10 nm [16]. Obviously,
the particle size of our samples is within this range.
Fig.2 shows SEM images of bulk samples of ZnS:Mn (a), ZnS:Cu (b) and ZnO:Co (c) and
nanocrystalline sample ZnS:Mn (d). In general, distribution of particles is quite properly. For bulk
samples of ZnS:Mn, ZnS:Co and ZnS:Cu, the particle size is about 3 µm.
3.2. Photoluminescence spectra
When Cu (x
Cu
= 4.10
-5
mol%) was doped in ZnS, in the PL spectrum of bulk sample ZnS:Cu
except a blue band at 476 nm, there is one more green band at around 533 nm characterized by Cu
2+
ions (Fig. 3). Intensity of the green band is greater than that of the blue band. As increasing the
concentration of Cu, the intensity of the blue band decreases while the intensity of the green band
increases and reaches to maximum at x
Cu
= 3.5.10
-4
mol%. This means that Cu
2+
ions substituted for
positions of Zn
2+
ions or vacancies of Zn in ZnS crystal. With increasing of concentration of Cu
beyond 3.5.10
-4
mol%, the intensity of the green band decreases. Because at high concentration of Cu,
it is possible that interaction between Cu
2+
ions and ions of the lattice and between Cu
2+
each other
make the intensity of the green band decrease. Hence, at x
Cu
= 5.10
-4
mol% the intensities of these two
bands are equal to each other and they merge into one wide band ranging from 476 nm to 533 nm. The
blue and green bands are characterized by radiation transition of electrons from conduction band to
Fig. 4. The PL spectra of bulk ZnO:Co at 300 K excited
by the wavelength of 632.8 nm from He
-
Ne laser
.
a: x
= 0.02
b: x = 0.04
c: x = 0.06
d: x = 0.10
e: x = 0.15
f: x = 0.20
620 640 660 680 700 720 740 760 780
λ
(nm)
5×10
4
4×10
4
3×10
4
2×10
4
1×10
4
0.5×10
4
693 nm
Fig. 3. The PL spectra of bulk sample ZnS:Cu at 300
K excited by the wavelength of 325 nm from He-Cd
laser.
a: x = 0
b: x = 4.10
-5
c: x = 6.10
-5
d: x = 8.10
-5
e: x = 1.10
-4
f: x = 3.10
-4
g: x = 3.5.10
-4
h: x = 5.10
-4
P.V. Ben, P.T.Tue / VNU Journal of Science, Mathematics - Physics 24 (2008) 181-187
184
acceptor levels and levels of Cu
2+
ions in the band gap of ZnS, respectively in which acceptor is
vacancies of Zn bonding to Cl (V
Zn
- Cl)[5-7].
Fig.4 shows the PL spectra of bulk sample ZnO:Co with variation of Co concentration. When Co
(x
Co
= 2.10
-2
mol%) was doped in ZnO, the presence of Co
2+
ions resulted in change in the PL
spectrum of ZnO. As exciting by the wavelength of 632.8 nm from He-Ne laser, the PL spectra of bulk
sample ZnO:Co show red band at around 693 nm with strong intensity. When the concentration of Co
increases, the intensity of the red band increases gradually and reaches to maximum at x
Co
= 10
-1
mol%. This means that Co
2+
ions substituted in both positions of Zn
2+
ions and vacancies of Zn in ZnO
crystal. With the increasing of concentration of Co beyond 10
-1
mol%, interaction can occur between
Co
2+
ions and ions of the lattice or between Co
2+
ions each other. Thereby, the intensity of the red band
decreases. The red band is characterized by radiation transition of electrons in 3d shell of Co
2+
[
4
T
1
→
4
A
2
] [17]
Fig. 5 shows the PL spectra of bulk sample ZnS:Mn with variation of Mn concentration
(x
Mn
= 0÷1.2.10
-2
mol%). Besides the blue band with small intensity, a yellow-orange band appears at
around 582 nm with strong intensity. As concentration of Mn increases, the intensity of the blue band
decreases while the intensity of the yellow-orange band increases gradually and reaches to the
maximum at x
Mn
= 8.10
-3
mol%. However, the position of this band hardly changes.
The yellow-orange band is characterized by radiation transition of electrons in 3d
5
shell of Mn
2+
ions: [
4
T
1
6
A
1
][7-11].
.
When Mn
2+
concentration increases over x
Mn
= 8.10
-3
mol%, it is possible that
interaction between Mn
2+
ions and ions of the lattice or betwen Mn
2+
ions each other. As the result,
absorption energy of ZnS:Mn crystal was transferred into thermal energy, not radiation energy [7, 8].
Fig.6 shows the PL spectra of nanocrystalline sample ZnS:Mn with different concentrations
varying from 10
-3
to 10
-2
mol%. There are two broad bands: a orange band centered at 603 nm arises
from the [
4
T
1
-
6
A
1
] radiation transition of Mn
2+
, which is slightly red-shifted compared to the peak of
bulk sample ZnS :Mn [18]. The blue band at 465 nm originates from the self-activated radiation of Zn
vacancies [2,19]. As the Mn
2+
concentration increases from 10
-3
to 10
-2
mol%, the change in intensity
of these bands is similar to the change in bulk sample but its position is unchanged. The radiation
transitions corresponding to these bands in samples of ZnS:Cu, ZnS:Mn and ZnO:Co are shown in
Fig.7.
Fig.
6
.
The PL spectra of nanocrystalline ZnS:Mn
at
300 K excited by the wavelength of 325 nm from
He
-
Cd laser.
Fig. 5. The PL spectra of bulk ZnS:Mn at 300 K excited
by the wavelength of 325 nm from He-Cd laser.
a: x = 0
b: x = 2. 10
-3
c: x = 4. 10
-3
d: x = 6. 10
-3
e: x = 8. 10
-3
f: x = 1. 10
-2
g: x = 1.2. 10
-2
a: x =
1
. 10
-
3
b: x = 2. 10
-3
c: x = 4. 10
-3
d: x = 6. 10
-3
e: x = 8. 10
-3
f: x = 9. 10
-3
g: x = 1. 10
-2
P.V. Ben, P.T.Tue / VNU Journal of Science, Mathematics - Physics 24 (2008) 181-187
185
3.3. Time-resolved photoluminescence spectra
Fig. 8, 9 show the time-resolved PL spectra of the band at 582 nm for bulk sample ZnS:Mn and
the band at 603 nm for nanocrystalline sample ZnS:Mn with the same concentration of Mn (x
Mn
=
8.10
-3
mol%). When the delay-time increases from 80 µs to 1000 µs, the intensity of yellow-orange
band decreases gradually but the position of the band does not change. This is the characteristic of
radiation transition in 3d shell of Mn
2+
ions: [
4
T
1
-
6
A
1
]. The fluorescent life-time of electrons at excited
state
4
1
T
of Mn
2+
is 1.9 ms (for the band at 582 nm) and 0.79 ms (for the band at 603 nm) calculated
from luminescence decay curve fitted with first order exponential function.The milisecond life-time
consists of two processes, due to transition of Mn
2+
single ions and Mn
2+
coupled pairs, respectively
[17,18]. The difference of life-time between bulk and nanocrystalline samples could be ascribed to
surface defects. There are more defects in nanocrystalline than in bulk ZnS:Mn. The energy of excited
Mn
2+
transfers to surface defects in nanocrystalline more easily than in the bulk samples, so the life-
time of Mn
2+
in nanocrystalline is shorter than that in bulk sample ZnS:Mn. The nanosecond life-time
can be observed for samples of ZnS:Mn due to the blue radiation centered at 465 nm [1,2].
4
T
1
4
T
2
4
A
1
4
A
2
4
F
4
P
693 nm
E
C
E
V
D
A
4
T
1
6
A
1
A
Cu
2+
e
-
e
-
533 nm
476
nm
582
nm
465 nm
Fig. 7. Diagram of energy levels of Mn
2+
, Cu
2+
ions in ZnS (a); Co
2+
ions in ZnO (b) and
radiation transitions corresponding to the blue, green, yellow-orange, red bands.
a
b
Fig.
9
.
Time
-
resolved PL spectra of 603 nm band of
nanocrystalline sample ZnS:Mn (x
Mn
= 8.10
-3
mol% )
at 3
00 K excited by the wavelength of 337 nm
.
Fig. 8. Time-resolved PL spectra of 582 nm band of
bulk sample ZnS:Mn (x
Mn
= 8.10
-3
mol% ) at 300 K
excited by the wavelength of 337 nm.
a: 80
µ
s
b: 100 µs
c: 200 µs
d: 320 µs
e: 720 µs
f: 1000 µs
a: 80
µ
s
b: 120 µs
c: 160 µs
d: 220 µs
e: 400 µs
f: 1000 µs
582 nm
603
nm
P.V. Ben, P.T.Tue / VNU Journal of Science, Mathematics - Physics 24 (2008) 181-187
186
Fig.10 shows the time-resolved PL spectra
of bulk sample ZnS:Cu with time-delay
variation. When the time-delay is 30 ns, in PL
spectrum of ZnS:Cu (x
Cu
= 3.5.10
-4
mol%),
there is a band at 476 nm with strong intensity
but a band at 533 nm of Cu does not appears
as a sharp peak. While the time-delay
increases from 30 ns to 80 ns, the position of
476 nm band does not change but the intensity
of the band decreases about 2.6 times. The life
time of free electrons at conduction band is
about 8.6 µs that is deduced from
luminescence extinguishing curve of 476 nm
band.
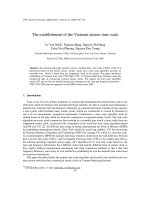
3.4 Application
We have succeeded in efforts to apply the
luminescence powder ZnS:Cu (x
Cu
= 3.5.10
-4
mol%) for anti-imitated labels and stamps. Fig.
11a shows a real stamp when it has not been
lighted yet. Fig. 11b and Fig. 11c show the stamp
and a 50000 VND polymer cash under UV light,
respectively. The stamp was marked at 4 certain
points by ZnS:Cu luminescent powder (the points
have green radiation). Here, we can see that the
emission colors of the 4 points (on the stamp) and
surround of 50000 number (on the polymer cash)
are familiar. In the future, we are going to try
doing with other materials such as ZnS:Mn
(yellow-orange) and ZnS:Eu (red) in off-set
printing application.
4. Conclusion
By doping Cu
2+
(3d
9
), Mn
2+
(3d
5
) and Co
2+
(3d
7
) in ZnS, ZnO we have prepared successfully
materials radiating at different wavelengths in visible region (different color from blue to red). The
yellow-orange band at around 582 nm and 603 nm corresponding to bulk sample ZnS:Mn and
nanocrystalline sample ZnS:Mn are characterized by the radiation transition of electrons in 3d shell of
Mn
2+
ions: [
4
T
1
-
6
A
1
]. The 603 nm band of nanocrystalline sample ZnS:Mn is slightly red-shifted
compared to bulk sample ZnS:Mn due to strong quantum confinement regime. The 476 nm and 533
nm bands of bulk sample ZnS:Cu are characterized by the radiation transition of electrons being from
Fig. 10. Time-resolved PL spectra of 476 nm band of
bulk sample ZnS:Cu (x
Cu
= 3.5.10
-4
mol%) at 300 K
excited by the wavelength of 337 nm.
a: 30 ns
b: 35 ns
c: 50 ns
d: 65 ns
e: 80 ns
Fig. 11. A stamp sample using ZnS:Cu (x
Cu
=
3.5.10
-4
mol%) luminescence powder to label the
certain points a.The real stamp; b. The stamp under
UV light; c. The polymer cash under UV light.
b
c
a
P.V. Ben, P.T.Tue / VNU Journal of Science, Mathematics - Physics 24 (2008) 181-187
187
the conduction band down to acceptor levels and levels of Cu
2+
ions in the band gap of ZnS,
respectively in which acceptor is vacancies of Zn bonding to Cl (V
Zn
- Cl). The 693 nm band of bulk
sample ZnO:Co is characterized by the radiation transition of electrons in 3d shell of Co
2+
:
[
4
T
1
→
4
A
2
].
ZnS:Cu, ZnS:Mn samples reveal the extend luminescence. The lifetime of electrons at excited
states
4
T
1
is about 1.90 ms, 0.79 ms corresponding to bulk, nanocrystalline samples ZnS:Mn. For bulk
sample ZnS:Cu, the lifetime of electrons in conduction band is about 8.60
s
µ
.
These results can be open widespread applications in display devices, luminescent labels,
transportation The luminescence material of ZnS:Cu which we prepared was tested in off-set print for
anti-imitated stamps.
References
[1] Bhagava, R. N., J. Lumin. 70 (1996) 85.
[2] W.G. Becker, A.J. Bard, J. Phys.Chem. 87 (1983) 4888.
[3] S.C. Ghosh, M.K. Hossain, C. Thanachayanont, J. Dutta, Proceedings of the Second NRCT-KOSEF Workshop on
Electronic Materials and Device Processing, Taejong, Korea, 12–15 January 2004 (in press).
[4] M. Wang, L. Sun, X. Fu, C. Liao, C. Yan, Solid State Commun. 115 (2000) 493.
[5] A.V. Murugan, O.Y. Heng, V. Ravi, V. Saaminathan, J. Mater. Sci. 41 (2006) 1459.
[6] Manabu Gomi, Naoko Oohira, Kenichi Ozaki and Mikio Koyano, Jpn. J. Appl. Phys. 42 (2003) 481.
[7] H.C. Warada, S.C. Ghosha, B. Hemtanona, C. Thanachayanontb, J. Duttaa, Science and Technology of Advanced
Materials, 6 (2005) 296.
[8] Jeong-mi Hwang, Mi-Ok Oh, Il Kim, Jin-Kook Lee, Chang-Sik Ha, Current Applied Physics, 5 (2005) 31.
[9] Ping Yang, Mengkai Lu, Dong Xu, Duorong Yuan, Chunfeng Song, Journal of Physics and Chemistry of Solids, 64
(2003) 155.
[10] Sasanka Deka, P.A. Joy, Solid State Communications, 134 (2005) 665.
[11] John B. Gruber, Thomas A. Reynolds, Theodore Alekel, Dhiraj K. Sardar, Bahram Zandi, Douglas A. Keszler, Physical
Review B, Vol 64 (2001) 045111
[12] P.T. Tue, P. V. Ben, The fifth national conference on solid state physics-Vung Tau (2007) 693.
[13] P.V. Ben, B. H. Van, The fifth national conference on solid state physics, Vung Tau (2007) 391.
[14] V.T. He, P. B. Ben, The fifth national conference on solid state physics, Vung Tau (2007) 337.
[15] Hoang Van Han, Fabrication of ZnS:Mn luminescent powder by co-precipitated method and study of their optical
properties, Master Thesis in Optics, Hanoi College of Science – VNU, (2007).
[16] F. Keller, M.S. Hunter, D.L. Robinson, J. Electrochem. Soc., 100 (1953) 411.
[17] B. Martiner, F,Sandiumenge,L. Balcell, J. Fontcuberta, F.Sibieude, C.Monty, J.M.M.M, 290 – 291 (2005) 1012.
[18] Soo, Y. L., Ming, Z. H., Huang, S. W., Kao, Y. H., Bhagava, R. N., and Gallagher, D., Phys. Rev. B. 50 (1994) 7602.
[19] Khosrari, A. A., Kundu, M., Jatwa, L., and Deshpande, S. K., Appl. Phys. Lett. 67 (1995) 2702.
[20] V.T. He, P. B. Ben, The fifth national conference on solid state physics, Vung Tau (2007) 337.