Báo cáo "Effects of Zn content on the magnetic and magnetocaloric properties of Ni-Zn ferrites " pdf
Bạn đang xem bản rút gọn của tài liệu. Xem và tải ngay bản đầy đủ của tài liệu tại đây (265.19 KB, 8 trang )
VNU Journal of Science, Mathematics - Physics 24 (2008) 155-162
155
Effects of Zn content on the magnetic and magnetocaloric
properties of Ni-Zn ferrites
N. Chau
1
, N.K. Thuan
1
, D.L. Minh
2
, N.H. Luong
1,
*
1
Center for Materials Science, College of Science, VNU, 334 Nguyen Trai, Hanoi, Vietnam
2
Department of Solid State Physics, College of Science, VNU, 334 Nguyen Trai, Hanoi, Vietnam
Received 20 August 2008
Abstract. Among spinel ferrites, Cd and Zn ferrites are always normal ferrites with Cd and Zn
ions locating only in tetrahedral sites. This study presents effect of Zn on the magnetic and
magnetocaloric properties of the mixed spinel ferrites Ni
1-x
Zn
x
Fe
2
O
4
(x = 0.60, 0.65, 0.70, 0.75).
The presence of Zn affects lattice parameters, saturation magnetization M
s
, Curie temperature, T
c
,
and magnetic entropy change ∆S
m
. At highest Zn content, T
c
reduces to the temperature lower than
room temperature and magnetic structure of spins in the octahedral sublattice should be strongly
canted. The maximum magnetic entropy change occurs in a large temperature range from low
temperature to hundreds of Celcius degrees.
Keywords: ferrite, magnetocaloric effect.
1. Introduction
It is well known that spinel ferrites consist of three types of magnetic structures: normal, inverse
and mixed spinel [1]. In normal spinel, the divalent ions locate at tetrahedral sublattice (A-site) and
trivalent ions Fe
3+
locate at octahedral sublattice (B-site). In inverse spinel a half of Fe
3+
ions locates at
A site and the rest Fe
3+
ions together with divalent ions locate at B site. In mixed spinel ferrite, both
Fe
3+
ions and divalent ions locate at A and B site. NiFe
2
O
4
is inverse spinel ferrite. Among spinel
ferrites, only Zn and Cd ferrites belong to pure normal structure. Mixed Ni-Zn ferrites have extremely
high resistivity so that they are widely used as soft magnetic materials suitable for high-frequency
applications. Initial permeability is maximum at 30 mol % NiFe
2
O
4
, 70 mol % ZnFe
2
O
4
and this
compositon has Curie temperature, T
C
, near room temperature [2]. For the theoretical examination of
properties of ferrites it could be started from the parameters characterizing for superexchange
interaction types A-A, B-B, A-B. Interaction A-A belongs to neighbor magnetic ions in sublattice A,
interaction B-B - between ions in sublattice B and interaction A-B - between ions of sublattices A and
B. We denote λ
aa
, λ
bb
, λ
ab
correspond to molecular-field constants of exchange interaction A-A, B-B
and A-B, respectively [3].
Exchange interactions between magnetic ions through oxygen ion are superexchange interaction
with antiferromagnetic nature. These interactions depend on bond distance and bond length. Normally
______
*
Corresponding author. Fax: (84-4) 3858 9496
Email:
N.Chau et al. / VNU Journal of Science, Mathematics - Physics 24 (2008) 155-162
156
|λ
ab
| >> |λ
bb
| > |λ
aa
|, therefore magnetic moments of A sublattice is antiparallel oriented with spins in B
sublattice [4]. The increase of Zn content in Ni-Zn ferrites makes weakening λ
ab
and could lead to
canting structure in B site [3]. Usually canting structure of ferrites was examined by neutron scattering.
The studies on spinel ferrites were started long time ago but recently a large number of publications
dealing with them has been performed including nanoparticles and thin ferrite films [5-12]. Especially,
superparamagnetic properties of Ni-Zn ferrite for nano-bio fusion applications ware reported [13].
In this paper we study magnetic and electric properties including canting structure of Ni-Zn
ferrites with high Zn content and at the first time we attemped to observe magnetocaloric effect (MCE)
in these ferrites.
2. Experiments
The polycrystalline ferrite samples Ni
1-x
Zn
x
Fe
2
O
4
(x = 0.60; 0.65; 0.70 and 0.75) were prepared
by standard solid state reaction technique. The mixed powders were presintered at 900ºC for 3 hours
and then reground to the fine particles, pressed into pellets and again heated at 900ºC for 3 hours. The
second reground powders were pressed and sintered at 1300ºC for 3 hours. The crystal structure of
samples was checked by X-ray diffractometer D5005, Bruker and the microstructure of samples was
examined by Scanning Electron Microscope (SEM) Jeol LV5410. Magnetic properties of ferrites were
measured by Vibrating Sample Magnetometer DMS 880, Digital Measurement System. Resistivity
measurements were performed by four probe method.
3. Results and discussion
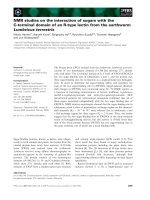
Fig. 1. X-ray diffraction patterns of ferrite samples Ni
1-x
Zn
x
Fe
2
O
4
.
N.Chau et al. / VNU Journal of Science, Mathematics - Physics 24 (2008) 155-162
157
The SEM study showed that the microstructure of samples is of high homogeneity and average
particle size increases with Zn content in samples, namely from 2.1 µm (x = 0.60) to 2.8 µm (x = 0.65)
to 2.9 µm (x = 0.70) and to 3.1 µm (x = 0.75). Fig. 1 presents the XRD patterns of studied samples.
All samples have single phase f.c.c spinel structure and lattice parameters are determined and listed in
Tab. 1. It is clear from this table that lattice constant and volume of unit cell increase with Zn content
in the samples due to larger ionic radius of Zn
2+
ion (0.82 Å) substituted for Ni
2+
ion (0.78 Å).
The X-ray density, the real density as well as porosity of ferrites also determined and illustrated
in Tab. 1. While the X-ray density is slightly decreased with increasing Zn content in samples (due to
the extension of unit cell), the real density of samples enhanced because of reducing of porosity from
15.1 % (x = 0.60) to 7.6 % (x = 0.75).
Table 1. Lattice parameters, X-ray density, real density and porosity of samples Ni
1-x
Zn
x
Fe
2
O
4
In highest Zn content sample (x = 0.75) the crystal boundary became narrower due to
development of particle size. Because ZnO has low melting temperature so in high ZnO content sample,
the liquid phase easy to perform at high sintering temperature and eliminates the porosity of ferrite.
The magnetization curves of all samples have been measured at 110 K in maximal applied field of
13.5 kOe. The results showed that at this field the studied samples are nearly in saturation and saturation
magnetization of samples is listed in Tab. 2. From the shape of measured M(T) curves, we should
approximately suppose that these values correspond to saturation magnetization of samples at 0 K.
As we known, NiZn ferrites are inverse spinel with following orientation of spins [1-3]:
−+
+
+
−
+
−
+
2
4
3
1
2
1
3
1
2
OFeNiFeZn
xxxx
(1)
and according to Neel theory [4] saturation magnetization for formula unit could be determined by
expression:
(
)
[
]
BBBBSt
xxxxM
µµµµ
)82()1(5)1(512 +=−−++−= (2)
where Zn
2+
ion is nonmagnetic ion, Ni
2+
has 2μ
B
, Fe
3+
has 5 μ
B
and x is Zn amount containing in
ferrite. Saturation magnetization M
St
calculated from formula (2) and M
Se
measured for formula unit
are showed in Tab. 2.
The saturation magnetization M
St
calculated with assuming that exchange interaction λ
ab
is
strongest therefore magnetic moments of A and B sublattices are antiparallel to each other and M
St
increases with x. In fact M
Se
measured in experiment decreased with x. It means that with increasing
Zn content in ferrite, A-B interaction became weakening so should be compared with B-B interaction
and we suppose in our studied samples there is canting structure as illustrated in Fig. 2, where ϕ is the
angle between direction of magnetic moment of A ions and magnetic moment of B
1
and B
2
ions.
Comparing M
St
and M
Se
from Tab. 2, we could determine the canting angle between magnetic
moments of B
1
and B
2
ions in octahedral sublattice. We see that canting angle increases with
increasing amount of nonmagnetic ions Zn
2+
in ferrite which causes weakening exchange interactions.
Ni
1-x
Zn
x
Fe
2
O
4
Sample
x = 0.60 X = 0.65 x = 0.70 x = 0.75
a (Å) 8.4108 8.4149 8.4208 8.4251
V (Å
3
) 594.99 595.86 597.12 598.03
D
x
(g/cm
3
) 5.322 5.321 5.318 5.317
D (g/cm
3
) 4.52 4.65 4.82 4.92
P (%) 15.1 12.6 9.4 7.6
N.Chau et al. / VNU Journal of Science, Mathematics - Physics 24 (2008) 155-162
158
Fig. 2. Canting structure of NiZn ferrite when λ
ab
, λ
bb
and λ
aa
have the same order.
Table 2. Saturation magnetization and canting angle of ferrites Ni
1-x
Zn
x
Fe
2
O
4
x 0.60 0.65 0.70 0.75
I
s
(emu/g) 112.8 99.68 95.36 74.43
M
st
(µ
B
) 6.8 7.2 7.6 8.0
M
se
(µ
B
) 4.59 4.26 4.08 3.19
ϕ
c
(
o
)
41.5 47.8 52.1 61.3
In order to study the spin order and magnetic behavior of samples, the field-cooled (FC) and
zero field-cooled (ZFC) magnetization measurements were performed in magnetic field of 20 Oe (Fig.
3 ). The FC and ZFC curves depart from each other below the freezing temperature T
f
indicating the
onset of blocking of clusters. The sample settles into the frozen state below temperature T
f
. This
behavior is attributed to the magnetic frustration arising from the co-existence of competing
antiferromagnetic and ferromagnetic interactions. The separation of FC and ZFC curves at low
temperatures could be considered that the sample exhibits cluster glass-like state. This behavior has
been observed for all studied ferrites. From the data of Fig. 3, the Curie temperature T
C
has been
determined based on Arrott plots and listed in Tab. 3.
Table 3. Curie temperature, Tm and maximum value of magnetic entropy change of ferrites Ni
1-x
Zn
x
Fe
2
O
4
*) T
m
is temperature at which |∆S
m
| reaches a maximum.
X 0.60 0.65 0.70 0.75
T
C
407 360 305 260
T
m
* (K) 387 345 300 265
|∆S
m
|
max
(J/kg.K) 0.88 0.84 0.98 0.88
N.Chau et al. / VNU Journal of Science, Mathematics - Physics 24 (2008) 155-162
159
Fig. 3. FC and ZFC thermomagnetic curves of ferrite Ni
0.3
Zn
0.7
Fe
2
O
4
.
It is clearly seen from this table that T
C
decreases with increasing Zn content substituted for Ni in
ferrites and is around room temperature for ferrite Ni
0.3
Zn
0.7
Fe
2
O
4
. The reduction of T
C
here could be
explained by weakening exchange interaction mainly between magnetic ions in sublattices A and B.
As we well known, the adiabatic magnetic entropy change, ∆S
m
, is determined by Maxwell’s
fundamental relation [14]:
dH
T
HTM
HTS
H
H
m
mã
∫
∂
∂
=∆∆
0
),(
),(
(3)
where H
max
is the final applied magnetic field. To study the MCE of samples, a series of isothermal
magnetization curves around their respective T
C
has been measured in a magnetic field up to 13.5 kOe.
Fig. 4 a shows these curves of ferrite Ni
0.3
Zn
0.7
Fe
2
O
4
.
When magnetization is measured in a small discrete field and temperature interval, ∆S
m
could
be determined from Eq. (3) by expression:
∑
∆
−
−
=∆
+
+
H
TT
MM
S
ii
ii
m
1
1
(4)
where M
i
and M
i+1
are the experimental values of magnetization at T
i
and T
i+1
, respectively, under
magnetic field variation of ∆H.
The |∆S
m
|(T) curve of ferrite Ni
0.3
Zn
0.7
Fe
2
O
4
is illustrated in Fig. 4 b and |∆S
m
| reached a
maximum value of 0.98 J/kg.K near Curie temperature. Similar behavior was observed for other
samples investigated and the results are listed in Table 3. The values of |∆S
m
|
max
in our samples are
identify with that firstly examined by Chaudhary et al. [15] for cobaltite perovskites La
1-x
Sr
x
CoO
3
.
Thus Ni
1-x
Zn
x
Fe
2
O
4
(x = 0.60; 0.65; 0.70; 0.75) ferrites could be considered as active magnetic
refrigerant materials working in quite wide temperature range.
N.Chau et al. / VNU Journal of Science, Mathematics - Physics 24 (2008) 155-162
160
0 2 4 6 8 10 12 14
0
10
20
30
40
50
60
M (emu/g)
H (kOe)
265 K
300 K
305 K
340 K
(a)
270 285 300 315 330 345
0.65
0.70
0.75
0.80
0.85
0.90
0.95
1.00
|∆S
m
| (J/kg.K)
T (K)
|∆S
m
|
max
= 0.98 J/kg.K
Ni
0.3
Zn
0.7
Fe
2
O
4
(b)
Fig. 4. (a) A series of isothermal magnetization curves and (b) magnetic entropy change |∆Sm| versus
temperature of sample Ni
0.3
Zn
0.7
Fe
2
O
4
.
Note that large MCE in manganite perovskites [16-19] and colossal MCE in amorphous alloys
[20-23] have been examined by us.
The resistance of samples has been measured in the temperature region from 125 K to 300 K
and the linear dependence of lnρ on 1/T for ferrite Ni
0.3
Zn
0.7
Fe
2
O
4
has been obtained and Fig. 5 shows
this result as an example.
N.Chau et al. / VNU Journal of Science, Mathematics - Physics 24 (2008) 155-162
161
Fig. 5. Dependence of lnρ on 1/T for ferrite Ni
0.3
Zn
0.7
Fe
2
O
4
.
Obviously, temperature dependence of resistivity of ferrites follows the below expression [1,2]:
kTE
e
/
0
ρ
ρρ
= (5)
From Fig. 3 we could calculate activation energy E
ρ
of Ni
0.3
Zn
0.7
Fe
2
O
4
ferrite and the result
showed to be 0.15 eV which corresponds to electron conductivity of ferrite [1]. The similar results are
obtained for the rest studied ferrites.
4. Conclusions
Single phase ferrites Ni
1-x
Zn
x
Fe
2
O
4
(x = 0.60; 0.65; 0.70 and 0.75) have been prepared with
cluster glass-like state. The canting angles of magnetic moments in octahedral sublattice were
approximately determined and that angle increases with Zn content in NiZn ferrite. At the first time
we have examined the magnetocaloric effect in ferrite generally and the obtained |∆S
m
|
max
could be
compared with that of perovskite. Moreover the temperature at which |∆S
m
|
reached a maximum could
be easily controlled by substitution effect.
Acknowlegements. The authors are grateful to the Vietnam National Fundamental Research Program
(Project 406006) for the financial support.
References
[1] J. Smit and H.P.J. Wijn, Ferrites (Wiley, New York, 1959).
[2] T. Tsushima, T. Teranishi and K. Ohta, Handbook on the magnetic substances (ed. by S. Chikazumi et al., Akasura
Publishing Co, Tokyo, 1975).
N.Chau et al. / VNU Journal of Science, Mathematics - Physics 24 (2008) 155-162
162
[3] B. Lax, K.J. Button, Microwave ferrites and ferrimagnetics, McGraw-Hill Book Comp., Inc., New York, San
Francisco, Toronto, London 1962.
[4] L. Neel, Ann. de Phys. 3 (1948) 137.
[5] A.S. Albuquerque, J.D. Ardisson, W.A.A. Macedo, J. Appl. Phys. 87 (2000) 4352.
[6] A. Verma, T.C. Goel, R.G. Mendisata, Mater. Sci. Tech. 16 (2000) 712.
[7] S.E. Jacobo, S. Duhalde, H.R. Bertorello, J. Magn. Magn. Mater. 272-276 (2004) 2253.
[8] S.W. Lee, C.S. Kim, J. Magn. Magn. Mater. 303 (2006) e315.
[9] J.H. Yin, J. Ding, J.S. Chen, X.S. Miao, J. Magn. Magn. Mater. 303 (2006) e387.
[10] H.H. Nien, T.J. Liang, C.K. Huang, S.K. Changchien, J. Magn. Magn. Mater. 304 (2006) e204.
[11] H.H. Nien, T.J. Liang, C.K. Huang, S.K. Changchien, J. Magn. Magn. Mater. 304 (2006) 2409.
[12] H.T. Chan, Y.Y. Do, P.L. Huang, P.L. Chien, T.S. Chan, R.S. Liu, C.Y. Huang, S.Y. Yang, H.E. Horng, J. Magn.
Magn. Mater. 304 (2006) e415.
[13] S.W. Lee, C.S. Kim, J. Magn. Magn. Mater. 304 (2006) e418.
[14] A.H. Morish, The Physical Principles of Magnetics, Willey, New York, 1963 (Chapter 3).
[15] S. Chaudhary, V.S. Kumar, S.B. Roy, P. Chaddah, S.R. Krishnakumar, V.G. Sathe, A. Kumar, D.D. Sarma, J.
Magn. Magn. Mater. 202 (1999) 47.
[16] N. Chau, D.T. Hanh, N.D. Tho, N.H. Luong, J. Magn. Magn. Mater. 303 (2006) e335.
[17] N. Chau, N.D. Tho, N.H. Luong, B.H. Giang, B.T. Cong, J. Magn. Magn. Mater. 303 (2006) e402.
[18] D.T. Hanh, N. Chau, N.H. Luong, N.D. Tho, J. Magn. Magn. Mater. 304 (2006) e325.
[19] D.T. Hanh, M.S. Islam, F.A. Khan, D.L. Minh, N. Chau, J. Magn. Magn. Mater. 310 (2007) 2826.
[20] N. Chau, P.Q. Thanh, N.Q. Hoa, N.D. The, J. Magn. Magn. Mater. 304 (2006) 36.
[21] N. Chau, N.Q. Hoa, N.D. The, P.Q. Niem, J. Magn. Magn. Mater. 304 (2006) e179.
[22] N. Chau, N.D. The, N.Q. Hoa, C.X. Huu, N.D. Tho, S-C.Yu, Mater. Sci. Eng. A499-451 (2007) 360.
[23] N.Q. Hoa, N. Chau, S-C. Yu. T.M. Thang, N.D. The, N.D. Tho, Mater. Sci. Eng. A449-451 (2007) 364.