mutational landscape reflects the biological continuum of plasma cell dyscrasias
Bạn đang xem bản rút gọn của tài liệu. Xem và tải ngay bản đầy đủ của tài liệu tại đây (1.13 MB, 8 trang )
OPEN
Citation: Blood Cancer Journal (2017) 7, e537; doi:10.1038/bcj.2017.19
www.nature.com/bcj
ORIGINAL ARTICLE
Mutational landscape reflects the biological continuum of
plasma cell dyscrasias
A Rossi1,2,8, M Voigtlaender1,8, S Janjetovic1, B Thiele1, M Alawi3,4, M März1, A Brandt1, T Hansen1, J Radloff1, G Schön5, U Hegenbart6,
S Schönland6, C Langer7, C Bokemeyer1 and M Binder1
We subjected 90 patients covering a biological spectrum of plasma cell dyscrasias (monoclonal gammopathy of undetermined
significance (MGUS), amyloid light-chain (AL) amyloidosis and multiple myeloma) to next-generation sequencing (NGS) gene panel
analysis on unsorted bone marrow. A total of 64 different mutations in 8 genes were identified in this cohort. NRAS (28.1%), KRAS
(21.3%), TP53 (19.5%), BRAF (19.1%) and CCND1 (8.9%) were the most commonly mutated genes in all patients. Patients with nonmyeloma plasma cell dyscrasias showed a significantly lower mutational load than myeloma patients (0.91 ± 0.30 vs 2.07 ± 0.29
mutations per case, P = 0.008). KRAS and NRAS exon 3 mutations were significantly associated with the myeloma cohort compared
with non-myeloma plasma cell dyscrasias (odds ratio (OR) 9.87, 95% confidence interval (CI) 1.07–90.72, P = 0.043 and OR 7.03, 95%
CI 1.49–33.26, P = 0.014). NRAS exon 3 and TP53 exon 6 mutations were significantly associated with del17p cytogenetics (OR 0.12,
95% CI 0.02–0.87, P = 0.036 and OR 0.05, 95% CI 0.01–0.54, P = 0.013). Our data show that the mutational landscape reflects the
biological continuum of plasma cell dyscrasias from a low-complexity mutational pattern in MGUS and AL amyloidosis to a highcomplexity pattern in multiple myeloma. Our targeted NGS approach allows resource-efficient, sensitive and scalable mutation
analysis for prognostic, predictive or therapeutic purposes.
Blood Cancer Journal (2017) 7, e537; doi:10.1038/bcj.2017.19; published online 24 February 2017
INTRODUCTION
Plasma cell dyscrasias arise from clonal plasma cell expansions most
commonly in the bone marrow (BM) and are characterized by a
patient-specific monoclonal antibody or light chain, the so-called
paraprotein that can be detected in the plasma of most patients.
The most common plasma cell dyscrasia represents monoclonal
gammopathy of undetermined significance (MGUS) that is defined
as a premalignant precursor state with o10% plasma cell
infiltration in the BM and absence of end-organ damage.1 MGUS
can progress to asymptomatic or symptomatic multiple myeloma
with a frequency of ∼ 1% per year,2 the latter often presenting with
serious clinical problems as bone fractures, renal failure, anemia and
hypercalcemia.3 Paraproteins may also have specific biochemical
properties that interfere with correct protein folding, resulting in
tissue deposition and subsequent organ damage. This is the case in
systemic amyloid light-chain (AL) amyloidosis developing on the
ground of light-chain dysproteinemias.4 Compared with other
plasma cell dyscrasias, these cases are often characterized by a
lower proliferative plasma cell component in the BM.5
Plasma cell dyscrasias are genetically heterogeneous diseases
and invariably show clonal evolution over time as they progress.6
Translocations that place oncogenes under the strong enhancers
of the IgH (immunoglobulin heavy) loci are most of the time early
lesions that can also be found at the MGUS stage by fluorescent
in situ hybridization, whereas other cytogenetic aberrancies such
as del17p represent late events that are acquired in the course of
the disease.7 Similarly, AL amyloidosis involves cytogenetically less
complex plasma cells with prognostically rather favorable lesions,
whereas multiple myeloma more often shows more complex and
sometimes poor prognosis genetic aberrations.8–10
Evidence from whole-genome sequencing studies in myeloma
suggests, however, that plasma cell disorders are not only driven
by such cytogenetic lesions, but also by oncogenic mutations that
may even more reflect their genetic heterogeneity.11,12 Most of the
data have been generated in patients with classical myeloma,
although the mutational landscape of AL amyloidosis or MGUS still
remains unexplored. In classical myeloma, mutations occur in
different pathways with genes involved in RNA processing, protein
translation and the unfolded protein response. Most frequently
mutations were found in NRAS, KRAS, FAM46C, TP53, BRAF, NFKB1,
CYLD, LTB, IRF4 and CCND1.13–16 Many of these mutations are
conceived as driver mutations, some of which potentially druggable,
at least if present in more than a tumor subclone, and others have
prognostic relevance.17–23 It is therefore vital to develop clinically
utilizable tools that may help to quickly generate a picture of the
clonal architecture of a given patient with a plasma cell disorder.
Here we developed a targeted approach to determine a panel
of recurrent oncogenic myeloma mutations with state-of-the-art
technology in the biological spectrum of plasma cell disorders
1
Department of Oncology, Hematology and Bone Marrow Transplantation with Section Pneumology, Hubertus Wald Tumorzentrum/University Cancer Center Hamburg,
University Medical Center Hamburg-Eppendorf, Hamburg, Germany; 2Department of Pharmacy and Biotechnology, Alma Mater Studiorum, University of Bologna, Bologna, Italy;
3
Bioinformatics Core, University Medical Center Hamburg-Eppendorf, Hamburg, Germany; 4Heinrich Pette Institute, Leibniz Institute for Experimental Virology, Hamburg,
Germany; 5Department of Medical Biometry and Epidemiology, University Medical Center Hamburg-Eppendorf, Hamburg, Germany; 6Amyloidosis Center, Department of Internal
Medicine, Division of Hematology/Oncology/Rheumatology, University of Heidelberg, Heidelberg, Germany and 7Department of Internal Medicine III, University Hospital of Ulm,
Ulm, Germany. Correspondence: Professor M Binder, Department of Oncology, Hematology and Bone Marrow Transplantation with Section Pneumology, Hubertus Wald
Tumorzentrum/University Cancer Center Hamburg, University Medical Center Hamburg-Eppendorf, Martinistraße 52, 20246, Hamburg Germany.
E-mail:
8
These authors contributed equally to this work.
Received 12 December 2016; revised 13 January 2017; accepted 25 January 2017
Mutational landscape of plasma cell disorders
A Rossi et al
2
including MGUS, AL amyloidosis and multiple myeloma. We
establish that the genetic complexity—just as the cytogenetic
aberrations—closely reflects the clinical biology of these plasma
cell disorders. Moreover, our PCR-based deep sequencing
approach with a turnaround time of ∼ 3 days is attractive for
routine clinical use for prognostication and identification of
potentially druggable targets.
MATERIALS AND METHODS
Patient characteristics and material
BM mononuclear cells of 11 MGUS cases, 24 AL amyloidosis cases and 55
multiple myeloma cases were collected during routine diagnostic BM
aspirations. All patients consented to the use of their biological material for
this investigation. Myeloma-related chromosomal abnormalities were
assessed by interphase fluorescence in situ hybridization using commercially available probes LSI TP53 for detecting 17p deletion, and dual-color
translocation probe FGFR3/IGH for detecting translocation t(4;14)
(Abbott Diagnostics, Chicago, IL, USA).
Multiplex PCR and NGS
Genomic DNA was extracted from ficollized BM by standard procedures
using the NucleoSpin Tissue XS kit (Macherey-Nagel, Düren, Germany).
DNA quality and quantity was assessed using a Nanodrop1000 (Thermo
Fisher Scientific, Wilmington, DE, USA). To amplify informative coding
regions of 10 genes (KRAS, NRAS, FAM46C, TP53, NFKB1, LTB, IRF4, BRAF,
CYLD and CCND1), a multiplex PCR was set up using the Phusion HS II
(Thermo Fisher Scientific). All primer pairs are shown in Supplementary
Table S1. A total of 50 ng of genomic DNA was amplified per PCR.
Amplicons were subjected to PCR-based barcoding, cut out from agarose
gels and purified following standard procedures (NucleoSpin gel and PCR
clean-up, Macherey-Nagel). Samples were pooled in an equimolar ratio and
quality as well as quantity assessment was performed using a 2100
Bioanalyzer (Agilent Technologies, Santa Clara, CA, USA) and
a Quibit Fluorometer (Thermo Fisher Scientific). Multiplex sequencing
was performed with a 600-cycle single indexed (7 nucleotides) paired-end
run on a MiSeq sequencer (Illumina, San Diego, CA, USA) at an estimated
depth of 100 000 reads per sample.
22 (IBM, New York, NY, USA). A P-value of o0.05 was considered
statistically significant.
RESULTS
Patient characteristics
Targeted sequencing studies were performed on BM mononuclear
cells of a cohort of 90 patients with confirmed plasma cell
disorders treated and/or followed at the University Medical Center
of Hamburg-Eppendorf, Ulm and Heidelberg. These included 11
MGUS, 24 AL amyloidosis and 55 multiple myeloma cases. Clinical
characteristics of this cohort are summarized in Table 1.
Targeted multiplex NGS shows high sensitivity and specificity
For sensitivity determination, a cell line with a known KRAS
mutation was spiked at different ratios into genomic material of
an unmutated cell line and sequenced as described in the
Materials and methods section. NGS resulted in a linear relationship with increasing amounts of mutant DNA. The KRAS mutation
was positively detected down to a ratio of 10 mutated in 10 000
unmutated genomes (0.1%), demonstrating a high sensitivity of
this approach necessary to detect even minimal mutated
subclones because of clonal heterogeneity or low plasma cell
infiltration rate in unsorted BM.
Specificity determination was performed using a known singlenucleotide polymorphism in our data set as an internal reference
as described. This analysis showed an error rate of 15 false
nucleotides per 507 761 reads (error rate 0.003% ± s.d. 0.0004).
These specificity and sensitivity tests led us to set a conservative
detection threshold at 0.1%, implying that deviations from the
germline sequence were classified as ‘mutations’ if not identical to
a known polymorphism and if present in 40.1% of reads.
Table 1.
Baseline characteristics of all 90 patients
Sensitivity determination
The colon cancer cell line SW620 (ATCC, Manassas, VA, USA), harboring a
KRAS exon 2 mutation, was used to evaluate the limit of detection of our
next-generation sequencing (NGS) approach. One to 1000 genomes of this
cell line were spiked into 10 000 genomes of the Colo320 cell line carrying
no KRAS mutation (ATCC). NGS was performed as described above at an
estimated depth of 20 000 reads per sample.
Female, no. (%)
Age in years,
mean ± s.e.m.
del17p, no. (%)
Translocation t(4;14),
no. (%)
MGUS
(n = 11)
AL amyloidosis
(n = 24)
Multiple
myeloma
(n = 55)
5 (45.5%)
68.4 ± 2.92
11 (45.8%)
62.5 ± 2.74
17 (30.9%)
65.4 ± 1.44
0 (0%)
0 (0%)
2/22 (9%)
1/22 (4.5%)
7/40 (17.5%)
6/38 (15.8%)
NGS data analysis
An inhouse bioinformatics pipeline optimized for the diagnostic workflow
was used to analyze the MiSeq data. In brief, adapter sequences and lowquality (Phred quality score o10) bases were removed from sequencing
reads with Trimmomatic (v0.32).24 Overlapping paired reads were merged,
dereplicated and clustered using USEARCH (v8.1.1831).25 Sequences
observed o10 times were discarded after the dereplication step. BLAT26
was employed to align the resulting clusters to reference gene sequences.
The background error rate of the sequencer together with PCR artifacts
was calculated using a known single-nucleotide polymorphism in the LTB
gene. Variants other than the known two base pairs were counted and
related to the local coverage.
Statistics
Data were presented as mean ± s.e.m. Differences in the mutational load
between the two cohorts of multiple myeloma and non-myeloma plasma
cell dyscrasias were analyzed using the two-sided Student’s t-test.
Categorical data were compared using the χ2 test. Confidence intervals
(CIs) in case of binomial parameter were calculated according to the
Clopper–Pearson method. Multivariate logistic regression analyses with all
exons mutated in ⩾ 5% of all patients were performed to determine
mutated genes associated with disease categories, del17p and translocation t(4;14), respectively. Analyses were carried out using IBM SPSS version
Blood Cancer Journal
Subtype, no. (%)
IgG kappa
IgG lambda
IgA kappa
IgA lambda
Kappa light chain
Lambda light chain
Biclonal light chain
BM infiltration (%),
mean ± s.e.m.
2/11 (18.2%)
2/23 (8.7%)
1/11 (9.1%)
5/11 (45.5%) 7/23 (30.4%)
2/11 (18.2%) 14/23 (60.9%)
1/11 (9.1%)
o 10
20.6 ± 4.6
16/49
10/49
12/49
4/49
4/49
3/49
(32.7%)
(20.4%)
(24.5%)
(8.2%)
(8.2%)
(6.1%)
42.7 ± 4.12
ISS, no. (%)
I
II
III
15/42 (35.7%)
11/42 (26.2%)
16/42 (38.1%)
Setting at BM sampling, no. (%)
First diagnosis
Relapse
40/55 (72.7%)
15/55 (27.3%)
Abbreviations: AL amyloidosis, amyloid light-chain amyloidosis; BM, bone
marrow; del17p, 17p deletion; ISS International Staging System; MGUS,
monoclonal gammopathy of undetermined significance.
Mutational landscape of plasma cell disorders
A Rossi et al
3
NRAS
Chr.1p13.2
CCND1
Chr.11q13.3
KRAS
Chr.12p.12.1
NFKB1
Chr.4q24
FAM46C
Chr.1p12
LTB
Chr.6p21.33
BRAF
Chr.7q11.23
IRF4
Chr.6p25.3
CYLD
Chr.16q12.1
TP53
Chr.17p13.1
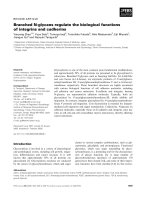
Figure 1. Panel of genes and hot spot regions covered by the next-generation sequencing panel including previously identified alterations.
Alteration type and location of mutations in NRAS, KRAS, FAM46C, CCND1, IRF4, BRAF, CYLD, TP53, NFKB1 and LTB genes previously identified in
multiple myeloma are shown. Red bars indicate regions chosen for hot spot sequencing. AD, transactivation domain; ANK, ankyrin domain;
BD, binding domain; CAP-Gly, cytoskeleton-associated protein glycine-rich; DAG, diacilglycerol; NTP_transf_7, nucleotidyltransferase; p-loop
NTY, containing nucleoside triphosphate hydrolase; Ph, phorbol-ester/DAG-type; RBD, ras binding domain; PK, protein kinase; RHD, real like
domain; TD, tetramerization domain; TNF, tumor necrosis factor domain.
Targeted multiplex NGS detects gene mutations associated with
plasma cell disorders
A total of 10 genes covering 7 hot spots and 9 complete coding
regions were chosen for this multiplex PCR NGS panel based on
mutational frequencies observed in previous whole-genome
studies on multiple myeloma.13,14 Figure 1 gives an overview of
all sequenced genes and previously identified mutational hot spot
regions.
All samples successfully completed targeted sequencing with a
median coverage of 5727 × per amplicon. A total of 64 different
mutations were detected after removal of background and
nonfunctional variants as well as single-nucleotide polymorphisms
(Figure 2 and Table 2). In 32 patients (35.6%), no mutations could
be identified. NRAS mutations were most commonly found in our
samples (28.1%), followed by KRAS (21.3%), TP53 (19.5%), BRAF
(19.1%) and CCND1 (8.9%), whereas FAM46C, IRF4 and LTB were
mutated only in one to three patients. No mutations were found in
the CYLD or NFKB1 gene in our cohort.
Complexity of the mutational landscape in different subsets of
plasma cell dyscrasias
Comprehensive mutational profiling has been largely restricted to
classical myeloma so far. Here, we set out to determine the
mutational architecture of plasma cell dyscrasias with lower
proliferative plasma cell components and compared it with
classical myeloma.
MGUS showed mutations only in NRAS (exons 2 and 3) and BRAF
(exon 15) with a mutation frequency of 36.4% and 27.3%,
respectively. AL amyloidosis revealed a frequency of mutated
cases of 41.7% and these were restricted to KRAS (4.2%), NRAS
(12.5%), TP53 (12.5%), BRAF (16.7%) and CCND1 (4.2%). In contrast,
multiple myeloma showed a more complex mutational landscape
with mutations in KRAS (33.3%), NRAS (33.3%), BRAF (18.5%), TP53
(26.9%), CCND1 (12.7%), FAM46C (1.9%), IRF4 (3.6%) and LTB (1.8%)
genes, in line with previous studies (Table 3). Overall, 78.2% of
myeloma cases carried mutations in the investigated genes. We
found an overlap of mutations in KRAS and NRAS genes activating
mitogen-activated protein kinase signaling in 5/54 myeloma
patients (9.3%), most likely in different tumor subclones because
of different percentages of mutant reads. The mutational
frequency (mutated amplicons per patient) was statistically
different between patients with myeloma and those with nonmyeloma plasma cell dyscrasias (P = 0.008), with more mutations
occurring in myeloma (2.07 ± 0.29) compared with patients with
MGUS and AL amyloidosis (0.91 ± 0.30, Figure 3a). The same was
true when comparing the numbers of patients with at least one
mutation with unmutated cases (78.2% in the myeloma cohort vs
42.9% in the cohort of non-myeloma plasma cell dyscrasias,
P = 0.001, Figure 3b). In a multivariate logistic regression analysis
Blood Cancer Journal
Mutational landscape of plasma cell disorders
A Rossi et al
4
Figure 2. Mutated clones detected by NGS in the MGUS, AL amyloidosis and myeloma cohorts. Genes regulating cell proliferation (red circles),
stress and inflammatory response (green circles), apoptosis (blue circles) and protein translation (orange circles) are shown.
including all exons mutated in ⩾ 5% of cases (KRAS exons 2 and 3,
NRAS exons 2 and 3, TP53 exons 5 and 6, BRAF exons 11 and 15
and CCND1 exon 1), KRAS exon 3 and NRAS exon 3 were
significantly associated with the multiple myeloma disease
category compared with patients with non-myeloma plasma cell
dyscrasias (odds ratio (OR) 9.87, 95% CI 1.07–90.72, P = 0.043 and
OR 7.03, 95% CI 1.49–33.26, P = 0.014, Table 4).
Correlation of mutational profile with conventional cytogenetics
Of all exons mutated in ⩾ 5% of cases, mutations on NRAS exon 3
and TP53 exon 6 were significantly associated with del17p
cytogenetics (OR 0.12, 95% CI 0.02–0.87, P = 0.036 and OR 0.05,
95% CI 0.01–0.54, P = 0.013, respectively, Table 5), whereas there
were no significant associations between high-frequency mutations and a translocation t(4;14).
DISCUSSION
Whole-genome studies reveal an evolving mutational landscape
that not only refines our view on the molecular drivers underlying
plasma cell proliferation, but also adds a new prognostic and also
therapeutic dimension.11,32,33 Here, we set out to establish such a
panel for targeted NGS on an Illumina MiSeq platform. Therefore,
we identified the most frequently mutated genes and hot spot
regions in multiple myeloma, set up a multiplex PCR-based
amplification strategy and tested this panel on unsorted BM
samples of a cohort of 90 patients covering a range of plasma cell
disorders. Our approach proofed to have a high sensitivity and
specificity as well as a turnaround time of ∼ 3 days including data
analysis, making it suitable for clinical application. The major
strength of this approach consists in the fact that it requires only
basic knowledge of primer design and evaluation of multiplex PCR
and that it may conveniently be adapted to special clinical and
Blood Cancer Journal
research interests as new potentially interesting targets—also
those involved in resistance—emerge.
From a biological perspective, our data set reveals interesting
aspects concerning the mutational landscape of a range of plasma
cell disorders that have not been covered in previous wholegenome or targeted sequencing studies to date. Interestingly, we
found—comparable to conventional cytogenetics—that the
mutational landscape closely reflects the biological spectrum of
these conditions, from dyscrasias with a low proliferative plasma
cell component like MGUS or AL amyloidosis to multiple myeloma
with higher proliferative potential. The sensitivity threshold for
mutation detection of 0.1% and the sequencing depth of 100 000
reads per sample rendered our approach suitable even for
conditions with a low BM infiltration rate, as with a PCR input of
50 ng we were able to pick up all mutations per 7500 BM cells.
Although working with whole BM instead of sorted plasma cells
may have disadvantages related to more difficult clonality/
subclonality determination, it is in our view the more suitable
approach when comparing the clonal architecture of conditions
with differing degrees of BM infiltration (42.7% mean BM
infiltration in our myeloma cohort vs 20.6% in AL amyloidosis
and o10% in MGUS). This is because our approach normalizes
the number of mutated amplicons to a constant number of BM
cells instead of an artificially enriched plasma cell population.
Therefore, our numbers more linearly reflect the mutational
burden of the whole tumor mass.
The depth of sequencing of our study is higher than in the ones
previously reported and this allows for a validation of numerous
low burden variants and provides enough resolution to dissect the
subclones of the tumor. Concerning the TP53 gene, we detected
mutations in 26.9% of our myeloma patients. In accordance with
Lodé et al.28 and other more recent papers, most of the mutations
identified here were single-nucleotide missense mutations.12,13,15
We observed a higher frequency of mutations with respect to
Mutational landscape of plasma cell disorders
A Rossi et al
5
Table 2.
NRAS
KRAS
FAM46C
TP53
BRAF
CCND1
LTB
IRF4
Description of the genes and type of mutations identified by NGS in the present data set
1
2
3
4
5
6
7
8
9
10
11
12
13
14
15
16
17
18
19
20
21
22
23
24
25
26
27
28
29
30
31
32
33
34
35
36
37
38
39
40
41
42
43
44
45
46
47
48
49
50
51
52
53
54
55
56
57
58
59
60
61
62
63
64
Variant
AA change
Mutation
Cancer
COSMIC
MM literature
No. of patients
c.34G4T
c.38G4A
c.37G4C
c.37G4T
c.38G4T
c.145G4A
c.182A4G
c.181C4A
c.182A4T
c.190T4G
c.35G4A
c.35G4C
c.34G4C
c.34G4A
c.35G4T
c.38G4A
c.73C4T
c.109G4A
c.169G4A
c.182A4G
c.182A4C
c.183A4T
c.181C4A
c.201G4A
c.824_826del
c.376T4G
c.390_392del
c.415A4G
c.437G4A
c.440T4G
c.520A4G
c.538G4A
c.558T4A
c.569C4T
c.574C4T
c.587G4T
c.587G4A
c.589G4A
c.637C4G
c.638G4A
c.637C4T
c.646G4A
c.647T4G
c.661G4A
c.670G4A
c.892G4A
c.1324G4A
c.1331G4A
c.1345G4A
c.1349G4A
c.1363G4A
c.1390G4A
c.1396G4A
c.1400C4T
c.1405G4A
c.1756G4A
c.1780G4A
c.1790T4G
c.1799T4A
c.1807C4T
c.1843G4A
c.122C4T
c.202G4C
c.368A4G
p.G12C
p.G13D
p.G13R
p.G13C
p.G13V
p.E49K
p.Q61R
p.Q61K
p.Q61L
p.Y64D
p.G12D
p.G12A
p.G12R
p.G12S
p.G12V
p.G13D
p.Q25*
p.E37K
p.D57N
p.Q61R
p.Q61P
p.Q61H
p.Q61K
p.M67I
p.I276delI
p.Y126D
p.N131delN
p.K139R
p.W146*
p.V147G
p.R174G
p.E180K
p.D186E
p.P190L
p.Q192*
p.R196L
p.R196Q
p.V197M
p.R213G
p.R213Q
p.R213*
p.V216M
p.V216G
p.E221K
p.E224K
p.E298K
p.G442S
p.R444Q
p.D449N
p.W450*
p.G455R
p.G464R
p.G466R
p.S467L
p.G469R
p.E586K
p.D594N
p.L597R
p.V600E
p.R603*
p.G615R
p.S41L
p.G68R
p.K123R
Missense
Missense
Missense
Missense
Missense
Missense
Missense
Missense
Missense
Missense
Missense
Missense
Missense
Missense
Missense
Missense
Nonsense
Missense
Missense
Missense
Missense
Missense
Missense
Missense
In-frame_D
Missense
In-frame_D
Missense
Nonsense
Missense
Missense
Missense
Missense
Missense
Nonsense
Missense
Missense
Missense
Missense
Missense
Nonsense
Missense
Missense
Missense
Missense
Missense
Missense
Missense
Missense
Nonsense
Missense
Missense
Missense
Missense
Missense
Missense
Missense
Missense
Missense
Nonsense
Missense
Missense
Missense
Missense
MMa
MM
MM
MM
HL, S, LI, CN, ST
L,S
MM
MM
MM
MM
MM
MM
MM
MM
MM
MM
LI
HL, LI, L, P, BT
LI
MM
LI
MM
MM
MM
MM
MMa
LI, LV, HL
K, B
O, P, LV, S
HL
P
PLC
UAT
MM
O, UAT, L, LV, P
MMa
ST,B,Th
UAT, P
MMa
MMa
MM
MM
UAT, O, E, LI, S
SG, V
HL, L, LI, UT
HL, ED
S
ED
B
S
S
MMa
MMa
MM
MMa
MM
MM
MMa
MM
St, En
S
UT
MM
MM
/
/
/
/
COSM574
COSM14199
/
/
/
/
/
/
/
/
/
/
COSM5352251
COSM3738516
COSM1166779
/
COSM551
/
/
/
/
/
COSM4968986
COSM45063
COSM43609
COSM44309
COSM43763
/
COSM45637
/
COSM19733
/
COSM44599
COSM43779
/
/
/
/
COSM43681
COSM44853
COSM10894
COSM44031
COSM253323
COSM21601
COSM3832071
COSM253324
COSM1162151
/
/
/
/
/
/
/
/
COSM33729
COSM1140
COSM415762
/
/
Refs. 11,12,27
4
1
2
1
1
5
5
7
2
1
2
1
1
2
1
2
4
2
2
2
4
7
1
1
1
1
1
1
1
1
1
1
2
1
5
1
2
1
1
4
3
1
1
3
1
3
1
1
7
1
1
2
2
1
2
2
1
1
3
1
2
8
1
2
Ref. 12
Refs. 13,14,16,27
MMRF
/
/
Refs. 11–13,16,27
Refs. 11,13,16,27
Ref. 12,27
Ref. 15
ref. 12,15,27
Refs. 12–14,27
Refs. 11,13,14,16,27
Ref. 27
Refs. 12,13,27
Refs. 11–13,16,27
/
/
/
Refs. 11,13,16,27
/
Refs. 11,13,16,27
Ref. 13
Ref. 11
Ref. 13
Refs. 12,28
/
/
/
/
/
Ref. 29
/
Ref. 28
/
Refs. 12,16,30
/
/
Ref. 15
Ref. 15
Ref. 15
MMRF
/
/
/
/
/
/
/
/
/
Ref. 15
Ref. 15
Ref. 15
Refs. 16,27
Ref. 13
Ref. 27
Ref. 12
Refs. 13,15,16,27
/
/
/
Ref. 15
Refs. 15,16,31
Abbreviations: AA, amino acid; B, breast; BT, biliary tract; CN, central nervous system; E, esophagus; ED, endometrium; En, endometrium; HL, hematopoietic
and lymphoid; K, kidney; L, lung; LI, large intestine; LV; liver; MM, multiple myeloma; MMRF, Multiple Myeloma Research Foundation; NGS, next-generation
sequencing; O, ovary; P, pancreas; PLC, plasma cell leukemia; S, skin; SG, salivary gland; St, stomach; ST, soft tissue; T, thyroid; Th, thymus; UAT, upper
aerodigestive tract; UT, urinary tract; V, vulva. aDifferent amino acid substitution as previously reported.
Blood Cancer Journal
Mutational landscape of plasma cell disorders
A Rossi et al
6
Table 3.
NRAS
KRAS
Review of the literature
Our data set
% Frequency
MM literature
% Frequency
Sequencing methodology
33.3
18
20
25
20.8
19.4
23.7
26.5
31.8
23
25
13.9
21.2
26.3
32.6
11
12
5.6
13
8
15
27.8
11
8
3
6
15
4.2
6.7
4
10.6
3
1.4
5
3
3.2
2
4
2
3
4.2
2.4
1.5
Library prep.
Library prep.
Library prep.
PCR ampl.
Library prep.
Library prep.
PCR ampl.
Library prep.
Library prep.
Library prep.
PCR ampl.
Library prep.
Library prep.
PCR ampl.
Library prep.
Library prep.
Library prep.
Library prep.
Library prep.
Library prep.
PCR ampl.
Library prep.
Library prep.
PCR ampl.
Library prep.
Library prep.
PCR ampl.
Library prep.
Library prep.
PCR ampl.
Library prep.
PCR ampl.
Library prep.
Library prep.
Library prep.
Library prep.
Library prep.
Library prep.
Library prep.
PCR ampl.
Library prep.
Library prep.
33.3
1.9
FAM46C
TP53
BRAF
26.9
18.5
CCND1
12.7
LTB
IRF4
1.8
3.6
CYLD
0
NFKB1
0
Material
Sorted
Sorted
Sorted
Sorted
Sorted
Sorted
Sorted
Sorted
Sorted
Sorted
Sorted
Sorted
Sorted
Sorted
Sorted
Sorted
Sorted
Sorted
Sorted
Sorted
Sorted
Sorted
Sorted
Sorted
Sorted
Sorted
Sorted
Sorted
Sorted
Sorted
Sorted
Sorted
Sorted
Sorted
Sorted
Sorted
Sorted
Sorted
Sorted
Sorted
Sorted
Sorted
BM
BM
BM
BM
BM
BM
BM
BM
BM
BM
BM
BM
BM
BM
BM
BM
BM
BM
BM
BM
BM
BM
BM
BM
BM
BM
BM
BM
BM
BM
BM
BM
BM
BM
BM
BM
BM
BM
BM
BM
BM
BM
Sequencing machine
References
GA-II Illumina
GA-II or HiSeq Illumina
HiSeq Illumina
PGM Life Technologies
GA IIX Illumina
GA-II Illumina
Genome Seq. Junior (Roche)
GA-II Illumina
GA-II or HiSeq Illumina
HiSeq Illumina
PGM Life Technologies
GA IIX Illumina
GA-II Illumina
Genome Seq. Junior (Roche)
GA-II or HiSeq Illumina
HiSeq Illumina
GA IIX Illumina
GA-II Illumina
GA-II or HiSeq Illumina
HiSeq Illumina
PGM Life Technologies
GA IIX Illumina
GA-II Illumina
Genome Seq. Junior (Roche)
GA-II or HiSeq Illumina
HiSeq Illumina
PGM Life Technologies
GA IIX Illumina
GA-II Illumina
Genome Seq. Junior (Roche)
HiSeq Illumina
PGM Life Technologies
GA-II Illumina
GA IIX Illumina
GA IIX Illumina
GA-II Illumina
GA-II Illumina
GA-II or HiSeq Illumina
HiSeq Illumina
PGM Life Technologies
GA IIX Illumina
HiSeq Illumina
11
12
13
14
15
16
27
11
12
13
14
15
16
27
12
13
15
16
12
13
14
15
16
29
12
13
14
15
16
27
13
14
16
15
15
16
31
12
13
14
15
13
Abbreviations: ampl, amplification; BM, bone marrow; GA, Genome Analyzer; MM, multiple myeloma; prep, preparation.
Figure 3. Differences in the mutational load between disease categories. (a) Difference in mutational frequency (number of mutant exons per
patient) between myeloma and non-myeloma plasma cell dyscrasias. (b) Difference in percentage of patients with mutations (⩾1 mutation per
case) between myeloma and non-myeloma plasma cell dyscrasias.
Blood Cancer Journal
Mutational landscape of plasma cell disorders
A Rossi et al
7
Table 4. Association between frequently mutated genes and the
‘multiple myeloma’ disease category (vs non-myeloma plasma cell
dyscrasias)a
KRAS exon 2
KRAS exon 3
NRAS exon 2
NRAS exon 3
TP53 exon 5
TP53 exon 6
BRAF exon 11
BRAF exon 15
CCND1 exon 1
Odds ratio (95% CI)
P-value
b
0.999
0.043
0.644
0.014
0.224
0.067
0.235
0.118
0.170
9.87 (1.07–90.72)
0.67 (0.12–3.72)
7.03 (1.49–33.26)
4.38 (0.41–47.44)
8.98 (0.86–94.09)
3.10 (0.48–19.95)
0.17 (0.02–1.56)
5.03 (0.50–50.51)
Abbreviation: 95% CI, 95% confidence interval. aAll exons mutated in ⩾ 5%
of all patients were included in the multivariate logistic regression analysis.
Exons were counted as mutated if ⩾ 1 mutation was present. bCannot be
estimated as there was no patient with ⩾ 1 KRAS exon 2 mutation in the
cohort with non-myeloma plasma cell dyscrasias. Statistical significant
values are highlighted in bold.
Table 5. Association between frequently mutated genes and
evidence of del17pa
KRAS exon 2
KRAS exon 3
NRAS exon 2
NRAS exon 3
TP53 exon 5
TP53 exon 6
BRAF exon 11
BRAF exon 15
CCND1 exon 1
Odds ratio (95% CI)
P-value
1.15 (0.07–19.13)
0.40 (0.04–3.59)
0.921
0.409
0.999
0.036
0.968
0.013
0.515
0.985
0.882
b
0.12 (0.02–0.87)
1.07 (0.04–33.18)
0.05 (0.01–0.54)
0.38 (0.02–6.82)
0.97 (0.05–20.13)
1.29 (0.47–35.21)
Abbreviation: 95% CI, 95% confidence interval. aAll exons mutated in ⩾ 5%
of all patients were included in the multivariate logistic regression analysis.
Exons were counted as mutated if ⩾ 1 mutation was present. bCannot be
estimated as there was no patient with ⩾ 1 NRAS exon 2 mutation in the
cohort of patients with del17p. Statistical significant values are highlighted
in bold.
Lionetti et al.29 and Walker et al.,15 a finding that can be related to
the higher coverage of our targeted NGS approach. Moreover,
TP53 mutations were significantly correlated with del17p cytogenetics, consistent with the literature.13 In line with previous
studies, we report a high number of mutations in the mitogenactivated protein kinase signaling pathway with many, most often
subclonal mutations in NRAS, KRAS and BRAF.13,27 This suggests a
striking subclonal convergence on this pathway in myeloma that
may be exploited therapeutically. The fact that our panel includes
prognostically relevant genes (NRAS, KRAS, TP53, BRAF) as well as
potentially actionable targets or pathways (RAS, TP53, BRAF,
CCND1, IRF4) also renders our approach a useful tool for improving
prognostication and treatment in plasma cell disorders.17–23 The
complex genomic architecture evident in our data set, however,
highlights the need for therapeutic strategies directed at multiple
targets rather than at a single genomic anomaly and underscores
the success of combination therapies.
Taken together, we characterized the mutational landscape of a
patient cohort with plasma cell dyscrasias using an NGS-based
approach that may easily be adapted to other clinical or scientific
contexts. Future technical modifications of this platform should
integrate translocation detection and add more targets involved
in drug resistance to ultimately track clonal variability, more
precisely predict prognosis and guide treatment decisions with
one simple assay in clinical routine diagnostics.
CONFLICT OF INTEREST
The authors declare no conflict of interest.
ACKNOWLEDGEMENTS
This study was supported by the T and L de Beaumont Bonelli Foundation for Cancer
Research (to MB), a fellowship of the T and L de Beaumont Bonelli Foundation for
Cancer Research (to AR) and the Hubertus Wald foundation, Hamburg, supporting a
professorship for immunological cancer research (to MB).
REFERENCES
1 Kyle RA, Therneau TM, Rajkumar SV, Larson DR, Plevak MF, Offord JR et al.
Prevalence of monoclonal gammopathy of undetermined significance. N Engl J
Med 2006; 354: 1362–1369.
2 Kyle RA, Therneau TM, Rajkumar SV, Offord JR, Larson DR, Plevak MF et al.
A long-term study of prognosis in monoclonal gammopathy of undetermined
significance. N Engl J Med 2002; 346: 564–569.
3 Palumbo A, Anderson K. Multiple myeloma. N Engl J Med 2011; 364: 1046–1060.
4 Merlini G, Seldin DC, Gertz MA. Amyloidosis: pathogenesis and new therapeutic
options. J Clin Oncol 2011; 29: 1924–1933.
5 Merlini G, Stone MJ. Dangerous small B-cell clones. Blood 2006; 108: 2520–2530.
6 Binder M, Rajkumar SV, Ketterling RP, Dispentieri A, Lacy MQ, Gertz MA et al.
Occurrence and prognostic significance of cytogenetic evolution in patients with
multiple myeloma. Blood Cancer J 2016; 6: e401.
7 Rajkumar SV, Gupta V, Fonseca R, Dispenzieri A, Gonsalves WI, Larson D et al.
Impact of primary molecular cytogenetic abnormalities and risk of progression in
smoldering multiple myeloma. Leukemia 2013; 27: 1738–1744.
8 Mikulasova A, Smetana J, Wayhelova M, Janyskova H, Sandecka V, Kufova Z et al.
Genomewide profiling of copy-number alteration in monoclonal gammopathy of
undetermined significance. Eur J Haematol 2016; 97: 568–575.
9 Kim SY, Im K, Park SN, Kim JA, Yoon SS, Lee DS. Burden of cytogenetically
abnormal plasma cells in light chain amyloidosis and their prognostic relevance.
Leuk Res 2016; 44: 45–52.
10 Bochtler T, Hegenbart U, Heiss C, Benner A, Moos M, Seckinger A et al.
Hyperdiploidy is less frequent in AL amyloidosis compared with monoclonal
gammopathy of undetermined significance and inversely associated with translocation t(11;14). Blood 2011; 117: 3809–3815.
11 Walker BA, Wardell CP, Melchor L, Hulkki S, Potter NE, Johnson DC et al. Intraclonal
heterogeneity and distinct molecular mechanisms characterize the development
of t(4;14) and t(11;14) myeloma. Blood 2012; 120: 1077–1086.
12 Lohr JG, Stojanov P, Carter SL, Cruz-Gordillo P, Lawrence MS, Auclair D et al.
Widespread genetic heterogeneity in multiple myeloma: implications for targeted
therapy. Cancer Cell 2014; 25: 91–101.
13 Bolli N, Avet-Loiseau H, Wedge DC, Van Loo P, Alexandrov LB, Martincorena I et al.
Heterogeneity of genomic evolution and mutational profiles in multiple myeloma.
Nat Commun 2014; 5: 2997.
14 Kortüm KM, Langer C, Monge J, Bruins L, Egan JB, Zhu YX et al. Targeted
sequencing using a 47 gene multiple myeloma mutation panel (M(3) P) in -17p
high risk disease. Br J Haematol 2015; 168: 507–510.
15 Walker BA, Boyle EM, Wardell CP, Murison A, Begum DB, Dahir NM et al.
Mutational spectrum, copy number changes, and outcome: results of a sequencing study of patients with newly diagnosed myeloma. J Clin Oncol 2015; 33:
3911–3920.
16 Chapman MA, Lawrence MS, Keats JJ, Cibulskis K, Sougnez C, Schinzel AC et al.
Initial genome sequencing and analysis of multiple myeloma. Nature 2011; 471:
467–472.
17 Teoh PJ, Chng WJ. p53 abnormalities and potential therapeutic targeting in
multiple myeloma. Biomed Res Int 2014; 2014: 717919.
18 Andrulis M, Lehners N, Capper D, Penzel R, Heining C, Huellein J et al.
Targeting the BRAF V600E mutation in multiple myeloma. Cancer Discov 2013; 3:
862–869.
19 Sharman JP, Chmielecki J, Morosini D, Palmer GA, Ross JS, Stephens PJ et al.
Vemurafenib response in 2 patients with posttransplant refractory BRAF
V600E-mutated multiple myeloma. Clin Lymphoma Myeloma Leuk 2014; 14:
e161–e163.
20 Boyd KD, Ross FM, Walker BA, Wardell CP, Tapper WJ, Chiecchio L et al. Mapping
of chromosome 1p deletions in myeloma identifies FAM46C at 1p12 and CDKN2C
at 1p32.3 as being genes in regions associated with adverse survival. Clin Cancer
Res 2011; 17: 7776–7784.
Blood Cancer Journal
Mutational landscape of plasma cell disorders
A Rossi et al
8
21 Jenner MW, Leone PE, Walker BA, Ross FM, Johnson DC, Gonzalez D et al. Gene
mapping and expression analysis of 16q loss of heterozygosity identifies
WWOX and CYLD as being important in determining clinical outcome in multiple
myeloma. Blood 2007; 110: 3291–3300.
22 Mansoor A, Akhter A, Pournazari P, Mahe E, Shariff S, Farooq F et al. Protein
expression for novel prognostic markers (cyclins D1, D2, D3, B1, B2, ITGβ7, FGFR3,
PAX5) correlate with previously reported gene expression profile patterns in
plasma cell myeloma. Appl Immunohistochem Mol Morphol 2015; 23: 327–333.
23 Ngo BT, Felthaus J, Hein M, Follo M, Wider D, Ihorst G et al. Monitoring
bortezomib therapy in multiple myeloma: screening of cyclin D1, D2, and D3 via
reliable real-time polymerase chain reaction and association with clinicopathological features and outcome. Leuk Lymphoma 2010; 51: 1632–1642.
24 Bolger AM, Lohse M, Usadel B. Trimmomatic: a flexible trimmer for Illumina
sequence data. Bioinformatics 2014; 30: 2114–2120.
25 Edgar RC. Search and clustering orders of magnitude faster than BLAST. Bioinformatics 2010; 26: 2460–2461.
26 Kent WJ. BLAT--the BLAST-like alignment tool. Genome Res 2002; 12: 656–664.
27 Lionetti M, Barbieri M, Todoerti K, Agnelli L, Marzorati S, Fabris S et al. Molecular
spectrum of BRAF, NRAS and KRAS gene mutations in plasma cell dyscrasias:
implication for MEK-ERK pathway activation. Oncotarget 2015; 6: 24205–24217.
28 Lodé L, Eveillard M, Trichet V, Soussi T, Wuilleme S, Richebourg S et al.
Mutations in TP53 are exclusively associated with del(17p) in multiple myeloma.
Haematologica 2010; 95: 1973–1976.
29 Lionetti M, Barbieri M, Manzoni M, Fabris S, Bandini C, Todoerti K et al. Molecular
spectrum of TP53 mutations in plasma cell dyscrasias by next generation
30
31
32
33
sequencing: an Italian cohort study and overview of the literature. Oncotarget
2016; 7: 21353–21361.
Chng WJ, Price-Troska T, Gonzalez-Paz N, Van Wier S, Jacobus S, Blood E et al.
Clinical significance of TP53 mutation in myeloma. Leukemia 2007; 21:
582–584.
Melchor L, Brioli A, Wardell CP, Murison A, Potter NE, Kaiser MF et al. Single-cell
genetic analysis reveals the composition of initiating clones and phylogenetic
patterns of branching and parallel evolution in myeloma. Leukemia 2014; 28:
1705–1715.
Anderson KC. Multiple myeloma: a clinical overview. Oncology (Williston Park)
2011; 25: 3–9.
Fakhri B, Vij R. Clonal evolution in multiple myeloma. Clin Lymphoma Myeloma
Leuk 2016; 16: S130–S134.
This work is licensed under a Creative Commons Attribution 4.0
International License. The images or other third party material in this
article are included in the article’s Creative Commons license, unless indicated
otherwise in the credit line; if the material is not included under the Creative Commons
license, users will need to obtain permission from the license holder to reproduce the
material. To view a copy of this license, visit />by/4.0/
© The Author(s) 2017
Supplementary Information accompanies this paper on Blood Cancer Journal website ( />
Blood Cancer Journal