regional variations in the prevalence and misdiagnosis of air flow obstruction in china baseline results from a prospective cohort of the china kadoorie biobank ckb
Bạn đang xem bản rút gọn của tài liệu. Xem và tải ngay bản đầy đủ của tài liệu tại đây (2.79 MB, 12 trang )
Respiratory epidemiology
Regional variations in the prevalence
and misdiagnosis of air flow obstruction
in China: baseline results from
a prospective cohort of the China
Kadoorie Biobank (CKB)
Om P Kurmi,1 Liming Li,2,3 Margaret Smith,1 Mareli Augustyn,1 Junshi Chen,4
Rory Collins,1 Yu Guo,2 Yabin Han,5 Jingxin Qin,6 Guanqun Xu,7 Jian Wang,8
Zheng Bian,2 Gang Zhou,9 Kourtney Davis,10 Richard Peto,1 Zhenming Chen,1
on behalf of the China Kadoorie Biobank Collaborative Group
To cite: Kurmi OP, Li L,
Smith M, et al. Regional
variations in the prevalence
and misdiagnosis of air flow
obstruction in China: baseline
results from a prospective
cohort of the China Kadoorie
Biobank (CKB). BMJ Open
Resp Res 2014;1:e000025.
doi:10.1136/bmjresp-2014000025
▸ Additional data are
published online only. To
view this file please visit the
journal online (.
org/10.1136/bmjresp-2014000025)
Received 6 February 2014
Revised 14 April 2014
Accepted 16 April 2014
ABSTRACT
Background: Despite the great burden of chronic
respiratory diseases in China, few large multicentre,
spirometry-based studies have examined its
prevalence, rate of underdiagnosis regionally or the
relevance of socioeconomic and lifestyle factors.
Methods: We analysed data from 512 891 adults in the
China Kadoorie Biobank, recruited from 10 diverse
regions of China during 2004–2008. Air flow
obstruction (AFO) was defined by the lower limit of
normal criteria based on spirometry-measured lung
function. The prevalence of AFO was analysed by
region, age, socioeconomic status, body mass index
(BMI) and smoking history and compared with the
prevalence of self-reported physician-diagnosed chronic
bronchitis or emphysema (CB/E) and its symptoms.
Findings: The prevalence of AFO was 7.3% in men
(range 2.5–18.2%) and 6.4% in women (1.5–18.5%).
Higher prevalence of AFO was associated with older age
( p<0.0001), lower income ( p<0.0001), poor education
( p<0.001), living in rural regions ( p<0.001), those who
started smoking before the age of 20 years ( p<0.001)
and low BMI ( p<0.001). Compared with self-reported
diagnosis of CB/E, 88.8% of AFO was underdiagnosed;
underdiagnosis proportion was highest in 30–39-year
olds (96.7%) compared with the 70+ age group
(81.1%), in women (90.7%), in urban areas (89.4%),
in people earning 5K–10 K ¥ monthly (90.3%) and in
those with middle or high school education (92.6%).
Interpretation: In China, the burden of AFO based on
spirometry was high and significantly greater than that
estimated based on self-reported physician-diagnosed
CB/E, especially in rural areas, reflecting major issues
with diagnosis of AFO that will impact disease treatment
and management.
For numbered affiliations see
end of article.
Correspondence to
Dr Om P Kurmi;
INTRODUCTION
Globally, chronic obstructive pulmonary
disease (COPD) is responsible for about
KEY MESSAGES
▸ This is the largest population-based multi-centre
study of prevalence and socioeconomic and lifestyles correlates of air flow obstruction (AFO)
representative of adult Chinese population
selected from ten diverse regions of China.
▸ The data suggests up to 10-fold difference in
prevalence of AFO between different regions in
China for both men and women.
▸ The result highlights that mis-diagnosis of AFO
(>80%) in Chinese population is a major issue
requiring immediate attention to improve both
appropriate management and prevention
programs.
three million annual deaths, and for an even
greater burden from disability,1 with particularly high-disease prevalence in low-income
and middle-income countries such as China
where smoking prevalence is very high
among men.2 In China, over 90% of 1.4
million respiratory-related deaths3 and 10.4
million disability-adjusted life years4 are
attributed to COPD in adults, with most of
the COPD-related deaths occurring at the
age of 60 years or older.4 Among published
epidemiological studies conducted in China,
there are large unexplained variations in the
age-specific rates of COPD between men and
women and between different regions, with
reported prevalence ranging from 3% to
12% in ages above 40 years.5–7
Smoking is a major risk factor for COPD
but few women in China smoke (<5%), so
this exposure cannot explain the relatively
high prevalence of COPD seen in many parts
of China.8 There is also evidence that
Kurmi OP, Li L, Smith M, et al. BMJ Open Resp Res 2014;1:e000025. doi:10.1136/bmjresp-2014-000025
1
Open Access
exposure to environmental air pollutants particularly
coal and wood smoke for cooking and heating, low
socioeconomic status and lung infections such as tuberculosis earlier in life may contribute to increased risk of
COPD, but the evidence is still extremely limited in
China.5 As well as risk exposures, difference in survey
methods and COPD diagnosis methods between different studies could also affect the burden of the disease
estimated for different populations. There is good evidence that defining COPD based only on self-reported
physician-diagnosis tends to significantly underestimate
the true burden, particularly in resource-poor areas
where access to healthcare is limited and also possibly
due to lack of awareness of their condition.9 Despite
this, most of the previous studies in China tended to use
self-reported information rather than spirometry-defined
COPD. Consequently, substantial uncertainty remains
about the true burden of COPD in the population.
To help fill the gap in knowledge, we analysed the
cross-sectional data of the China Kadoorie Biobank
(CKB) of over 0.5 million adults from 10 diverse regions
of China.10 The aims of the study were (1) to estimate
the prevalence of air flow obstruction (AFO) based on
the measured lung function and its variation with socioeconomic and lifestyle factors, (2) to examine the prevalence of self-reported physician-diagnosed chronic
bronchitis/emphysema (CB/E), rates of treatment and
(3) to assess the proportion of underdiagnosis by comparing the prevalence of AFO based on spirometry with
self-reported physician-diagnosed CB/E and any variation with socioeconomic and lifestyle factors.
METHODS
Study design and participants
A detailed description of the study design, survey
methods and characteristics of participants for the CKB
prospective study is published elsewhere.8 10 In brief, the
baseline survey took place between 2004 and 2008
involving five rural and five urban regions, chosen
according to local disease patterns, exposure to certain
risk factors, population stability, quality of death and diseases registries, local commitment and capacity. Overall,
a total of 512 891 adults (210 222 men and 302 669
women) aged 30–79 were enrolled. All participants gave
informed written consent.
Data collection
Laptop-based questionnaire was administered to each
participant by trained health workers, who collected
detailed information on demographic and socioeconomic status, dietary and other lifestyle factors
(eg, smoking, alcohol use), exposure to passive smoking
and household air pollution, respiratory symptoms
(eg, chronic cough, production of chronic phlegm,
breathlessness and severity of breathlessness), medical
history of physician-diagnosed respiratory (chronic bronchitis, emphysema, asthma, tuberculosis) and other
2
conditions (eg, stroke, ischaemic heart disease, cancer
and diabetes), physical activity, sleeping and mental
status and reproductive history (for women) at baseline.
A range of physical measurements was taken, including
standing and sitting height, weight, bioimpedance,
exhaled carbon-monoxide and blood pressure.
Spirometry and diagnostic criteria for AFO
Spirometry was carried out by trained health technicians,
using portable handheld ‘Micro spirometer’ (Micro
Medical Limited, Rochester, Kent, England) in accordance with modified American Thoracic Society (ATS)11
procedures developed by our respiratory team. The spirometer we used during the baseline survey did not
display flow volume loops, and hence the acceptability
criterion of blows was modified. Participants made some
practice blows, after which the results of two successful
manoeuvres (as judged by the technician) were recorded
for each participant. The larger of the two forced expiratory volume in 1 s (FEV1) and forced vital capacity (FVC)
were used for calculating FEV1/FVC ratio and for further
analysis. No bronchodilators were used at the baseline
survey. Overall, 202 men and 194 women with an FEV1/
FVC >1 were excluded, leaving 210 020 (99.9%) men and
302 475 (99.9%) women for the present analysis.
For the present analysis, AFO is defined according to
the lower limit of normal (LLN) definition as FEV1/FVC
southeast Asian and northeast Asian population.12 The
prevalence of modified restrictive abnormality, defined
as an FEV1/FVC ≥LLN and FVC
Global Initiative for Obstructive Lung Disease (GOLD)
criterion (FEV1/FVC <0.7), but without postbronchodilator lung function indices.
We defined chronic bronchitis as the presence of
cough and phlegm for more than 3 months in the past
12 months. Underdiagnosis was defined as participants
with AFO defined by spirometry but not physiciandiagnosed CB/E and overdiagnosis was defined as those
participants with physician-diagnosed CB/E but not
AFO defined by spirometry.
Statistical methods
All analyses were conducted separately for men and
women. Baseline demographic characteristics were calculated by rural/urban area, and crude prevalence of
AFO was calculated by region and urban/rural area.
The prevalence of AFO (directly standardised to the
study population male or female 5-year age group structure) was calculated for each region. Further, AFO prevalence for strata of various potential risk factors or
correlates within urban and rural areas was calculated
(directly standardised to the study population 10-year
age group and region structure, as necessary). Similarly,
Kurmi OP, Li L, Smith M, et al. BMJ Open Resp Res 2014;1:e000025. doi:10.1136/bmjresp-2014-000025
Open Access
we also calculated age and region-standardised prevalence of a number of chronic health conditions among
those with AFO. Association between participants’
characteristics and AFO diagnosis type was carried out
using multivariate logistic regression. All statistical analyses were performed using SAS V.9.3.
RESULTS
At baseline, the overall mean age of participants was 52.0
±10.7 years, 59% were women and 56% were from rural
areas (table 1). The proportion of participants having at
least 6 years of formal education was higher in urban compared with rural areas and higher in men than in women.
The prevalence of ever regular smoking was significantly
higher among men than women (74.3% vs 3.2%) and
somewhat higher in rural than in urban men (77.7% vs
70.1%). The proportion reporting current use of clean
fuel (ie, gas or electricity for cooking) was much higher in
urban than in rural areas for men (56.5% vs 7.1%) and
women (83.6% vs 12.4%). The mean body mass index
(BMI) was lower in rural than in urban areas for men
(24.3 vs 22.7 kg/m2) and women (24.3 vs 23.5 kg/m2),
with approximately 5–6% of rural participants classified as
underweight (BMI <18.5 kg/m2) compared with around
3% of urban participants (table 1).
The lung function indices (FEV1, FVC and FEV1/FVC)
decreased steeply with increasing age (see online supplementary figures S1–S3) and were lower in rural than
urban areas for men and women at all age groups (data
not shown). Among women and men, ever smokers had
higher FEV1 until the mid-40s; whereas FVC continued to
be higher until the 50s, but then FEV1 and FVC
decreased steeply with increasing age and were lower in
ever smokers compared with never smokers.
Overall at baseline, 4.1% reported having chronic
cough and phlegm, which was higher in rural than in
urban areas for men (7.3% vs 6.2%, p<0.001) and
women (2.6% vs 1.8%, p<0.001). Similar rural and
urban differences were seen for breathlessness while
walking on level ground for men (5.8% vs 3.4%,
p<0.001) and women (8.5% vs 4.7%, p<0.001), but the
reported prevalence was higher in women (table 2).
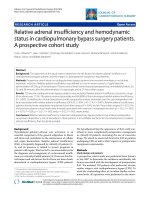
The prevalence of AFO (based on LLN) was higher in
rural than urban areas for men (9.2% vs 4.8%, p<0.001)
and women (7.7% vs 4.8%, p<0.001). Similar patterns
were observed when AFO was based on fixed ratio criterion (GOLD grade 1+), and the overall prevalence was
slightly lower compared with LLN (FEV1/FVC) except
for those aged >60 years (figure 1, table 3 and see
online supplementary table S2). Regardless of the different definitions used, there was a nearly 10-fold variation
in the prevalence of AFO across the 10 study regions,
with the highest prevalence observed in Sichuan (18.2%
vs 18.5%) and lowest in Harbin province (2.5% vs 1.5%)
for men and women (figure 1, see online supplementary table S1). Age-adjusted prevalence based on GOLD
grade 2+ was lower than LLN (FEV1/FVC) estimates in
rural and urban men and women (figure 1, see online
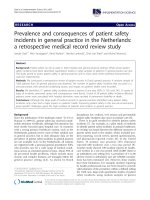
supplementary table S3). Similarly, the prevalence of
AFO (adjusted for region) increased sharply among
smokers particularly after the age of 50 (figure 2 and
see online supplementary table S4). The prevalence of
AFO among rural men and women increased significantly with age, exposure to wood or coal smoke while
cooking, initiation of smoking at a younger age (under
20 years), ex-smokers who stopped smoking due to ill
health and BMI <18.5 kg/m2, while AFO decreased with
higher annual income and education (table 3, see
online supplementary tables S2 and S3).
The prevalence of chronic bronchitis was somewhat
greater in rural than in urban areas for men (7.3% vs
6.2%) and women (2.6% vs 1.8%). The prevalence of
self-reported physician-diagnosed CB/E was lower and
approximately the same in the rural and urban areas for
men (3.2% vs 2.9%) and women (2.1% vs 2.4%), among
whom less than one-third reported currently taking
medication for the condition. Around 80% of rural and
71% of urban men who reported a prior diagnosis of
CB/E were regular smokers and also reported chronic
cough or breathlessness.
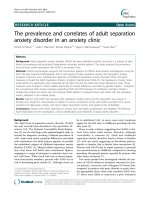
In most regions, the prevalence of CB/E was lower than
that of AFO diagnosed by spirometry. Of participants with
prior physician diagnosis of CB/E, 29.2% and 28.0% had
AFO based on LLN and GOLD criteria, respectively
(figure 3 and supplementary figure S4). The overall
underdiagnosis proportion of AFO was 88.8%, higher in
urban than in rural areas (89.4% vs 88.4%) and higher in
women compared with men (90.7% vs 86.2%). Similarly,
the AFO overdiagnosis proportion was slightly higher in
urban than in rural areas (81% vs 62.2%) and higher in
women compared with men (73.7% vs 67.7%) (table 4).
Of those classified as AFO by spirometry, only 11.2% were
correctly diagnosed previously by the physician. The
underdiagnosis proportion of AFO was higher in those
with lower household income, younger age, having less
chronic respiratory symptoms, women, in current regular
smokers, but lower in ex-smokers (see online supplementary table S4). There was wide regional variation in the
underdiagnosis and overdiagnosis proportion, as well as
variation in the treatment for physician-diagnosed CB/E
cases (see online supplementary table S1 and figure S5).
Sichuan, with the highest prevalence of AFO, had the
lowest percentages of overdiagnosed (<40%) AFO.
Patterns similar to underdiagnosis were observed for overdiagnosis as well, except it was lower in women. There was
also a lack of concordance between self-reported
symptom-based chronic bronchitis and spirometry-based
AFO (table 3, see online supplementary table S1 and
figure 4, see online supplementary figure S6).
The prevalence of self-reported doctor-diagnosed
asthma was <1% among men and women, whereas
tuberculosis was marginally greater in urban than in
rural areas for men (2.6% vs 1.6%) and women (1.5% vs
0.8%). The prevalence of restrictive abnormality was
highest among the ex-regular smokers (men vs women:
Kurmi OP, Li L, Smith M, et al. BMJ Open Resp Res 2014;1:e000025. doi:10.1136/bmjresp-2014-000025
3
Open Access
Table 1 Baseline characteristics of participants by sex and region types (figures in the column are % of total)
Characteristics
Men
Rural (%)
N=118 837
Height (mean±SD in cm)
164.1±6.3
Age (years)
30–39
14.5
40–49
27.7
50–59
31.2
60–69
19.8
70–79
6.8
Mean (SE)
52.6 (0.03)
BMI (kg/m2)
<18.5
5.7
18.5 to <25
71.5
≥25
22.7
Mean (SE)
22.7 (0.01)
Smoking status
Never smoker
11.3
Occasional smoker
11.0
Ex-regular smoker
11.8
Current regular smoker
65.9
Pack years*
<10
19.7
10–20
23.1
>20
57.1
Mean (SE)
26.7 (0.07)
Age started smoking (years)
<20
34.7
20–24
38.0
25–29
12.5
≥30
14.8
Number of cigarettes smoked daily (or equivalent)
1–4
7.2
5–14
27.5
15–24
45.1
≥25
20.2
Reason for stopping among ex-smokers
Physical illness
53.2
Other reason
46.8
Exposure to passive smoking†
73.7
Highest education completed
No formal education
12.7
Primary school
43.8
Middle or high school
41.8
College or university
1.7
Household income (yuan/year)
2500–4999
14.3
5000–9999
23.5
10 000–19 999
28.9
≥20 000
33.3
Exposure to cooking fuels‡
Currently cooks with coal/wood
27.7
Ever cooked with coal/wood
32.7
Currently cooks with gas/electricity
7.1
Respiratory symptoms
Chronic cough and phlegm
7.3
Breathlessness
5.8
Urban (%)
N=91 220
Women
Rural (%)
N=167 727
Urban (%)
N=134 711
166.8±6.5
153.2±5.9
155.3±5.9
13.5
28.8
29.1
19.5
9.1
53.1 (0.04)
18.2
31.4
31.2
15.0
4.2
50.5 (0.02)
13.1
30.2
30.7
18.8
7.2
52.6 (0.03)
2.8
55.3
41.8
24.3 (0.01)
5.2
64.3
30.5
23.5 (0.01)
3.2
57.9
38.9
24.3 (0.01)
18.4
11.5
15.3
54.8
94.4
2.0
0.9
2.6
95.5
1.6
0.8
2.1
19.3
26.3
54.5
24.8 (0.07)
47.7
26.5
25.8
15.2 (0.2)
51.7
25.1
23.2
13.7 (0.22)
33.1
36.6
15.8
14.6
35.1
21.4
12.2
31.4
21.9
16.6
12.4
49.1
4.7
30.8
47.8
16.7
29.1
47.2
20.4
3.3
24.9
51.3
20.7
3.1
45.9
54.1
63.0
64.1
35.9
87.5
40.8
59.2
83.2
4.0
19.7
60.5
15.9
31.7
40.4
27.2
0.6
17.3
20.3
53.3
9.2
2.6
8.0
27.6
61.7
15.1
26.1
28.9
29.9
4.1
11.5
30.4
54.1
5.3
33.6
56.5
81.0
92.6
12.4
8.7
61.0
83.6
6.2
3.4
2.6
8.5
1.8
4.7
*Restricted to ever regular smokers.
†Defined as never smokers who lived with a smoker or were exposed at work for 1–5 days/week or daily.
‡Restricted to participants who reported cooking daily or weekly.
BMI, body mass index.
4
Kurmi OP, Li L, Smith M, et al. BMJ Open Resp Res 2014;1:e000025. doi:10.1136/bmjresp-2014-000025
Open Access
Table 2 Participant characteristics relating to AFO, by region and sex (figures are in percentage of total unless stated)
Men
Rural
Total
118 837
Mean age (years)
52.6
AFO GOLD stage I–IV
8.4
AFO GOLD stage II–IV
7.0
AFO LLN
9.2
Classification of severity of AFO (values are % predicted)*
Mild (FEV1 ≥80%)
1.4
Moderate (50% ≤ FEV1 ≥80%)
4.2
Severe (50% ≤ FEV1 ≥80%)
2.2
Very severe (FEV1 <80%)
0.7
Doctor diagnosed CB/E
3.2
Doctor diagnosed CB/E and still on treatment
34.8
Doctor diagnosed CB/E and
AFO GOLD stage I–IV†
40.5
AFO GOLD stage II–IV†
39.6
AFO LLN†
39.5
Under diagnosis
86.1
Over diagnosis
60.5
Doctor diagnosed asthma
0.4
Breathlessness
5.8
Chronic coughĐ
6.8
Chronic cough and sputumả
7.3
Chronic cough with sputum and
AFO GOLD stage I–IV**
17.3
AFO GOLD stage II–IV**
15.8
AFO LLN**
18.9
Urban
Overall
Women
Rural
Urban
Overall
91 220
53.1
4.5
3.6
4.8
210 057
52.9
6.7
5.5
7.3
167 727
50.5
5.5
4.6
7.7
134 711
52.6
3.3
2.4
4.8
302 438
51.5
4.4
3.5
6.3
0.9
2.4
1.0
0.3
2.9
28.4
1.2
3.4
1.6
0.5
3.1
32.1
0.9
2.9
1.4
0.3
2.1
37.8
0.9
1.7
0.6
0.1
2.4
27.4
1.4
4.2
2.2
0.7
2.2
32.7
22.8
21.7
22.0
86.6
78.0
0.8
3.4
4.5
6.2
33.1
32.2
32.3
86.2
67.7
0.6
4.7
5.8
6.8
31.5
30.4
35.6
90.3
64.4
0.3
8.5
3.0
2.6
14.3
12.9
16.7
91.5
83.3
0.8
4.7
1.8
1.8
23.0
21.7
26.3
90.7
73.7
0.5
6.8
2.4
2.2
9.8
8.6
10.1
14.4
13.1
15.5
17.5
15.8
20.8
8.4
7.2
10.0
14.1
12.7
16.9
p Value for difference between urban and rural <0.0001 except men: doctor-diagnosed CB/E (p=0.0002); underdiagnosis (p=0.3775) women:
underdiagnosis (p=0.0032).
*Based on prebronchodilator FEV1 in participants with FEV1/FVC <0.70 according to modified GOLD definition.
†Figures are percentage of different GOLD stages of AFO or LLN based AFO in those with doctor diagnosed CB/E.
‡Becomes short of breath while walking on level ground with healthy people of same age.
§Had cough for at least 3 months in the past 12 months.
¶Cough up sputum in the morning for at least 3 months in the past 12 months.
**Figures are percentage of different GOLD stages of AFO or LLN based AFO in those with chronic cough and sputum.
AFO, air flow obstruction; CB/E, chronic bronchitis/emphysema; FEV1, forced expiratory volume in 1 s; GOLD, Global Initiative for Obstructive
Lung Disease; LLN, lower limit of normal.
Figure 1 Prevalence of air flow
obstruction (age-adjusted) by sex
and region.
Kurmi OP, Li L, Smith M, et al. BMJ Open Resp Res 2014;1:e000025. doi:10.1136/bmjresp-2014-000025
5
Open Access
Table 3 Age and region standardised prevalence of AFO based on LLN definition, by patient characteristics
Characteristics
Men
Rural
N
Per cent
Overall
118 837
9.2
Age group (%)
30–39
17 204
6.2
40–49
32 932
6.3
50–59
37 100
8.7
60–69
23 544
12.9
70–79
8057
16.8
p for trend
<0.0001
BMI group (%)
<18.5
6821
18.0
18.5–24
85 013
9.5
≥25
27 002
5.9
p for trend
<0.0001
Smoking category (%)
Never
13 486
7.8
Occasional
13 123
7.6
Ex-regular
13 980
9.7
Current regular
78 248
9.5
Ever regular
92 228
9.6
p for heterogeneity
<0.0001
Pack years*
<10
18 211
8.4
10–19
21 324
8.8
>20
52 693
10.4
p for trend
<0.0001
Age started smoking (years)
<20
32 031
10.5
20–24
35 021
9.7
25–29
11 572
9.1
≥30
13 604
8.3
p for trend
<0.0001
Number of cigarettes smoked daily (or equivalent)
1–4
6605
9.3
5–14
25 376
9.2
15–24
41 631
9.8
≥25
18 616
10.1
p for trend
0.0019
Reason for stopping among ex-smokers
Physical illness
7442
13.2
Other reason
6538
8.8
p for heterogeneity
<0.0001
Passive smoking†
No
3546
9.4
Yes
9940
7.4
p for heterogeneity
0.0001
Highest education completed
No formal education
15 043
12.0
Primary school
52 103
10.0
Middle/high school
49 621
7.6
College/university
2070
7.1
p for trend
<0.0001
Household income (¥)
2500–4999
17 022
12.9
5000–9999
27 939
10.9
10 000–19 999
34 326
9.2
≥20 000
39 550
6.7
p for trend
<0.0001
Urban
N
Per cent
Women
Rural
N
Per cent
Urban
N
Per cent
91 220
4.8
167 727
7.7
134 711
4.8
12 361
26 230
26 571
17 766
8292
<0.0001
2.8
3.3
4.6
6.9
9.6
30 478
52 743
52 371
25 137
6998
<0.0001
6.9
5.6
7.1
10.4
15.3
17 695
40 707
41 400
25 269
9640
<0.0001
4.7
4.1
4.3
5.9
7.8
2599
50 482
38 139
<0.0001
10.8
5.5
3.4
8680
107 832
51 214
<0.0001
12.7
7.8
6.0
4259
78 023
52 429
<0.0001
7.7
5.3
3.9
16 796
10 487
13 913
50 024
63 937
<0.0001
3.5
3.3
5.4
5.3
5.4
158 401
3389
1561
4376
5937
<0.0001
7.3
7.8
7.8
9.8
9.7
128 716
2133
1083
2779
3862
<0.0001
4.8
4.2
6.2
5.8
5.7
12 322
16 786
34 829
<0.0001
4.2
4.9
6.0
2831
1574
1532
0.2402
10.0
11.0
13.8
1998
968
896
0.1224
5.7
5.1
9.0
21 159
23 375
10 097
9306
<0.0001
6.6
5.3
5.0
4.5
2083
1268
724
1862
<0.0001
13.6
14.0
8.9
9.9
846
643
477
1896
<0.0001
10.1
5.4
5.2
5.2
2992
19 681
30 558
10 706
0.0227
4.6
5.2
5.5
5.8
1726
2805
1212
194
0.3553
9.6
11.3
12.1
8.9
961
1982
801
118
0.1128
5.5
5.2
6.8
5.5
6386
7527
<0.0001
8.7
4.4
1001
560
<0.0001
31.8
21.9
442
641
0.0918
6.7
4.5
6211
10 585
0.1538
4.1
3.3
19 783
138 618
<0.0001
9.0
7.1
21 643
107 073
0.3864
4.8
4.7
3606
17 983
55 167
14 464
<0.0001
8.3
5.8
4.2
4.3
53 238
67 726
45 690
1073
<0.0001
9.9
7.4
6.3
5.7
23 254
27 309
71 772
12 376
<0.0001
5.5
4.8
4.4
3.9
2413
7319
25 184
56 304
<0.0001
8.4
6.2
5.4
4.3
25 256
43 775
48 506
50 190
<0.0001
10.5
8.5
7.2
6.1
5461
15 521
40 887
72 842
<0.0001
5.7
5.4
5.2
4.4
Continued
6
Kurmi OP, Li L, Smith M, et al. BMJ Open Resp Res 2014;1:e000025. doi:10.1136/bmjresp-2014-000025
Open Access
Table 3 Continued
Characteristics
Men
Rural
N
Currently cooks with coal/wood
No
85 965
Yes
32 872
p for heterogeneity
<0.0001
Ever cooked with coal/wood
No
80 005
Yes
38 832
p for heterogeneity
<0.0001
Per cent
Urban
N
Per cent
Women
Rural
N
Per cent
Urban
N
Per cent
8.7
10.1
86 428
4792
<0.0001
4.7
6.5
31 872
135 855
<0.0001
7.5
7.6
122 950
11 761
0.7517
4.8
5.5
8.6
10.0
60 591
30 629
0.0014
4.6
5.2
12 381
155 346
<0.0001
7.8
7.6
52 523
82 188
0.0160
4.6
5.0
*Restricted to ever regular smokers.
†Among never smokers, exposed to others’ tobacco smoke regularly at home or work.
BMI, body mass index.
29.5% vs 25.1%), men aged 70–79 years (37.5%) and
women aged 30–39 years (28.7%; see online supplementary table S5).
DISCUSSION
This is by far the largest population-based study in
China of the prevalence and socioeconomic and lifestyle
correlates of AFO in adult Chinese men and women.
It involved 10 geographically and socioeconomically
diverse regions and showed that there is a wide heterogeneity in the prevalence of AFO by region, age, socioeconomic and lifestyle factors such as smoking and BMI.
Overall, self-reported prior diagnosis of CB/E was found
to be poorly correlated with AFO based on the measured lung function and less than one-third of those
Figure 2 Prevalence of air flow
obstruction (region-adjusted) by
age group.
Kurmi OP, Li L, Smith M, et al. BMJ Open Resp Res 2014;1:e000025. doi:10.1136/bmjresp-2014-000025
7
Open Access
Table 4 Age and region-adjusted prevalence, stratified by various baseline variables
Characteristics
Men (prevalence (%), unless otherwise
stated)
N
CB/E AFO UD
OD
CB/ET
All
210 057
Sampling regions
Rural
118 837
Urban
91 220
Monthly household income (¥)
2500–4999
19 435
5000–9999
35 258
10 000–19 999
59 510
≥20 000
95 854
Highest education completed
No formal education
18 649
Primary school
70 086
Middle/high school
104 788
College/university
16 534
Smoking status
Never
30 282
Occasional
23 610
Ex-regular
27 893
Current regular
128 272
Body mass index (kg/m2)
<18.5
9420
18.5 to <25
135 495
≥25
65 141
Age group (years)
30–39
29 565
40–49
59 162
50–59
63 671
60–69
41 310
70–79
16 349
Respiratory symptoms
None
188 303
Cough or breathlessness
19 287
Cough and breathlessness
2467
Women (prevalence (%) unless otherwise
stated)
N
CB/E AFO UD
OD
CB/ET
3.1
7.3
86.2
67.7
32.1
302 438
2.2
6.3
90.7
73.7
32.7
3.2
2.9
9.2
4.8
86.1
86.6
60.5
78.0
34.8
28.4
167 727
134 711
2.1
2.4
7.7
4.8
90.3
91.5
64.4
83.3
37.8
27.4
4.1
3.5
3.0
3.0
10.9
8.9
7.5
5.6
81.2
85.9
86.7
84.5
48.0
61.8
67.4
71.3
36.1
33.3
31.9
29.4
30 717
59 296
89 393
123 032
2.8
2.3
2.2
2.3
8.4
7.1
6.3
5.3
85.3
90.7
90.9
89.3
62.9
73.5
73.9
78.1
35.8
36.1
33.2
29.0
3.1
3.2
2.8
3.7
10.4
8.1
6.1
5.9
85.5
84.4
86.9
79.8
54.4
62.6
70.9
69.5
32.1
34.5
28.7
21.3
76 492
95 035
117 462
13 449
2.4
2.2
2.3
2.9
7.9
6.2
5.4
4.9
87.5
89.7
91.8
71.2
62.9
72.3
78.2
60.3
35.1
31.2
29.1
7.5
3.3
3.1
5.6
2.5
5.9
5.7
7.8
7.7
83.8
88.1
73.9
89.6
70.3
75.4
61.7
67.7
32.2
27.6
38.6
27.7
287 117
5522
2644
7155
2.1
2.7
6.1
2.3
5.9
10.2
14.7
12.9
91.2
90.1
77.7
92.9
76.2
59.6
40.1
59.5
31.6
39.5
43.4
30.7
6.0
2.9
3.0
14.9
7.8
4.8
77.5
87.1
86.4
45.8
66.4
78.3
39.2
31.7
28.6
12 939
185 855
103 643
4.4
2.1
2.2
10.5
6.7
5.1
83.4
91.2
92.0
59.9
72.1
80.8
36.4
32.7
31.7
1.1
1.4
2.7
5.6
7.5
4.7
5.0
6.9
10.3
13.7
96.0
93.9
88.6
79.8
78.3
81.8
78.9
71.9
63.5
59.1
19.7
21.0
28.9
35.2
41.1
48 173
93 450
93 771
50 406
16 638
1.0
1.4
2.4
3.8
4.7
5.9
4.9
5.9
8.4
12.0
96.8
94.8
90.0
85.5
86.0
80.5
81.0
75.8
68.8
65.4
22.7
25.0
32.2
37.4
40.7
2.1
10.1
26.1
6.3
13.1
27.6
92.1
72.5
54.6
74.6
59.6
50.7
24.6
38.2
54.4
277 510
22 717
2211
1.5
8.5
26.1
5.8
11.0
20.5
94.6
77.4
53.7
77.4
69.2
59.5
27.1
38.5
52.6
AFO, air flow obstruction; CB/E, chronic bronchitis and/or emphysema; CB/ET, participants currently under treatment for CB/E; OD,
overdiagnosis; UD, underdiagnosis.
with physician diagnosis were receiving treatment at the
time of the survey. The estimated underdiagnosis and
overdiagnosis proportions were high in rural and urban
areas.
Several studies from China have estimated COPD
prevalence in adult populations, but the results have not
been consistent, with the reported prevalence between
3% and 12%.5–7 In our study, the overall weighted prevalence of AFO based on GOLD 1+ definition for ages 40–
79 was 6% (ranging from 2% in Harbin to 14% in
Sichuan), much lower than that reported by Buist et al7
for China (11.4%) and many other countries such as the
USA (19.6%), Australia (19.2%), Turkey (10.1%),
Austria (26.1%), Iceland (17.8%) and Poland (22.1%).
Although the study by Buist et al7 measured postbronchodilator lung function, the sample sizes were much
smaller (473–893 in each country) than ours (>0.5
million) and the majority of them were from one region
or city in each of the countries and thus, could not be
8
nationally representative, particularly in a country with
large heterogeneity such as China. Despite this, the
large difference in the prevalence of AFO between CKB
population and previous studies of Western and Chinese
populations is likely to be largely real, for the CKB participants were much younger, with only 6.4% aged
≥70 years compared with 10–25% participants in other
studies.5 The huge variation in the reported prevalence
from different countries and even in different or same
regions of a country could be accounted for by several
factors, including data acquisition methods, quality
control of spirometry measurements, types of sampling
population (such as exposure to environmental pollutants, age, previous history of diseases, smoking history
and family history, dietary patterns and physical activity)
as well as the diagnostic criteria used (eg, GOLD, ERS/
ATS criteria used to define COPD).13 14
Our study confirms the previous observations5 of large
heterogeneity in the prevalence of AFO across different
Kurmi OP, Li L, Smith M, et al. BMJ Open Resp Res 2014;1:e000025. doi:10.1136/bmjresp-2014-000025
Open Access
Figure 3 Prevalence of air flow obstruction (age-adjusted) by (A) lower limit of normal of forced expiratory ratio versus
self-reported doctor diagnosis and (B) self-reported doctor diagnosis with/without current treatment.
regions of China, with very high prevalence in the
Sichuan region for men and women. We did not
compare the nutrient intake and physical activities
across different regions in this paper, but hypothesise
that it is highly unlikely that lifestyle factors could
completely explain the substantial heterogeneity
observed across different regions. Most of the rural participants were farmers and there were no major differences in the dietary patterns or smoking habit across
different regions. Sichuan, 1 of the 10 regions with the
Figure 4 Prevalence of age-adjusted (A) chronic cough and phlegm with air flow obstruction (lower limit of normal, LLN), and
(B) breathlessness with airflow obstruction (LLN).
Kurmi OP, Li L, Smith M, et al. BMJ Open Resp Res 2014;1:e000025. doi:10.1136/bmjresp-2014-000025
9
Open Access
highest prevalence of AFO, was included because of
higher mortality rate from COPD reported in our previous studies.15 The study area in Sichuan is situated in a
valley and environmental conditions such as temperature inversion could play a role in the prevalence of
AFO as it is related to pollution levels. Currently, data on
genetic biomarkers for a number of health outcomes,
including respiratory health, is being studied in this
population that could possibly explain some of the variations in the prevalence of AFO in different regions. The
prevalence of asthma in our sampling population was
low and similar to previous findings16; lower diagnosed
asthma prevalence in China could be due to poor diagnostic facilities making it difficult to differentiate
between obstructive lung diseases.
As in previous studies,5 we found that men had higher
prevalence of AFO than women, probably due to high
smoking prevalence in Chinese men. The higher prevalence observed among rural women could be due to
greater exposure to environmental pollutants including
household air pollution while cooking food using solid
fuel, low socioeconomic status or lung infections early in
life.
In the present study we reported AFO results based on
fixed forced expiratory ratio and LLN of forced expiratory ratio so that comparison with previous studies with
different diagnostic criteria could be made. The AFO
prevalence based on LLN criteria using GLI reference
equations was higher than the forced expiratory ratio criteria. This could be due to higher cut-off values for
forced expiratory ratio in the Chinese population with
age under 60. Previous papers have reported higher falsepositive in the elderly population when using the fixed
ratio criteria as it lacks specificity, but using the GLI reference equations to some extent overcomes the problem,
although it needs to be validated independently.17 18
The extent of underdiagnosis and overdiagnosis of
AFO in the present study population is much greater
than that reported previously in western countries.19–24
The spirometry-based prevalence of AFO is much
greater than self-reported prior physician-diagnosed
CB/E. In China, the majority of COPD diagnoses are
based on clinical examination and measurement of lung
function is not common, particularly, in rural health
clinics.25 Our study showed that younger participants,
particularly those who are asymptomatic and current
smokers and have middle-household income, are relatively more likely to be underdiagnosed. When subgrouped for severity of AFO based on the percent
predicted FEV1, the majority of participants had either
moderate or severe AFO suggesting that underdiagnosis
might be more likely. Validation of this finding would be
important as these participants are at a higher risk of
developing COPD and early preventive action such as
smoking cessation in these groups would be expected to
gain the most long-term benefit.
Those with a smoking history and presence of respiratory symptoms were more likely to be overdiagnosed for
10
AFO. Similar findings have also been reported in other
studies. A recent study in the USA26 found that 42.5% of
those diagnosed with COPD were false positive with no
airway obstruction, with most of the false-positive diagnosis seen among smokers with presence of respiratory
symptoms. New GOLD guidelines recommend that spirometry should be one of the essential criteria for the
clinical diagnosis and management of COPD27 28 among
those reporting chronic productive cough or sputum
production, dyspnoea and exposure to risk factors.
Although spirometry is more reproducible and has
greater sensitivity and specificity compared with peak
expiratory flow, its use is not that frequent in many lowincome and middle-income countries, particularly in
rural areas.29 The relatively low prevalence of selfreported CB/E in our study could be due to lack of
awareness of the problem in the participants and also
lack of adequate health facilities in proximity where the
participants dwell. Further, recall bias could also not be
excluded as a cause of the observed low proportion of
diagnosed participants with AFO.
In spite of a large sample size and wide geographical
locations covered, our study has some limitations. First,
we did not administer a bronchodilator as part of the
spirometry procedure, and hence no postbronchodilator
lung function measurement was carried out.
Postbronchodilator forced expiratory ratio lower than
LLN or 0.70 is suggested to confirm persistent air flow
limitation and thus the presence of COPD in the latest
ERS/ATS and GOLD guidelines.28 30 This means the
AFO observed in our study could be either COPD or
asthma related, therefore the prevalence may be somewhat overestimated. Although postbronchodilator is
often used to identify patients with COPD and the
course of treatment, its use to differentiate from asthma
could be influenced by the day of testing, the baseline
lung function before the delivery of testing and also the
number of drugs given to test.31 Second, the instrument
we used at baseline did not give us the spirogram and
thus incomplete exhalation could not be ruled out completely although every effort was made to explain to the
participants to blow out as long as possible. A reduction
in FVC due to incomplete exhalation could lead to
underestimation of AFO and also could be the reason
for higher prevalence of restrictive lung disease observed
in our population where we used a modified definition,
considering that we did not collect total lung capacity
data that is usually required to define the restrictive lung
disease. Third, we did not collect exacerbation history
data at baseline and used GLI predictive equations12
based on the latest predictive equations for north China
and southeast Asia where bias due to internal migration
from south to the north cannot be completely excluded.
Although most of the participants in our study were Han
Chinese, some degree of misclassification of grade of
AFO as classified by GOLD criteria may have occurred.
In summary, this extremely large study provides good
evidence about the burden of AFO in adult Chinese
Kurmi OP, Li L, Smith M, et al. BMJ Open Resp Res 2014;1:e000025. doi:10.1136/bmjresp-2014-000025
Open Access
men and women. Owing to the lack of use of spirometry
for diagnosing AFO in routine clinical practice, a high
proportion of such patients were not identified previously. Even among those with prior diagnosis of COPD,
two-thirds lacked long-term treatment. Although a
number of socioeconomic and lifestyle factors were associated with poor detection and treatment, a large proportion of regional variation remained unexplained.
These findings highlight major respiratory health problems in China that need immediate attention to carry
out appropriate interventions for optimal disease management as well as to develop the prevention strategies
to be implemented in order to improve the current and
future respiratory health in the Chinese population.
Author affiliations
1
Nuffield Department of Population, University of Oxford, Oxford, UK
2
School of Public Health, Peking University Health Science Center, Beijing,
People’s Republic of China
3
Chinese Academy of Medical Sciences, Dong Cheng District, Beijing,
People’s Republic of China
4
China National Center for Food Safety Risk Assessment, Beijing, People’s
Republic of China
5
Tongxiang Center for Disease Control, Tongxiang, Zhejiang, People’s
Republic of China
6
Liuzhou Center for Disease Control, Liuzhou, Guangxi, People’s Republic of
China
7
Suzhou Center for Disease Control, Suzhou, Jiangsu, People’s Republic of
China
8
Pengzhou Center for Disease Control, Pengzhou, Sichuan, People’s Republic
of China
9
Henan Center for Disease Control, Zhengzhou, Henan, People’s Republic of
China
10
Worldwide Epidemiology, GlaxoSmithKline R&D, Uxbridge, UK
Acknowledgements The authors would like to thank Judith Mackay in Hong
Kong; Yu Wang, Gonghuan Yang, Zhengfu Qiang, Lin Feng, Maigen Zhou,
Wenhua Zhao and Yan Zhang in China Centres for Disease Control and
Prevention (CDC); Lingzhi Kong, Xiucheng Yu and Kun Li in the Chinese
Ministry of Health and Yiping Chen, Sarah Clark, Martin Radley, Mike Hill,
Hongchao Pan and Jill Boreham in the CTSU, Oxford, for assisting with the
design, planning, organisation and conduct of the study. The most important
acknowledgement is to the participants in the study and the members of the
survey teams in each of the 10 regional centres, as well as to the project
development and management teams based at Beijing, Oxford and the 10
regional centres. ZC and RC acknowledge support from the BHF Centre of
Research Excellence, Oxford.
Collaborators Members of China Kadoorie Biobank collaborative group, (A)
International Steering Committee. Liming Li, Zhengming Chen, Junshi Chen,
Rory Collins, Richard Peto. (B) Study Coordinating Centres, International
Co-ordinating Centre, Oxford: Zhengming Chen, Garry Lancaster, Xiaoming
Yang, Alex Williams, Margaret Smith, Ling Yang, Yumei Chang, Iona
Millwood, Yiping Chen, Sarah Lewington, Sam Sansome, Robin Walters, Om
Kurmi, National Co-ordinating Centre, Beijing: Yu Guo, Zheng Bian, Can Hou,
Yunlong Tan, Zheng Wang, Xin Cai, Huiyan Zhou, Xuguan Chen, Regional
Co-ordinating Centres, 10 areas in China: Qingdao Qingdao Centre for Disease
Control: Zengchang Pang, Shanpeng Li, Shaojie Wang. Licang Centre for
Disease Control: Silu lv. Heilongjiang Provincial Centre for Disease Control:
Zhonghou Zhao, Shumei Liu, Zhigang Pang. Nangang Centre for Disease
Control: Liqiu Yang, Hui He, Bo Yu. Hainan Provincial Centre for Disease
Control: Shanqing Wang, Hongmei Wang. Meilan Centre for Disease Control:
Chunxing Chen, Xiangyang Zheng. Jiangsu Provincial Centre for Disease
Control: Xiaoshu Hu, Minghao Zhou, Ming Wu, Ran Tao. Suzhou Centre for
Disease Control: Yeyuan Wang, Yihe Hu, Liangcai Ma. Wuzhong Centre for
Disease Control: Renxian Zhou. Guangxi Provincial Centre for Disease Control:
Zhenzhu Tang, Naying Chen, Ying Huang. Liuzhou Centre for Disease Control:
Mingqiang Li, Zhigao Gan, Jinhuai Meng, Jingxin Qin. Sichuan Provincial
Centre for Disease Control: Xianping Wu, Ningmei Zhang. Pengzhou Centre
for Disease Control: Guojin Luo, Xiangsan Que, Xiaofang Chen. Gansu
Provincial Centre for Disease Control: Pengfei Ge, Xiaolan Ren, Caixia Dong.
Maiji Centre for Disease Control: Hui Zhang, Enke Mao, Zhongxiao Li. Henan
Provincial Centre for Disease Control: Gang Zhou, Shixian Feng. Huixian
Centre for Disease Control: Yulian Gao,Tianyou He, Li Jiang, Huarong Sun.
Zhejiang Provincial Centre for Disease Control: Min Yu, Danting Su, Feng Lu.
Tongxiang Centre for Disease Control: Yijian Qian, Kunxiang Shi, Yabin Han,
Lingli Chen. Hunan Provincial Centre for Disease Control: Guangchun Li,
Huilin Liu, LI Yin. Liuyang Centre for Disease Control: Youping Xiong,
Zhongwen Tan, Weifang Jia.
Contributors ZC, LL, RP and RC were involved in the concept, design of the
study and reviewing the manuscript. OK was involved in the analysis plan,
preparing the first draft and editing of the manuscript. MS and MA were
involved in the analysis plan, analysis of the data and reviewing the
manuscript. JC, YG, YH, JQ, GX, JW, ZB and GZ were involved in the
supervision of the data collection, data monitoring and reviewing the
manuscript. KD was involved in the analysis plan and reviewing the
manuscript. ZC is the PI and also was responsible for overall supervision of
the project.
Funding The baseline survey and first resurvey in China were supported by a
research grant from the Kadoorie Charitable Foundation in Hong Kong;
follow-up of the project during 2009–2014 is supported by the Wellcome
Trust in the UK (grant 088158/Z/09/Z), and the National Key Technology
Research and Development Program in the 12th Five-Year Plan, Ministry of
Science and Technology, China; the Clinical Trial Service Unit and
Epidemiological Studies Unit (CTSU) at Oxford University also receives core
funding for it from the UK Medical Research Council, the British Heart
Foundation, and Cancer Research UK. Support for the present respiratory
study was provided by GlaxoSmithKline (WEUKBRE5848).
Competing interests KD is employed by GlaxoSmithKline.
Ethics approval Central ethics approvals were obtained from Oxford
University, the China National Centres for Disease Control and Prevention
(CDC) and local ethics approvals from institutional research boards at the
local CDCs in the 10 regions
Provenance and peer review Not commissioned; externally peer reviewed.
Data sharing statement No additional data are available.
Open Access This is an Open Access article distributed in accordance with
the Creative Commons Attribution Non Commercial (CC BY-NC 3.0) license,
which permits others to distribute, remix, adapt, build upon this work noncommercially, and license their derivative works on different terms, provided
the original work is properly cited and the use is non-commercial. See: http://
creativecommons.org/licenses/by-nc/3.0/
REFERENCES
1.
2.
3.
4.
5.
6.
World Health Organisation. The global burden of disease: update
2004. Geneva: World Health Organisation, 2008. />healthinfo/global_burden_disease/GBD_report_2004update_full.pdf
(accessed 29 Jan 2013).
Mathers CD, Loncar D. Projections of global mortality and burden of
disease from 2002 to 2030. PLoS Med 2006;3:e442.
World Health Organisation. Disease and injury country estimates,
2008. Global health observatory data repository. World Health
Organisation. />(accessed 27 Jan 2014).
World Health Organisation. Death and DALY estimates for 2004 by
cause for countries: global health observatory data repository. World
Health Organisation. />(accessed 27 Jan 2014).
Zhong N, Wang C, Yao W, et al. Prevalence of chronic obstructive
pulmonary disease in China: a large, population-based survey. Am J
Respir Crit Care Med 2007;176:753–60.
Xu F, Yin X, Zhang M, et al. Prevalence of physician-diagnosed
COPD and its association with smoking among urban and rural
residents in regional mainland China. Chest 2005;128:2818–23.
Kurmi OP, Li L, Smith M, et al. BMJ Open Resp Res 2014;1:e000025. doi:10.1136/bmjresp-2014-000025
11
Open Access
7.
8.
9.
10.
11.
12.
13.
14.
15.
16.
17.
18.
19.
20.
12
Buist AS, McBurnie MA, Vollmer WM, et al. International variation in
the prevalence of COPD (the BOLD Study): a population-based
prevalence study. Lancet 2007;370:741–50.
Chen Z, Chen J, Collins R, et al. China Kadoorie Biobank of 0.5
million people: survey methods, baseline characteristics and
long-term follow-up. Int J Epidemiol 2011;40:1652–66.
Fang X, Wang X, Bai C. COPD in China: the burden and importance
of proper management. Chest 2011;139:920–9.
Chen Z, Lee L, Chen J, et al. Cohort profile: the Kadoorie Study of
Chronic Disease in China (KSCDC). Int J Epidemiol 2005;34:1243–9.
American Thoracic Society. Standardization of spirometry, 1994
update. Am J Respir Crit Care Med 1995;152:1107–36.
Quanjer PH, Stanojevic S, Cole TJ, et al. Multi-ethnic reference
values for spirometry for the 3–95-yr age range: the global lung
function 2012 equations. Eur Respir J 2012;40:1324–43.
Miller MR, Quanjer PH, Swanney MP, et al. Interpreting lung function
data using 80% predicted and fixed thresholds misclassifies more
than 20% of patients. Chest 2011;139:52–9.
Miller MR, Crapo R, Hankinson J, et al. General considerations for
lung function testing. Eur Respir J 2005;26:153–61.
Liang BM, Xu ZB, Yi Q, et al. Association of chronic obstructive
pulmonary disease with coronary artery disease. Chin Med J
2013;126:3205–8.
Chan-Yeung M, Zhan LX, Tu DH, et al. The prevalence of asthma
and asthma-like symptoms among adults in rural Beijing, China. Eur
Respir J 2002;19:853–8.
Pellegrino R, Viegi G, Brusasco V, et al. Interpretative strategies for
lung function tests. Eur Respir J 2005;26:948–68.
Vollmer WM, Gislason T, Burney P, et al. Comparison of spirometry
criteria for the diagnosis of COPD: results from the BOLD study. Eur
Respir J 2009;34:588–97.
Halbert RJ, Natoli JL, Gano A, et al. Global burden of COPD:
systematic review and meta-analysis. Eur Respir J 2006;
28:523–32.
Mannino DM, Buist AS. Global burden of COPD: risk factors,
prevalence, and future trends. Lancet 2007;370:765–73.
21.
22.
23.
24.
25.
26.
27.
28.
29.
30.
31.
Buist AS, Vollmer WM, McBurnie MA. Worldwide burden of COPD in
high- and low-income countries. Part I. The burden of obstructive
lung disease (BOLD) initiative. Int J Tuberc Lung Dis
2008;12:703–8.
Walters JA, Walters EH, Nelson M, et al. Factors associated with
misdiagnosis of COPD in primary care. Prim Care Respir J
2011;20:396–402.
Shahab L, Jarvis MJ, Britton J, et al. Prevalence, diagnosis and
relation to tobacco dependence of chronic obstructive pulmonary
disease in a nationally representative population sample. Thorax
2006;61:1043–7.
Miravitlles M, Soriano JB, Garcia-Rio F, et al. Prevalence of COPD
in Spain: impact of undiagnosed COPD on quality of life and daily
life activities. Thorax 2009;64:863–8.
Lu M, Yao WZ, Zhong NS, et al. Asymptomatic patients of chronic
obstructive pulmonary disease in China. Chin Med J (Engl)
2010;123:1494–9.
Christian G, Allen D, Magdi HA. Misdiagnosis and mistreatment of
chronic obstructive pulmonary disease in an underserved patient
population. D32 chronic obstructive pulmonary disease: worldwide
epidemiology. American Thoracic Society, 2013:A5506-A.
Vestbo J, Hurd SS, Rodriguez-Roisin R. The 2011 revision of the
global strategy for the diagnosis, management and prevention of
COPD (GOLD)—why and what? Clin Respir J 2012;6:208–14.
Vestbo J, Hurd SS, Agusti AG, et al. Global strategy for the
diagnosis, management, and prevention of chronic obstructive
pulmonary disease: GOLD executive summary. Am J Respir Crit
Care Med 2013;187:347–65.
Gershon AS, Victor JC, Guan J, et al. Pulmonary function testing in
the diagnosis of asthma: a population study. Chest
2012;141:1190–6.
Wanger J, Clausen JL, Coates A, et al. Standardisation of the
measurement of lung volumes. Eur Respir J 2005;26:511–22.
Calverley PMA, Albert P, Walker PP. Bronchodilator reversibility in
chronic obstructive pulmonary disease: use and limitations. Lancet
Respir Med 2013;1:564–3.
Kurmi OP, Li L, Smith M, et al. BMJ Open Resp Res 2014;1:e000025. doi:10.1136/bmjresp-2014-000025