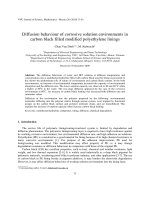
Báo cáo " Quantitative distribution of groundwater chemical components in the Red River Delta based on frequency analysis " pot
Bạn đang xem bản rút gọn của tài liệu. Xem và tải ngay bản đầy đủ của tài liệu tại đây (308.25 KB, 9 trang )
VNUJournalofScience,EarthSciences23(2007)194‐201
194
Quantitativedistributionofgr oundwater
chemicalcomponentsintheRedRiverDelta
basedonfrequencyanalysis
DangMai*,NguyenThanhLan
CollegeofScience,VNU
Received02July2007
Abstract. Quantitative distribution of main ions and other chemical components of groundwater
arecharacterizedbytheirsstatisticalparameters.Theydependcloselyonprobabilitydistributionof
the data. In this paper, by processing 760 analysis results of groundwater samples issued by
DepartmentofGeologyandMineralsofVietnam,
andbyusingfrequencyanalysistechniques,the
authors show that the distribution of bicarbonate and calcium ions in Pleistocene and Holocene
aquiferinthe RedRiverDelta (RRD) arein accordancewithnormal distribution,while otherions
are in accordance with skew distribution. In the first case, the value of
mean equals the value of
median,butinthesecondcase,thesetwovaluesshouldbe determinedatthepercentileof50%and
80% respectively. This research also indicated that Pleistocene and Holocene aquifers belong to
bicarbonate‐calciumtypewithtotal mineralizationinPleistoceneaquifersignificantlessthanthat
inHolocene
one.
Keywords:RedRiverDelta;Groundwater;Frequencyanalysis;Normaldistribution.
1.Introduction
*
Quantitative distribution laws of
groundwater chemical compositions reveal not
only geochemical kinds but also origin of
groundwater.Quantitativedistributionofmain
ions and other chemical components in
groundwater are characterized by theirs
statistical parameters with the most important
index being the expected values and the
standard deviations. The estimators of
these
two parameters depend on the probability
distribution ofcon tentof groundwa te rchemical
_______
*Correspondingauthor.Tel.:84‐912646638.
E‐mail:
components. Stat istically,onlyin case ofnormal
distribution, the expected value equals the
meanandiscalculatedas:
∑
=
n
i
x
n
X
1
1
, (1)
whilethestandarddeviationiscalculatedas:
()
∑
−
−
=
2
1
1
xxi
n
S
. (2)
In other cases, the above equations are not
suitable. Hence, it is necessary to consider
probabilitydistribution ofco ntentofgroundwater
chemicalcomponentsbeforesuitableprocedures
being applied [1, 3, 6, 7]. This consideration is
less paid attention in some previous
publications.
DangMai,NguyenThanhLan/VNUJournalofScience,EarthSciences23(2007)194‐201
195
Byusingfrequencyanalysistechniques,this
paper aims to investigate the probability
distribution of some main ions in groundwater
in RRD and to pr opose a comprehensive data
processing technique. Data used in this work
are originated from thousands of ana lyzed
resultsof RRDgroundwatersamples[2].There
are differentaquifers
inRRD, but inthis work,
only Holocene and Pleistocene ones‐the two
importantgroundwatertables‐arementioned.
2. Quantitative distribution of groundwater
chemicalcomponentsintheRedRiverDelta
Downward, Holocene aquifer is the first
groundwater table, which can be come out at
spring water or covered by youngersediments
composed mainly of clay, sandy clay and
muddy clay. Holocene aquifer has average
thickness of about 13.6 m, while the depth to
thetopandtothebottomofgroundwatertable
variesfrom5mto10mandfrom15mto20m
respectively[4].
Chemical compositions and
some
characteristics of water samples have been
mentioned in documents [2, 4, 5, 8]. Hereafter,
the frequency distributions in rainy and dry
seasons of main ions in groundwater will be
pointedout.
2.1. Frequency distribution in rainy season of
Holoceneaquifer
Bicarbonate(HCO
3
-
)ions
Among 394 analyzed samples, two water
samples do not have bicarbonate ion and one
sample has unexpected high content of
bicarbonate ion (13,020.78 mg/l). The HCO
3
-
concentration of remainders varies from 15.26
to2428.6mg/l.The rangeof 100‐700mg/lpla y s
themajorrole.Frequencypolygonofbicarbonate
ions possess a nearly symmetric form with
maximum point ranging from 200 to 300 mg/l
(Fig. 1). Probability distribution of bicarbonate
ions conform to normal
distribution model.
Therefore, average value of bicarbonate ions is
equivalenttomedian.Inthiscase,themeanand
median values are 430.25 mg/land 384.43 mg/l
respectively with the difference of 10.65%. The
standard deviation corresponding to percentile
of 85% equals to 305.10 mg/l, while the
standarddeviationcalculated
fromEquation(2)
is 347.42 mg/l. The difference between these
valuesis12.19%.
mg/l
Frequency (%)
0
4
8
12
16
20
0-10 20-30 40-50 60-70 80-90 100-200 300-400 500-600 700-800 900-1000 2000-2500
Fig.1.FrequencydistributionofHCO
3
-
ionsinrainy
seasonofHoloceneaquifer.
Sulfate(SO
4
2-
)ions
In comparison with chloride, the
concentration of sulfate ions fluctuated in a
narrow range from 15.26 mg/l to 3536.21 mg/l.
However, almost all of samples possess a
concentrationlessthan500mg/l,whilesamples
with concentration greater than 1000 mg/l
possessa smallfrequency(Table 1).
Hence,the
probability distribution of sulfate ionscontents
is in accordance with skew distribution with
significantdifference fromnormal distribution.
In this case, it is necessary to use the percentile
rule for calculating expected value and
standarddeviation.Using theanalysisfunction
of SPSSsoftwareor Microsoft Excel,media n of
distribution is calculated as 26.32 mg/l. This
value is considered as representative mean for
sulfateions.Thestandarddeviationcorresponding
to percentile of 85% is 165.08 mg/l, while the
average value of sulfate ions concentration and
the standard deviation calculated from
Equation (2) are 149.36 mg/l and 378.54
mg/l
respectively. It is clear that the values of mean
and standard deviation calculated in two ways
DangMai,NguyenThanhLan/VNUJournalofScience,EarthSciences23(2007)194‐201
196
haveabigdifference.
Table1.FrequencyofSO
4
2-
concentrationinrainy
seasonofHoloceneaquifer
Concentration
distance
Numberof
samples
Frequency
0‐1 66 16.79%
1‐10 3 0.76%
10‐20 69 17.56%
20‐30 45 11.45%
30‐40 20 5.09%
40‐50 24 6.11%
50‐60 18 4.58%
60‐70 17 4.33%
70‐80 10 2.54%
80‐90 7 1.78%
90‐100 5 1.27%
100‐200 8 2.04%
200‐300 44 11.20%
300‐400 9
2.29%
400‐500 10 2.54%
500‐600 5 1.27%
600‐700 5 1.27%
700‐800 6 1.53%
800‐900 1 0.25%
900‐1000 2 0.51%
1000‐1100 6 1.53%
1100‐1200 3 0.76%
1200‐1300 1 0.25%
1300‐1400 2 0.51%
1400‐1600 2 0.51%
1600‐1800 1 0.25%
1800‐
1900 1 0.25%
1900‐2500 1 0.25%
2500‐3400 1 0.25%
3400‐3600 1 0.25%
Chlorineions
Chlorineionsconcentrationvariesfrom0to
14,588.74 mg/l with average of 1,023.97 mg/l
andstandarddeviationof1023.97mg/l.Among
395 processed waters samples, 215 samples
(54.57%) possessaconcentration value ranging
from 4to 100 mg/l. Theconcentration intervals
of 100‐1000, 1000‐2000
up to 6000‐15000 have
low frequency that decreases gradually from
thesmalltobigconcentrationvalues(Fig.2).In
this case, probability distribution of chlorine
ions concentration also conforms a slanting
distribution.Therefore,thefactthattheaverage
value isconsideredas a representativemeanis
not logical. The
real values that represent for
quantitative distribution of chlorine ions are
77.99 mg/l and 2,295.95 mg/l corresponding to
thepercentileof50%(median)and85%.
0
10
20
30
40
50
60
4 -100 100-1000 1000-2000 2000-3000 3000-4000 4000 -5000 5000-6000 >6000mg/l
Frequency (%)
Fig.2.Frequencydistributionofchlorineions
inrainyseasonofHoloceneaquifer.
Calcium(Ca
2+
)ion
Calcium ion concentration varies from 7.8
to 434.13 mg/l in rainy season. According to
equations(1)and(2),theaverageconcentration
ofCa
2+
is93.17andthecorrespondingstandard
deviationis27.24.Frequencycharthas roughly
symmetrical character around the maximum
value corresponding to concentration interval
of50‐100mg/l(Fig.3).Sothat,thevaluesofmean
are compute d in the two above mentioned
ways are nearly equal. Indeed, the median of
calciumionconcentrationequals85.77mg/l.
mg/l
Frequency (%)
0
10
20
30
40
50
0-50 100-150 200-250 300-350 400-450
Fig.3.Frequencydistributionofcalciumions
inrainyseasonofHoloceneaquifer.
Magnesium(Mg
2+
)ions
In rainy season, Mg
2+
concentration in
Holocene aquifervariesfrom0.75to1501.76mg/l
with average value of 89.79 mg/l and standard
DangMai,NguyenThanhLan/VNUJournalofScience,EarthSciences23(2007)194‐201
197
deviationof163.25mg/l.However,approx imat e ly
70%of samplespossess concentrationless than
50 mg/l. The fact that frequency polygon of
Mg
2+
skews to the left (Fig. 4) shows that the
distribution of concentration is quite different
from normal distribution. In this case, the
quantitative distribution of magnesium ions
should be determined by percentiles of 50%
(median) and 85 % corresponding to values of
30.25mg/land130,03mg/lrespectively.
mg/l
Frequency (%)
0
10
20
30
40
50
60
70
0-50 100-150 200-250 300-350 400-450 500-550 600-650 700-750 800-850 900-950
Fig.4.Frequencydistributionofmagnesiumions
inrainyseasonofHoloceneaquifer.
Sodium(Na
+
)ions
In rainy season, Na
+
concentration varies
from0.46to8854.60mg/l.Accordingtoequations
(1)and(2),theaveragevalueofNa
+
concen tration
and corresponding standard deviation equal
624.30 mg/l and 1360.13 mg/l respectively.
HistogramofsodiumionsisdisplayedinFig.5.
In this histogram, the concentration value is
dividedintointervalsof100mg/lexceptthelast
intervalthathasthevaluefrom1000upto9000
mg/l.
Itisobviousthatthefrequencydistribution
of Na
+
skews to the left. The maximum
percentage of concentration corresponds to the
interval of 0‐100 mg/l that takes approximately
60% while the other intervals have small
probabilities. Such distribution shows that
sodium concentration distribution is quite
different from normal distribution. Hence, the
medianandthepercentileof85%should
replace
the mean and the standard deviation that is
calculatedaccordingtoEquation(2).Inthiscase,
themedianandstandarddeviationequal63mg/l
and 1337 mg/l respectively. It is obvious that
thosevaluesarequitedifferentfromthevalues
computedbyconventionalmethod.
mg/l
Frequency (%)
70
60
50
40
30
20
10
0
0-100 200-300 400-500 600-700 800-900 1000-9000
Fig.5.FrequencydistributionofNa
+
ionsinrainy
seasonofHoloceneaquifer.
2.2.FrequencydistributionindryseasonofHolocene
aquifer
Bicarbonate(HCO
3
-
)ions
In dry season, bicarbonate ions
concentration of Holocene aquifer varies from
3.05 to 2080 mg/l. Among the treated samples,
onlysomehaveaconcentrationhigherthan1000
mg/l. The samples, that possess concentration
from 400 to 500 mg/l, have the maximum
percentage; while the samples with
concentrationintervalsof100‐200;200‐300;300‐
400; 500‐600, have a smaller percentage.
Accordingly,frequency polygon of bicarbonate
ionshasthesub‐asymmetricformaroundvalue
of 400‐500 (Fig. 6). In this case, probability
distributionof bicarbonateions reachesnormal
distribution. Hence, the average value is not
significantlydifferentfromthemedianwiththe
valuesof475.43and424.94mg/lrespectively.
mg/l
Frequency (%)
0-100 200-300 400-500 600-700 800-900 1000-1100 1200-1300 1400-1500
0
20
16
12
8
4
Fig.6.Frequencydistributionofbicarbonate(HCO
3
-
)
ionsindryseasonofHoloceneaquifer.
Sulfate(SO
4
2-
)ions
Sulfate ions concentration varies from 0 to
1357.42mg/l.Among394processedsamples,74
DangMai,NguyenThanhLan/VNUJournalofScience,EarthSciences23(2007)194‐201
198
samples have the lowest concentration, while
274 samples (63.85%) have sulfate ions
concentration less than 50 mg/l. The samples
having concentration intervals of 50‐100, 100‐
150, possess a small percentage. In general,
thehighertheintervalofconcentration,theless
quantity of samples is. So that, the freq uency
distributionisskewedtotheleft(Fig.7).Inthis
case,theaveragevalueissignificantlydifferent
fromthemedian.Indeed,theaveragevalueequals
140.88mg/l,whilethemedianequals26.37mg/l
with the corresponding standard deviations
being355.84and199.95mg/lrespectively.
mg/l
Frequency (%)
70
0
60
50
40
30
20
10
0-50 100-150 200-300 400-500 600-700 800-900 1000-1100 1200-1400
Fig.7.Frequencydistributionofbicarbonate(SO
4
2-
)
ionsindryseasonofHoloceneaquifer.
Chlorine(Cl
-
)ions
Unlike other ions, the concentration of
chlorine ions varies widely from 4.11 to
16,484.25 mg/l. The average value attains to
1,057.52mg/landthestandarddeviationequals
2,420.69mg/l.How ever,mostofsamples(52.82%)
have a concentration from 4 to 100 mg/l. The
sampleshaving
concentrationintheintervalsof
200‐300, 300‐400, make a smaller percentage.
It is rarely to have the samples with extreme
highconcentrationover9000mg/l(Fig.8).
mg/l
Frequency (%)
0
60
50
40
30
20
10
0-100 400-500 800-900 3000-4000 7000-8000 15000-17000
Fig.8.Frequencydistributionofchlorineions(Cl
-
)in
dryseasonofHoloceneaquifer.
Accordingly, probability distribution of
chlorineionsindryseasonofHoloceneaquifer
is quite different from normal distribution. In
thiscase,thevalueof89.07mg/latmedianand
the value of 2289.63 mg /l at percentile of 85%
should replacethe averagevalueand standard
deviationrespectively.
Calcium(Ca
2+
)ions
Concentration of calcium ions varies from
9.62 to 1109.22 mg/l. Except for one abnormal
sample, the concent r ation is less than 350 mg/l.
The most popular concentration is in the
interval of 50‐100 mg/l that make 43.7% of
total samples. The intervals of 0‐50, 100‐
150,
150‐200 mg/l, have a smaller percentage. The
concentration intervals produce a frequency
polygon thatis moreorless symmetricaround
maximum value (Fig. 9). This polygon reflects
the similarity with normal distribution of
calcium ions. In this case the value of 97.15 at
meanapproximatetothevalue
85.15atmedian.
mg/l
Frequency (%)
50
40
30
20
10
0
50-100 50-100 100-150 150-200 200-250 250-300 300-350
Fig.9.FrequencydistributionofCa
2+
ionsindry
seasonofHoloceneaquifer.
Magnesium(Mg
2+
)ions
Apart from the two samples without Mg
2+
,
similarly to calcium ions, the concentration of
magnesiumionsvariesfrom2.38to1053.69mg/l.
The frequency distribution of Mg
2+
is clearly
different from Ca
2+
. While frequency polygon
ofcalcium ionsconcentration issub‐symmetry,
the one of magnesium ions skews to the left
with maximum value being 100‐150 mg/l (Fig.
10). This polygon was drawn in accordance
with different intervals depending on the
concentration values. The interval of 50 mg/l is
frequently
used.
DangMai,NguyenThanhLan/VNUJournalofScience,EarthSciences23(2007)194‐201
199
Probability distribution of magnesium ions
is clearly different from normal distribution.
The average value is not representative to
magnesiumionsconcentration inthiscase. The
value of 35.48 mg/l at median should replace
theaveragevalueof98.83mg/l.
mg/l
Frequency (%)
70
60
50
40
30
20
10
0
0-50
200-250 300-350 400-450 500-550 600-700 800-1000 1050-1100
Fig.10.FrequencydistributionofMg
2+
ions
indryseasonofHoloceneaquifer.
Sodium(Na
+
)ions
Exceptfortheabnormalvalueof37.432mg/l,
the concentration of sodium ions varies from
0.48 to 9619.48 mg/l. The samples with
concentration less than 450 mg/l and less than
50 mg/l make over 74%
and 40% in total
respectively, while the samples with high
concentrationtakelessthan1%(Table2).
Accordingly, similar to magnesium ions,
frequencydistributionofsodiumionsskews to
the left. Hence, the value of 720.52 at mean is
different from their value of 70.32 at median.
Accordin gtoEquation(2),
thestandar ddeviation
equals2317.05mg/lwhilethevalueatpercentile
of 85% equals 1327.14 mg/l. In this case, the
values of 70.32 and 1327.14 mg/l should be
taken as representative values for sodium ions
concentrationindryseasonofHoloceneaquifer.
Twokindsofiongroupin
Holoceneaquifer
in RRD can be distinguished based on the
probability distribution law. The first group
that consistsof bicarbonateand calciumionsis
characterized by sub‐normal distribution. The
second one that consists of sulfate, chlorine,
sodium and magnesium ions are characterized
by a skew distribution and are quite different
fromnormaldistribution.Forthefirstgroup,the
averagevalue of concentration isapproximately
equal to median; while for the second group,
thesetwovaluesarequitedifferent.Inbothdry
andrainyseasons,averagevaluesofconcentration
of bicarbonate ions and calcium ions become
highest in anions and cations
respectively.
These results show that Holocene aquifer
belongstobicarbonate‐calciumtype.
2.3.
Quantitativedistributionofchemicalcomponents
ofgroundwaterinPleistoceneaquifer
Pleistocene aquifer is the biggest and
distributed widely in RRD. It composes of two
layers characterized by a fine grain size and
coarsegrainsize[4,5].Finesedimentscompos ed
mainlyofsandinthelowerpartandweathered
clay in
the upper part of VinhPhuc Formation
(Q
1
3
vp). The thicknessof this layer varies from
1mto55.7m.Thethicknessofcoarsesediments
varies from 4 m to 60.5 m and composed of
pebbles, gravel, cobble of Hanoi Formation
(Q
1
2
hn)andLeChiFormation(Q
1
1
lc).
Quantitative distribution of main ions of
Pleistocene aquifer is similar to Holocene
aquifer in term of probability law. Bicarbonate
and calcium ions have sub‐normal distribution
in rainy and dry season, while the other ions
have skew distribution. It is easy to recognize
this rule by comparing the average values
of
ions concentration with the corresponding
valuesatmean(Table3).
Atthemeanvalue,bicarbonateandcalcium
ion concentrations are the highest among
anions and cations respectively. Therefore,
Pleistoceneaquiferalsobelongstobicarbonate‐
calcium type. These characteristics make the
similarity between Pleistocene and Holocene
aquifersintermof
geochemicalfeatures.
The significant difference between them is
decided by total mineral degree and displayed
inTable4.Inthistable,thesecondandthird(2,
3)columnsrefertothemeanofconcentrationof
main ions in rainy season of Pleistocene and
Holocene aquifers,thefourth (4)column refers
DangMai,NguyenThanhLan/VNUJournalofScience,EarthSciences23(2007)194‐201
200
Table2.ConcentrationfrequencyofNa
+
inrainyseasonofHoloceneaquifer
Concen‐
tration(mg/l)
Number
ofsamples
Frequency
(%)
Concen‐
tration(mg/l)
Numberof
samples
Frequency
(%)
Concen‐
tration(mg/l)
Number
ofsamples
Frequency
(%)
0‐50 159 40.87 850‐900 4 1.03 2800‐2900 3 0.77
50‐100 60 15.42 900‐950 2 0.51 2900‐3000 2 0.51
100‐150 21 5.40 950‐1000 1 0.26 3000‐3200 3 0.77
150‐200 12 3.08 1000‐1200 4 1.03 3200‐3400 1 0.26
200‐250 11 2.83 1200‐1300 3 0.77 3400‐3600 1 0.26
250‐300 9
2.31 1300‐1400 2 0.51 3600‐3700 1 0.26
300‐350 7 1.80 1400‐1600 7 1.80 3700‐3900 1 0.26
350‐400 3 0.77 1600‐1700 3 0.77 3900‐4000 2 0.51
400‐450 8 2.06 1700‐1800 1 0.26 4000‐4300 1 0.26
450‐500 5 1.29 1800‐
2000 5 1.29 4300‐5100 1 0.26
500‐550 3 0.77 2000‐2100 5 1.29 5100‐5800 1 0.26
550‐600 1 0.26 2100‐2200 3 0.77 5800‐5900 1 0.26
600‐650 3 0.77 2200‐2300 3 0.77 5900‐8400 3 0.77
650‐700 5 1.29 2300‐2400 2 0.51
8400‐8700 1 0.26
700‐750 3 0.77 2400‐2600 1 0.26 8700‐8800 1 0.26
750‐800 2 0.51 2600‐2700 2 0.51 8800‐9700 1 0.26
800‐850 4 1.03 2700‐2800 1 0.26
Table3.Statisticalcharacteristicofions inPleistoceneaquifer(mg/l)
RainyseasonDryseason
Ion
X
Percentile
at50%
Min Max
X
Percentile
at50%
Min Max
Na
+
228.12 43.64 1.49 3662.56 243.88 46.16 0.18 5141.02
Ca
2+
55.85 45.09 1.84 264.25 55.07 40.92 4.43 340.68
Mg
2+
34.95 16.33 0.00 327.71 41.27 18.24 1.25 486.16
Cl
-
392.91 47.86 4.43 6646.88 425.54 48.74 4.93 9482.88
SO
4
2-
30.97 9.51 0.00 869.54 42.73 11.96 0.00 2392.00
HCO
3
-
260.03 219.67 0.00 1342.44 273.84 219.67 0.00 1476.68
Table4.ComparisonofcharacteristicsofionsconcentrationinPleistoceneandHoloceneaquifers
RainyseasonDryseason
Ion
Pleistocene Holocene Ratio Pleistocene Holocene Ratio
(1) (2) (3) (4) (5) (6) (7)
Na
+
43.64 63.01 0.69 46.16 70.32 0.66
Ca
2+
45.09 85.75 0.53 40.92 85.17 0.48
Mg
2+
16.33 30.21 0.54 18.24 35.48 0.51
Cl
-
47.86 77.67 0.62 48.74 89.07 0.55
SO
4
2-
9.51 26.11 0.36 11.96 26.37 0.45
HCO
3
-
219.67 381.38 0.58 219.67 414.94 0.53
DangMai,NguyenThanhLan/VNUJournalofScience,EarthSciences23(2007)194‐201
201
to the ratio of mean of ions concentration in
PleistoceneandHoloceneaquifers.Thefifth(5),
sixth(6),seventh(7)columnsaresimilarbutfor
dryseason.ThedatainTable4indicatethatthe
mean of ions concentration in Pleistocene
aquifer is two times lower than that in
Holocene,
orinotherword, Pleistoceneaquifer
is tasteless than Holocene one. In combination
with high reserve and wide distribution, these
characteristics make Pleistocene aquifer to be
themaingroundwaterresourceforHanoi,Vinh
Yen,PhucYen,HaTay,HaiDuong,HungYen,
andBacNinhprovinces[4].
3.Conclusions
On the
basis of frequency distribution, the
maincharacteristicsof quantitativedistribution
of chemical components of groundwaterinthe
RedRiverDeltaareindicatedasfollowing:
1. Probability distribution of bicarbonate
and calcium ions concentrations in dry and
rainy seasons of Holocene and Pleistocene
aquifers are more or less in accordance with
normaldistribution.
2. The other ions such as sulfate, chlorine,
sodiumandmagnesiumonesareinaccordance
with skew distribution. In this case, it is
necessary to determine the value of mean and
standard deviation at percentiles of 50% and
85%. The software SPSS for Window and
Microsoft Excel are useful
tools for calculating
thosevalues.
3. Pleistocene and Holocene aquifers of the
RRDbelongtobicarbonate‐calciumtype.
4. As a general rule, concentration of all
kind of ions in Pleistocene aquifer is
significantlylowerthanthatinHoloceneone.
Acknowledgements
This paper was completed within the
framework of Fundamental
Research Project
703106 funded by Vietnam Ministry of Science
andTechnology.
References
[1] Dang Mai, Application of mathematics in geology,
VNU Publishing House, Hanoi, 2004 (in
Vietnamese).
[2] Department of Geology and Minerals of
Vietnam, Characteristics of groundwater dynamics
in the Red River Delta (1988‐2004), Hanoi, 2005
(inVietnamese).
[3] N.A. Kitaev, Multidirectional analysis of
geochemical field, Nauka, Novoxibirsk, 1990 (in
Russian).
[4] Le Van Hien (Editor), Groundwater of the Red
River Delta, Vietnam Department of Geology
andMinerals,Hanoi,2000(inVietnamese).
[5] Nguyen Thi Ha, Relationship between
stratigraphy, paleo‐climate, and chemical
components of groundwater in Quaternary
sediments in the Red River Delta, Journal of
GeologyA/280(2004)
63(inVietnamese).
[6] Nguyen Van Lieu, Nguyen Dinh Cu, Nguyen
Quoc Anh, SPSS‐Application in business
management and natural‐social sciences data
processing, Transportation Publishing House,
Hanoi,2000(inVietnamese).
[7] Rumsixki, Mathematical methods in processing
experimental results, Publishing House of
Technology and Science, Hanoi, 1971
(Vietnamesetranslationfrom
Russian).
[8] TongNgocThanh,Statusofgroundwaterinthe
Red RiverDelta, Journalof GeologyA/280 (2004)
21(inVietnamese).