Báo cáo " Fishing ground forecast in the offshore waters of CentralVietnam (experimental results for purse-seine and drift-gillnet fisheries) " docx
Bạn đang xem bản rút gọn của tài liệu. Xem và tải ngay bản đầy đủ của tài liệu tại đây (206.59 KB, 7 trang )
VNU Journal of Science, Earth Sciences 26 (2010) 57-63
57
Fishing ground forecast in the offshore waters
of CentralVietnam
(experimental results for purse-seine and drift-gillnet fisheries)
Doan Bo
1,
*, Le Hong Cau
2
, Nguyen Duy Thanh
2
1
Faculty of Hydro-Meteorology & Oceanography, Hanoi University of Science, VNU,
334 Nguyen Trai, Hanoi, Vietnam
2
Research Institute for Marine Fisheries, 224 Le Lai, Hai Phong, Vietnam
Received 05 September 2010; received in revised form 24 September 2010
Abstract. This paper specifies that research, analysis and estimate on marine environmental and
biological conditions are very important for fishing ground forecast in offshore waters.
The multi-variate regression equations among Catch Per Unit Efforts (CPUE), temperature
structures and primary production have been established and used for monthly fishing ground
forecast for purse-seine and drift-gillnet fisheries in the offshore waters of central Vietnam. The
experiment forecast result in May, June and July, 2009 presented up to 60 percentage of acception.
Meanwhile, the quantity of good forecasts are about 50% and the quantity of excellent forecasts
ranks from 25 to 41%.
The Length base Cohort Analyis (LCA) and Thompson and Bell models have been used for
annual fishing ground forecast for Skipjack tuna (Katsuwonus pelamis) population, which is main
object of drift-gillnet fishery. The forecast results showed that when yield in 2009 is 17,831
tonnes, its biomass in early that year is 111,906 tonnes and its forecast yield in 2010 is 18,211
tonnes. If the fishing effort in 2009 is X=1.0, its value of MSY (19,319 tonnes/year) will be gained
corresponding to X=2.0.
Keywords: Fishing ground forecast, offshore waters, purse-seine fishery, drift-gillnet fishery
1. Methodology
∗
Changes of fish shoals under mutual
influence of environment-biosphere-human
factors are described by the following biomass
balance equation [1]:
ϕ++−+=
∂
∂
)( MFRW
t
N
(1)
where, N is the biomass of fish shoal (amount
of individual), t - time, W - the growth rate of
fish shoal, R - the biomass supplemented from
_______
∗
Corresponding author. Tel.: 84-4-35586898.
E-mail:
new fish generations, F - the death rate due to
catching (human factor), M - the death rate due
to natural factors, and ϕ - the incidental factors
which cannot be predicted.
If the impact of catching is considered as a
decisive factor, then the hydrological and
biological conditions must be at least
considered in the research of fishery variations.
Their influence on the R value is equally
investigated. According to the evaluation of
many researchers, no techniques have been
successful in forecasting changes of fisheries
without analyzing the complicated interactions
D.Bo et al. / VNU Journal of Science, Earth Sciences 26 (2010) 57-63
58
of meteorological, oceanological and biological
factors.
This methodology recognizes that there is a
close relationship between the environmental
conditions and the concentration of fish. Any
change of environmental factors may lead to
quantitative changes of the distribution of fish
community. This has been confirmed by
practice in the last several decades, where much
knowledge about the nature of the marine
ecosystems has been accumulated and longer
data time series are available
Most variable environmental factors include
meteorological characteristics, atmospheric
pressure patterns and synoptic patterns,
temperature and salinity structures of the sea
water, hydrological front and circulation
structure, whereas such factors as sea floor
topography and sediments are less variable.
Biological factors of fish include distribution,
community structure, reproduction,
development in the first generations, growth,
migration, traditional feed, prey-predator
relationship, fishing and catching output.
Each fish species and each period of their
development has certain ecological and
environmental limit, which may be related to
fluctuation periods of environmental factors, the
interrelation between them, and the catching
output. Corresponding with those fluctuation
periods, there are the terms of fishing ground
forecast, as following:
Short-term forecast has a term of one week,
half month, one month and one quarter. Short-
term fishery forecast is concentrated to the
prediction of changes, which are likely to occur
to the fish concentration in a very near future.
The method of forecast includes the
simultaneous use of oceanological information
and the latest statistical data on fisheries. Short-
term forecast only takes place within a limited
space and the information released is fairly
concrete, taking into consideration the most
effective means of fishing. These are the
differences from the long-term forecast. The
changes of oceanological factors in the forecast
area such as temperature, salinity, currents,
disturbance and displacement of water masses
would affect immediately the migration, change
of location, density and size of the fish shoal.
Long-term forecast has a term of half year,
one year, 2 years, 5 years, 10 years and 20
years. Long-term forecast requires more
diversified biological, oceanological and
environmental information than short-term one.
The variation effects with long periods of the
oceanological conditions can cause changes in
the population of the fish shoal, based on the
success or failure of its reproduction, the
surviving rate of the fish generation within its
life cycle and the migration of additional fish
shoals. Long-term forecast is aimed at three
objectives: 1) to ensure efficiency for the
“fishing campaign” of marine fishing
enterprises and companies; 2) to ensure
scientific basis for the national administrative
coordination and management in fisheries; and
3) to ensure scientific basis for the short-term
forecasting activities of fisheries research
institutes. Thus, long-term forecast shows more
academic characters than short-term forecast
and it is under the responsibility of central
institutions such as national institutes and
universities. Nowadays, long-term forecast can
be divided into two categories corresponding to
the degree of reliability: 1) long-term forecast
has a time extent of below one year and has a
higher degree of reliability and especially in
this forecast the fish communities traditionally
caught are fully investigated; 2) superlong-term
forecast has a forecast term from 2 to 20 years.
The difficulty of the forecast is that it must be
based on values which are still unknown, for
example the forecast is made on the basis of
meteorological and oceanological forecasts,
D.Bo et al. / VNU Journal of Science, Earth Sciences 26 (2010) 57-63
59
although the forecasts of this kind have actually
obtained considerable successes.
In this study, multidimensional correlation
analysis method was selected as a research
instrument, where the CPUE is dependent
variable and environmental characteristics are
independent variables. The method allows to
detect the degree of correlation between CPUE
and useful variables of the environmental
conditions, whereby establishing forecast model
with the use of regression equations for various
terms based on the existing data.
Together with the forecast on CPUE, it is
necessary to find out models for forecasting the
changes of the quantity of the fish community
which serves as a scientific basis for fish
resource management. Based on the same
opinion, the VPA (Virtual Population Analysis)
and LCA (Length-based Cohort Analysis)
model distributed by FAO [2, 3] not only allow
to predict the quantitative changes of fish
communities, but also are reliable instruments
for calculating the rate of death due to fishing
and value of MSY (Maximum Sustainable
Yield) when statistical fisheries data are
insufficient. Besides, VPA and LCA also
provide effective measures for fish resource
management (rational fishing and sustainable
development of fish resources)
2. Results
With the objective to establish scientific
basis for application of model on fishing ground
forecast in the offshore waters of Central
Vietnam, the problems rest on the monthly and
annual periods. The data are exploited from the
Research Institute for Marine Fisheries and the
Faculty of Hydro-Meteorology and
Oceanography, Hanoi Univesity of Science and
the General Statistics Office of Vietnam [4, 5].
2.1. Monthly fishing ground forecast for purse-
seine and drift-gillnet fisheries in the offshore
waters of Central Vietnam
The experimental model of fishing ground
forecast for purse-seine and drift-gillnet
fisheries in the off-shore waters of Central
Vietnam has been established basing on the
relationship between fish resources and
environmental parameters. This relationship
was concretized by multi-variate regression
equations among CPUE of the fisheries,
temperature structures (environmental factors)
and primary production (feed sources), as
following:
∑
=
+=
m
i
ii
XAACPUE
1
0
.
(2)
where, CPUE has the unit of kg/draught for
purse-seine fishery and kg/km-net for drift-
gillnet fishery); A
0
, A
i
are coefficients, which
can be calculated by the minimum square
method; m is the number of independent
variables; X
i
are independent variables,
including temperature structures and biological
production, such as surface temperature and its
anomaly, thickness of mixed layer, thickness
and gradien of thermocline, depth of isothermal
levels of 24
O
C, 20
O
C and 15
O
C, biomass of
phytoplankton and zooplankton, primary and
secondary productivity These variables are
monthly calculated and forecasted for the grid
of 0.5 degree.
By regression equations (2), some of the
experimental results on fishing ground forecast
for purse-seine and drift-gillnet fisheries in the
off-shore waters of Central Vietnam in May,
June and July 2009 (Fig. 1, 2 and Tab.1, 2)
showed that acceptable forecasts are about
60.0% (with maximum of 87.5% in June, 2009
for drift-gillnet fishery). Meanwhile, good
forecasts are about 50% and the quantity of
excellent forecasts ranks from 25.0 to 41.0%.
D.Bo et al. / VNU Journal of Science, Earth Sciences 26 (2010) 57-63
60
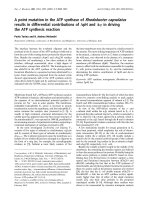
Fig. 1. Experimental result on fishing ground forecast for purse-seine fishery
in May (left) and in June (right), 2009.
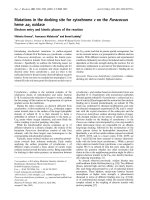
Fig. 2. Experimental result on fishing ground forecast for drift-gillnet fishery
in June (left) and in July (right), 2009.
D.Bo et al. / VNU Journal of Science, Earth Sciences 26 (2010) 57-63
61
Tab. 1. Results of checking on fishing ground forecast for purse-seine fishery
May 2009 June 2009 Absolute error
of CPUE
(kg/draught)
Grade Rate
(%)
Accumulated
rate (%)
Grade Rate
(%)
Accumulated
rate (%)
<=125 Excellent 41.67 41.67 Excellent 33.33 33.33
125-250 Good 8.33 50.00 Good 16.67 50.00
250-375 Acceptable 8.33 58.33 Acceptable 16.67 66.67
Tab. 2. Results of checking on fishing ground forecast for drift-gillnet fishery
June 2009 July 2009 Absolute error
of CPUE
(kg/km-net)
Grade Rate
(%)
Accumulated
rate (%)
Grade Rate
(%)
Accumulated
rate (%)
<=10 Excellent 25.00 25.00 Excellent 41.30 41.30
10-20 Good 37.50 62.50 Good 21.74 63.04
20-30 Acceptable 25.00 87.50 Acceptable 21.74 84.78
2.2. Annual forecast for drift-gillnet fishery
catching in the offshore waters of Central
Vietnam
Skipjack tuna (Katsuwonus pelamis) is the
main object, which occupies about 35-50%
yield of drift-gillnet fishery in the offshore
waters of Central Vietnam [4]. In order to make
the fish stock assessment for rational fishery
management on this species, the Length-based
Cohort Analysis (LCA) and Thompson and Bell
models have been used.
Analyzing data of fishery survey and
observation from 2000 to 2009 and data from
the General Statistics Office of Vietnam
showed the parameterization values for
Skipjack tuna are the followings taken as
models’ input: L
max
=84.0 cm, L
min
=13.0 cm,
L
∞
= 87.54cm, K=0.394, T
0
=-0.12, q=3E-9,
b=3.2963, M=0.72, F=0.85, amount of length
group =7, yield in 2009=17,831 tonnes.
The obtained results (Tab.3) from this
model show that when yield of Skipjack tuna
population in 2009 is 17,831 tonnes (6,918,700
individuals), its biomass in early that year is
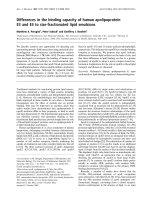
111,906 tonnes (83,067,400 individuals). If the
fishing effort of 2009 is X=1.0, its value of
MSY (19,319 tonnes/year) will be gained
corresponding to X=2.0 and the decrease of its
yield will happen when X is over 2.0 (Fig 3).
With annual increasing rate of fishing effort of
10% (X=1.1), forecast yield of Skipjack tuna
population in 2010 will be 18,211 tonnes.
The results also point out that fishing yield
in 2009 for Skipjack tuna has not reached its
limit, and the managers can choose becoming
value of X for fishery strategy in the future.
D.Bo et al. / VNU Journal of Science, Earth Sciences 26 (2010) 57-63
62
14
15
16
17
18
19
20
11.522.533.544.555.566.577.588.599.5X
1000 tonne
Coefficient X
MSY=19,319 tonnes
Fig. 3. The change of fishing yield (tonne) and effort coefficient for Skipjack tuna.
Tab. 3. Results from LCA model for Skịpjack tuna population
Yield Biomass
Length group
(cm)
1000
Individuals
Tonne
1000
Individuals
Tonne
A. Analysis of yield and estimate of biomass in 2009
<15 70.6 2.5 4,414.7 157.1
15-27 263.6 35.7 23,998.5 3,251.1
27-39 312.8 188.0 20,265.7 12,180.4
39-51 3,786.3 6,325.9 20,881.8 34,887.7
51-63 1,880.7 6,849.1 10,067.2 36,662.5
63-75 532.1 3,637.6 3,131.4 21,407.3
>75 72.7 792.2 308.1 3,359.6
Total 6,918.7 17,831.0 83,067.4 111,905.8
B. Forecast of yield and biomass when varying coefficient of fishing effort
Coefficient (X) Yield Biomass
0 0.0 0.0 88,309.7 180,956.4
1.0 (*) 6,918.7 17,831.0 83,067.4 111,905.8
1.1 7,301.4 18,211.4 82,777.4 108,260.6
1.2 7,655.4 18,511.8 82,509.2 104,923.0
… … … … …
1.8 9,331.2 19,285.9 81,239.4 89,690.6
1.9 9,554.0 19,311.3 81,070.6 87,749.1
2.0 (**) 9,764.5 19,319.1 80,911.1 85,936.0
2.1 9,963.7 19,312.2 80,760.2 84,239.4
2.2 10,152.6 19,292.9 80,617.1 82,648.9
… … … … …
Legend: (*) – The values in 2009;
(**) – The values of MSY
D.Bo et al. / VNU Journal of Science, Earth Sciences 26 (2010) 57-63
63
3. Conclusion
1- By multi-variate regression equations
among CPUE, temperature structures and
primary production, the results of monthly
fishing ground forecast for purse-seine and
drift-gillnet fisheries in the offshore waters of
Central Vietnam in May, June and July 2009
showed that acceptable forecasts are about
60%. Meanwhile, the quantity of good forecasts
are about 50% and the quantity of excellent
forecasts ranks from 25 to 41%.
2- The results of LCA and Thompson and
Bell models for Skipjack tuna (Katsuwonus
pelamis) population are listed indices as
following: when yield in 2009 is 17,831 tonnes,
its biomass in early that year is 111,906 tonnes
and its forecast yield in 2010 is 18,211 tonnes.
If the fishing effort in 2009 is X=1.0, its value
of MSY (19,319 tonnes/year) will be gained
corresponding to X=2.0. The results also point
out that fishing yield in 2009 for the population
has not reached its limit.
References
[1] Lê Đức Tố và nnk, Luận chứng khoa học cho
việc dự báo biến động số lượng và phân bố
nguồn lợi cá, Báo cáo tổng kết đề tài KT.03.10,
Trung tâm Thông tin tư liệu Quốc gia (1995).
[2] J.A. Gullad, Fish stock assessment. A mannual
of basic method, FAO/Wiley Series on Food and
Agriculture. Vol. I. Jonh Wiley & Sons, 1983.
[3] Đoàn Bộ, Nguyễn Xuân Huấn, Ứng dụng mô
hình LCA trong nghiên cứu nguồn lợi cá biển và
quản lý nghề cá, Tuyển tập Hội nghị Khoa học
Công nghệ Biển toàn quốc lần thứ IV, T.2, Nxb
Thống kê (1999), 1081.
[4] Đinh Văn Ưu và nnk, Xây dựng mô hình dự báo
cá khai thác và các cấu trúc hải dương có liên
quan phục vụ đánh bắt xa bờ ở vùng biển Việt
Nam, Báo cáo tổng kết đề tài KC.09.03, Trung
tâm Thông tin tư liệu Quốc gia, 2005.
[5] số liệu thống kê ngành
thủy sản 2000-2010.