Báo cáo " On some controversially-discussed Raman and IR bands of beryl " pdf
Bạn đang xem bản rút gọn của tài liệu. Xem và tải ngay bản đầy đủ của tài liệu tại đây (359.42 KB, 10 trang )
VNU Journal of Science, Earth Sciences 26 (2010) 32-41
32
On some controversially-discussed Raman and IR bands
of beryl
Le Thi Thu Huong
1
, Tobias Häger
2
1
Faculty of Geology, Hanoi University of Science, VNU, 334 Nguyen Trai, Hanoi, Vietnam
2
Institute of Geology, Johannes Gutenberg – University (Mainz, Germany)
Received 14 September 2010; received in revised form 28 October 2010
Abstract. Natural and synthetic beryl, Al
2
Be
3
Si
6
O
18
, from various deposits and manufacturers
were investigated with Raman, IR spectroscopy, Laser Ablation Inductively Coupled Plasma Mass
Spectrometry (LA-ICP-MS) and Electron Microprobe Analysis (EMPA). The Raman-band at
1067-1072 cm
-1
and the IR-band at 1071-1207 cm
-1
have been assigned till now either to Si-O or
to Be-O by different studies. Following the findings in this study that the position and Full Width
at Half Maximum (FWHM) of these bands were related to the concentration of silicon but not that
of beryllium, it stated that these bands were generated by the vibration of Si-O.
Keywords: Raman, Infrared spectroscopy, FWHM, band position, beryl.
1. Introduction
∗
In this study we focused on one Raman
band at about 1067-1072 cm
-1
and one IR band
at about 1071-1207 cm
-1
of the cyclo-silicate
mineral beryl, Al
2
Be
3
Si
6
O
18
(SiO
2
-67 wt%,
Al
2
O
3
-18,9 wt%, BeO-14,1 wt%, theoretically).
The study aimed to obtain a better
understanding of vibrational features of beryl
and to assign precisely the presented bands to
the vibrations. There have been many studies
using factor group analysis to calculate lines
(Adams & Gardner, 1974, [1] Hofmeister et al.,
1987, [2] Kim et al., 1995 [3]). Nevertheless,
assignment of observed bands to certain
vibrations was always one of the most
challenging tasks in vibration spectroscopy,
_______
∗
Corresponding author. Tel.: 84-4-35587061
E-mail:
such as Raman and Infrared (Nasdala et al.
2004 [4]). As calculated by Kim et a. (1995) [3]
and described by Moroz et al (2000) [5], the
Raman band at 1067-1072 cm
-1
has been
assigned to Be-O vibration. However, this band
was attributed by Adams & Gardner [1] and
mentioned in the study of Charoy et al. (1996)
[6] to the Si-O bond. Similarly, the IR band at
1071-1207 cm
-1
has been assigned to Be-O
vibration by Plyusnina [7], Plyusnina &
Surzhanskaya [8] and to Si-O vibration by
Aurisicchio et al. [9], Manier-Glavinaz et al.
[10], Hofmeister et al. [2], Adams & Gardner
[1], Gervais & Pirou [11]. According to our
study, the features of both Raman and IR bands
(band position and band width) were clearly
related to the concentration of Si in the samples.
The band width was shown to be broader in the
samples containing a lower amount of silicon;
L.T.T. Huong, T. Häger / VNU Journal of Science, Earth Sciences 26 (2010) 32-41
33
moreover, the Raman shift appeared at lower
frequency in the samples with higher silicon
content and the IR band was at a higher position
in these samples. Such relations were not found
between these bands and Be concentration. We
were therefore able to confirm the assignment
of these bands to Si-O vibration.
2. Material and experimental methods
Narural beryls from Brazil (Carnaiba,
Capoeirana, Itabira, Santa Terezinha, Socoto),
Colombia (Chivor), Austria (Habachtal), Russia
(Ural), Madagascar (Mananjary), South Africa
(Transvaal), Zambia (Kafubu), Nigeria
(Gwantu), China (Malipo) and synthetic ones
from Tairus, Biron (hydrothermally-grown),
Gilson, Chatham, Lennix (flux-grown) were
collected in order to cover a wide range of
chemical components. Eighty single crystals
and facetted stones were chosen for Raman
measurement and Raman spectra were obtained
from their surfaces. Then, thirty six crystals
chosen from among those already analysed by
Raman underwent chemical analysis by LA-
ICP-MS and EMPA. From the purest eighteen
inclusion-free crystals and facetted stones, 2 mg
of powder were scraped using a diamond point
for IR measurements.
All Raman spectra were recorded at room
temperature using a Jobin Yvon (Horiba group)
LabRam HR 800 spectrometer. The system was
equipped with an Olympus BX41 optical
microscope and a Si-based CCD (charge-
coupled device) detector. Spectra were excited
by Ar
+
ion laser emission with 514 nm as a
green laser with a grating of 1800 grooves/mm
and a slit width of 100 µm. Due to these
parameters and the optical path length of the
spectrometer a resolution of 0.8 cm
-1
resulted.
The spectra acquisition time was set at 240
seconds for all measurements. Geometrical
factors were strongly controlled in all Raman
measurements. One polarizer was used allowing
only the laser beam with definitive vibrational
direction (N-W) to pass through. Experiments
were then conducted with the normal
orientations of the beryl crystal (i.e orientations
of c axis) with regard to E, the electric vector.
IR spectra of beryls were recorded using a
PERKIN ELMER FT-IR Spectrometer 1725X
with 100 scan and 4 cm
-1
resolution. The
samples were prepared as pellets made out of 2
mg of powdered beryl mixed with 200 mg KBr
powder to minimize the polarization effects.
Peak analysis for both IR and Raman
measurements was performed with an Origin-
lab 7.5 professional software package. The
single and overlapping peaks were smoothed
using the Lorentz-Gauss function.
Chemical analyses were carried out by
means of LA-ICP-MS and EMPA. The use of
LA-ICP-MS served to identify Li, Be, B, Na,
Mg, Al, P, K, Ca, Sc, Ti, V, Cr, Mn, Fe, Co, Ni,
Ga, Ge, Rb, Sr, Y, Zr, Nb, Mo, Cs, Ba, La and
Ta. EMPA was used to identify the main
element Si and other elements as well in order
to have a reference matrix between LA-ICP-MS
and EMPA measurements.
Ablation was achieved with a New Wave
Research UP-213 Nd:YAG laser ablation
system, using a pulse repetition rate of 10 Hz
and 100 µm crater diameters. Analyses were
performed on an Agilent 7500ce inductively
coupled plasma - mass spectrometer in pulse
counting mode (one point per peak and 10 ms
dwelling time). Data reduction was carried out
using Glitter software. The amount of material
ablated in laser sampling was different for each
spot analysis. Consequently, the detection limits
were different for each spot and were calculated
for each individual acquisition. Detection limits
generally ranged between 0.001 and 0.5 ppm
(µg/g).
28
Si was used as the internal standard.
L.T.T. Huong, T. Häger / VNU Journal of Science, Earth Sciences 26 (2010) 32-41
34
Analyses were calibrated against the silicate
glass reference material NIST 612 using the
values of Pearce et al. [12], and the US
Geological Survey (USGS) glass standard
BCR-2G was measured to monitor accuracy.
Microprobe analyses were achieved with a
JEOL JXA 8900RL - electron beam -
microprobe with wavelength dispersive analysis
technique. The chemical composition of each
sample was then corrected by PAP program.
The samples were measured by an acceleration
voltage of 20 KV and 20 nA filament current.
The detection limits differed for each element
and were affected by the overall composition of
a sample and the analytical conditions. For
most elements, the detection limit for
wavelength-dispersive (WD) spectrometers was
between 30 and 300 parts per million. The
precision depended on counting statistics,
particularly the number of X-ray counted from
the standard and sample, and the reproducibility
of the WD spectrometer mechanisms. The
minimum obtainable precision was about 0.5
percent, although it was higher for elements at
trace concentrations. Therefore, EMPA was
specially used in this study for detecting main
elements.
3. Results and Discussion
3.1. Raman band at 1076-1072 cm
-1
As introduced, this band has been attributed
to the Si-O bond in the studies of Adams and
Gardner [1], Charoy et al. [6] but to the Be-O
bond in the studies of Kim et al. [3], Moroz et
al. [5] instead. According to our experimental
results, in all synthetic beryls the position of
this band was around 1067-1068 cm
-1
, in
Colombian and Nigerian samples the Raman
shift was around 1068-1070 cm
-1
and in
samples from Austria, Brazil, China,
Madagascar, Russia, South Africa, Zambia, the
Raman shift was around 1069-1072 cm
-1
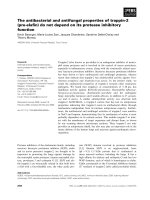
. In
other words, this band shifted to higher
frequency in natural samples than in synthetic
ones (Figure 1.). Moreover, the width of this
band also varied among samples of different
provenances. The FWHM varied from 11 cm
-1
to 14 cm
-1
in synthetic samples, from 12 cm
-1
to
15 cm
-1
in samples from Nigeria and Colombia
and from 17 cm
-1
to 26 cm
-1
in samples from
Austria, Brazil, China, Madagascar, Russia,
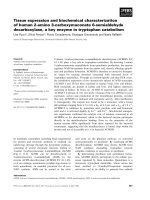
South Africa and Zambia. Figure 2. showed the
plot of the peak position versus the FWHM for
beryls of different origins. Based on the FWHM
values and the Raman positions of this band, we
could separate the samples studied into two
ranges: Range I including synthetic beryls as
well as natural Nigerian and Colombian ones
were those with low FWHM and low band
position; range II including all other
investigated natural beryls.
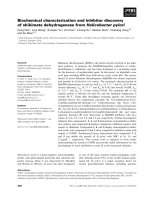
Chemical data showed that samples of
range I contained a higher amount of silicon
than those of range II. The silicon concentration
in beryls of range I varied from 65 wt% to 66,9
wt% (from 66,1 wt% to 66,9 wt% in synthetic
samples - approximately approaching the
theoretical concentration, and from 65 wt% to
66,3 wt% in Nigerian and Colombian samples)
while silicon concentration in beryls of range II
varied from about 62,5 wt% to 65 wt%. Error!
Reference source not found. showed the
correlation between the content of silicon and
band position and FWHM for beryls of
different origins. This meant that in the samples
where the silicon content was high the band
position and FWHM were low and in the
samples where the content of silicon was low
the band position and FWHM were high. We
therefore agreed with the authors who assigned
this band to vibration of Si-O, since there was
no such correlation between beryllium
concentration and band data (Figure 4.).
L.T.T. Huong, T. Häger / VNU Journal of Science, Earth Sciences 26 (2010) 32-41
35
Figure 1. Raman shift at 1067-1072 cm
-1
of synthetic (solid line) and natural beryls (dot line).
Figure 2. Peak positions versus FWHMs in natural and synthetic beryls from various origins.
L.T.T. Huong, T. Häger / VNU Journal of Science, Earth Sciences 26 (2010) 32-41
36
Figure 3. Correlation silicon content, band position and FWHM.
Figure 4. Correlation between beryllium content, peak position and FWHM.
L.T.T. Huong, T. Häger / VNU Journal of Science, Earth Sciences 26 (2010) 32-41
37
In addition, the concentration of alkali ions (Na, K, Cs) was also variable among samples.
Figure 5. Alkali content versus Si content in natural and synthetic beryls from different origins.
The alkali amount of synthetic beryls varied
from 0 wt% to 0,1 wt%, and from 0,1 wt% to
0,71 wt% in natural beryls of range I, from 0,
89 wt% to 1, 87 wt% in natural beryls of range
II.
The shifting and broadening (increasing in
FWHM) of the Raman band were primarily the
results of positional disorder. Since the band
shifting and broadening were seen in low
silicon-containing samples, there were actually
other elements than silicon occupying the
silicon position. The amount of positional
disorder in each sample was the amount of lost
silicon (in comparison with the ideal silicon
amount). Other elements which could substitute
Si are Al
3+
, Be
2+
, Li
+
, etc. Charge compensator
could be served by alkali ions (mainly Na
+
, K
+
,
Cs
+
) which existed in structural channels. That
meant, the lost of silicon in beryl structure had
to be compensated by other substituting
elements (Al
3+
, Be
2+
, Li
+
, etc.) together with
charge compensating ions (Na
+
, K
+
, Cs
+
). The
correlation between Si- and alkali ion contents
elucidated this fact, since in samples where the
Si content was low, the alkali content was high
(Figure 5.).
L.T.T. Huong, T. Häger / VNU Journal of Science, Earth Sciences 26 (2010) 32-41
38
3.2. IR band at 1071-1207 cm
-1
400 600 800 1000 1200 1400
0
10
20
30
40
T% arb. unit
Wavenumber (cm
-1
)
Natural beryl
Synthetic beryl
1140
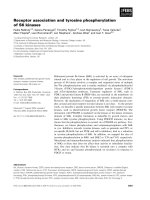
Figure 6. IR spectra in the range 400-1400 cm
-1
of beryls
(red line: natural sample from China; black line: synthetic Gilson sample).
Figure 6 showed the IR spectra in the range
400-1400 cm
-1
for one alkali-free beryl (Gilson
synthesis) and for one high-alkali-containing
beryl (Chinese sample). We focused on the
band at around 1200 cm
-1
which has been
assigned to the vibration of Be-O by Plyusnina
[7], Plyusnina & Surzhanskaya [8] but to the
vibration of Si-O by Manier-Glavinaz et al.
[10], Hofmeister et al. [2], Adams & Gardner
[1], Gervais & Pirou [11]. This band in fact
varied in its actual position between 1171 cm
-1
and 1203 cm
-1
in natural beryls (low silicon
content) and between 1200 cm
-1
to 1207 cm
-1
in
synthetic beryls (high silicon content). A plot of
band position versus Si content showed a trend,
that in samples with high silicon content the
band shifted toward high wave numbers
(Figure 7.). In addition, this band was shown to
be clearly more slender in synthetic samples
than in natural ones. Again, both band width
and band position were related to the
concentration of silicon and did not show any
relation to beryllium content. Therefore, the
assignment of this band to Si-O vibration was
preferred rather than to Be-O vibrations. This
observation corresponded with the
interpretation of the band at 1067-1072 cm
-1
in
Raman spectroscopy.
L.T.T. Huong, T. Häger / VNU Journal of Science, Earth Sciences 26 (2010) 32-41
39
Figure 7. Position of IR band at 1171-1207 cm
-1
versus Si content.
Figure 8. Intensity ratio of band at 1171-1207 cm
-1
and shoulder at 1140 cm
-1
versus Si content.
L.T.T. Huong, T. Häger / VNU Journal of Science, Earth Sciences 26 (2010) 32-41
40
One shoulder at about 1140 cm
-1
was seen
only in natural samples (with the exception of
beryls from Nigeria where the alkali content
was lower than 0,2 wt%) and was not seen in all
synthetic samples or in samples from Nigeria.
Plot of intensity ratios of band 1200 cm
-1
and
shoulder 1140 cm
-1
versus Si content showed a
positive linear trend, i.e. this intensity ratio was
high in samples with a high Si content (Figure 8.).
Therefore, not only band 1200 cm
-1
but also
shoulder 1140 cm
-1
had a relationship with the
Si content. Similarly, the plot of ratios of the
band at 1200 cm
-1
and the shoulder at 1140 cm
-1
versus the alkali contents showed a negative
linear trend, i.e. this intensity ratio was high in
samples with low alkali content (Figure 9. ).
Therefore, the existence of the shoulder at 1140
cm
-1
in all natural samples (except Nigerian
ones) could also be related to alkali ions. The
existence of this shoulder could be explained as
follows: 1. The shoulder was generated by a
vibration X-O in which X was a divalent or
trivalent cation substituting in the Si position.
The charge compensation was served by alkali
ions (Na, K, Cs) in the channel. 2. The shoulder
was generated by M-O in which M was the
alkali ion in the channel.
Figure 9. Intensity ratio of band at 1171-1207 cm
-1
and shoulder at 1140 cm
-1
versus alkali content.
L.T.T. Huong, T. Häger / VNU Journal of Science, Earth Sciences 26 (2010) 32-41
41
4. Conclusion
In this study, based on chemical data we
have shown that the features of the Raman band
at 1067-1072 cm
-1
and the IR band at 1071-
1207 cm
-1
depended on the concentration of
silicon in the sample. We therefore agreed with
the authors who assigned these bands to the
vibrations of Si-O bonding. Moreover, by using
features (FWHM, position) of these bands one
is able to separate synthetic stones which were
grown in free-alkali media from natural ones.
Raman spectroscopy as a non-destructive
method could be specially used in identification
between natural gem and synthetic beryl, since
in synthetic samples the position/FWHM of
Raman band is at 1067-1068 cm
-1
/ 11-14 cm
-1
while these are very variable in natural ones:
1068-1072 cm
-1
/12-26 cm
-1
, respectively.
Acknowledgements
This research was financed by the Johannes
Gutenberg-University Fund for Gemstone
Research and by German Academic Exchange
Service (DAAD). Analytical facilities were
provided by the Faculty of Pharmacy,
Chemistry and Geosciences at Johannes
Gutenberg-University. The authors are grateful
for the supports.
References
[1] D.M. Adams, I.R. Gardner: Single-crystal
vibrational spectra of beryl and dioptase. Journal
of the Chemical Society - Dalton Transactions
(1974) 1502.
[2] A.M. Hofmeister, T.C. Hoering, D. Virgo:
Vibrational spectroscopy of beryllium
alumosilicates: Heat capacity calculation from
band assignments. Physics and Chemistry of
Minerals, 14 (1987) 205.
[3] C. Kim,, M.I. Bell, D.A. McKeown: Vibrational
analysis of beryl (Be
3
Al
2
Si
6
O
18
) and its
constituent ring (Si
6
O
18
). Physica B 205 (1995)
193.
[4] L. Nasdala, D.C. Smith, R. Kaindl, M.A.
Ziemann: Analytical perspectives in
mineralogical research. EMU Notes in
Mineralogy 6 (2004) 281.
[5] I. Moroz, M. Roth, M. Boudeulle, G. Panczer:
Raman microspectroscopy and fluorescence of
emeralds from various deposits. Journal of
Raman Spectroscopy, 31 (2000) 485.
[6] B. Charoy, P. De Donato, O. Barres, C. Pinto-
Coelho: Channel occupancy in an alkali-poor
beryl from Serra Branca (Goias, Brazil):
Spectroscopic characterization. American
Mineralogist 81 (1996) 395.
[7] I.I. Plyusina, and E.A. Surzhanskaya: IR
spectrum of beryl. Zhurnal Prikladnoi
Spektroskopii, 7 (1967) 917.
[8] I.I. Plyusnina: Infrared absorption spectra of
beryls. Geokhimiya 1 (1964) 31.
[9] C. Aurisicchio, O. Grubessi, P. Zecchini:
Infrared spectroscopy and crystal chemistry of
the beryl group, The Canadian Mineralogist 32
(1994) 55.
[10] V. Manier-Glavinaz, R. Couty, M. Lagache: The
removal of alkalis from beryl: Structural
adjustments. Canadian Mineralogist 27 (1989)
663.
[11] F. Gervais, and B. Piriou: Étude des spectres de
réflexion infrarouge du beryl dans les région
280-1400 cm
-1
. Comptes rendus de l’Académie
des Sciences Paris, B274 (1972) 252.
[12] N.J.G. Pearce, W.T. Perkins, J.A. Westgate,
M.P. Gorton, S.E. Jackson, C.R. Neal, S.P.
Chenery: A compilation of new and published
major and trace element data for NIST SRM 610
and NIST SRM 612 glass reference materials.
Geostandards Newsletter 21 (1997) 115.