Elderly Americans potx
Bạn đang xem bản rút gọn của tài liệu. Xem và tải ngay bản đầy đủ của tài liệu tại đây (317.85 KB, 44 trang )
BULLETIN
A publication of the Population Reference Bureau
Population
Vol. 56, No. 4
June 2002
Elderly Americans
are living longer
and healthier lives.
The baby-boom
generation will swell
the ranks of the
elderly after 2010.
The needs of elderly
Americans present a
major challenge for
the 21st century.
Elderly Americans
by Christine L. Himes
Population Reference Bureau (PRB)
Founded in 1929, the Population Reference Bureau is the leader in providing timely, objective
information on U.S. and international population trends and their implications. PRB informs
policymakers, educators, the media, and concerned citizens working in the public interest
around the world through a broad range of activities including publications, information
services, seminars and workshops, and technical support. PRB is a nonprofit, nonadvocacy
organization. Our efforts are supported by government contracts, foundation grants, individual
and corporate contributions, and the sale of publications. PRB is governed by a Board of
Trustees representing diverse community and professional interests.
Officers
Michael P. Bentzen, Chairman of the Board
Partner, Hughes and Bentzen, PLLC, Washington, D.C.
Patricia Gober, Vice Chairwoman of the Board
Professor of Geography, Arizona State University, Tempe, Arizona
Peter J. Donaldson, President
Population Reference Bureau, Washington, D.C.
Montague Yudelman, Secretary of the Board
Senior Fellow, World Wildlife Fund, Washington, D.C.
Richard F. Hokenson, Treasurer of the Board
Director of Demographic Research, Credit Suisse First Boston, New York
Trustees
Francisco Alba, Professor, El Colegio de México, D.F., México
Jodie T. Allen, Assistant Managing Editor, U.S. News & World Report, Washington, D.C.
Patty Perkins Andringa, Consultant and Facilitator, Bethesda, Maryland
Pape Syr Diagne, Director, Centre for African Family Studies, Nairobi, Kenya
Bert T. Edwards, Executive Director, Office of Historical Trust Accounting, Office of the Secretary,
U.S. Department of the Interior, Washington, D.C.
Klaus M. Leisinger, Executive Director, Novartis Foundation for Sustainable Development,
Basel, Switzerland
Karen Oppenheim Mason, Director, Gender and Development, The World Bank, Washington, D.C.
Francis L. Price, Chairman and CEO, Q3 Industries and Interact Performance Systems, Columbus, Ohio
Douglas Richardson, Director, Research and Strategic Initiatives, Association of American Geographers,
Washington, D.C., and Founder and Director, The GeoResearch Institute, Bethesda, Maryland
Charles S. Tidball, M.D., Professor Emeritus of Computer Medicine and Neurological Surgery,
School of Medicine and Health Sciences, George Washington University, Washington, D.C.
Barbara Boyle Torrey, Executive Director, Division of Behavioral and Social Sciences,
National Research Council, National Academy of Sciences, Washington, D.C.
Mildred Marcy, Chairwoman Emerita
Editor: Mary Mederios Kent
Production Manager: Heather Lilley
Graphic Designer: Lolan O’Rourke, LO Designs
The Population Bulletin is published four times a year and distributed to members of the Popula-
tion Reference Bureau. Population Bulletins are also available for $7 (discounts for bulk orders).
To become a PRB member or to order PRB materials, contact PRB, 1875 Connecticut Ave.,
NW, Suite 520, Washington, DC 20009-5728; Phone: 800/877-9881; Fax: 202/328-3937;
E-mail: ; Website: www.prb.org.
The suggested citation, if you quote from this publication, is: Christine L. Himes, “Elderly
Americans,” Population Bulletin 56, no. 4 (Washington, DC: Population Reference Bureau,
December 2001). For permission to reproduce portions from the Population Bulletin, write to
PRB, Attn: Permissions
© 2001 by the Population Reference Bureau
ISSN 0032-468X
1
BULLETIN
A publication of the Population Reference Bureau
Population
Vol. 56, No. 4
June 2002
Elderly Americans
Introduction. . . . . . . . . . . . . . . . . . . . . . . . . . . . . . . . . . . . . . . . . . . . . . . . . . . . . . 3
Increasing Numbers . . . . . . . . . . . . . . . . . . . . . . . . . . . . . . . . . . . . . . . . . . . . . . 4
Figure 1. U.S. Population by Age and Sex, 1900, 1970, 2000, and 2030 . . . . . 4
Table 1. U.S. Total Population and Population Age 65 or Older,
1900–2060. . . . . . . . . . . . . . . . . . . . . . . . . . . . . . . . . . . . . . . . . . . . . . . . . . . . 6
Figure 2. Age Distribution of Older Americans, 1900–2000, and
Projection to 2050 . . . . . . . . . . . . . . . . . . . . . . . . . . . . . . . . . . . . . . . . . . . . . 7
Figure 3. Elderly Americans by Race and Ethnicity, 2000 and 2050 . . . . . . . . 8
Geographic Distribution . . . . . . . . . . . . . . . . . . . . . . . . . . . . . . . . . . . . . . . . . . 9
Table 2. States Ranked by Percent Age 65 or Older, 2000 . . . . . . . . . . . . . . . . 9
Health and Functioning . . . . . . . . . . . . . . . . . . . . . . . . . . . . . . . . . . . . . . . . . . 10
Table 3. Life Expectancy at Birth and at Age 65 in Years, by Sex,
1900, 1950, and 2000 . . . . . . . . . . . . . . . . . . . . . . . . . . . . . . . . . . . . . . . . . . 11
Table 4. Leading Causes of Death for Americans Age 65
or Older, 2000 . . . . . . . . . . . . . . . . . . . . . . . . . . . . . . . . . . . . . . . . . . . . . . . 13
Box 1. Centenarians . . . . . . . . . . . . . . . . . . . . . . . . . . . . . . . . . . . . . . . . . . . . . 14
Figure 4. Chronic Health Conditions Among Americans
Age 70 or Older, by Race and Selected Age Group, 1995 . . . . . . . . . . . . 17
Box 2. Alzheimer’s Disease . . . . . . . . . . . . . . . . . . . . . . . . . . . . . . . . . . . . . . . . 18
Family Roles . . . . . . . . . . . . . . . . . . . . . . . . . . . . . . . . . . . . . . . . . . . . . . . . . . . . 20
Figure 5. Marital Status of Men and Women Age 65 or Older, 2001. . . . . . . 22
Figure 6. Sources of Informal Care for Frail Elderly Americans,
by Race, 1993 . . . . . . . . . . . . . . . . . . . . . . . . . . . . . . . . . . . . . . . . . . . . . . . . 23
Table 5. Timing of Grandparenthood and Grandparenting Roles,
1992–1994. . . . . . . . . . . . . . . . . . . . . . . . . . . . . . . . . . . . . . . . . . . . . . . . . . . 24
Living Arrangements . . . . . . . . . . . . . . . . . . . . . . . . . . . . . . . . . . . . . . . . . . . . 24
Figure 7. Living Arrangements of Men and Women Age 65 or Older,
by Sex and Race or Ethnicity, 2000. . . . . . . . . . . . . . . . . . . . . . . . . . . . . . . 25
Work and Retirement . . . . . . . . . . . . . . . . . . . . . . . . . . . . . . . . . . . . . . . . . . . . 27
Figure 8. Labor Force Participation for Selected Age Groups,
Men and Women, 1970 and 2001 . . . . . . . . . . . . . . . . . . . . . . . . . . . . . . . . 28
Continued on page 2
2
About the Author
Christine L. Himes is associate professor of sociology and senior research analyst in the Center
for Policy Research, Maxwell School of Public Affairs, Syracuse University. She previously
served as director of the Syracuse University Gerontology Center and as co-director of the Geron-
tology Education Program. Her current research focuses on patterns of health and mortality in
later life, particularly on the role of obesity on later-life functioning. She has published numer-
ous articles on family caregiving, old-age mortality patterns, and later-life health.
The author would like to thank Douglas Wolf, Madonna Harrington Meyer, and Christine
Caffrey, as well as PRB staff members Mark Mather and Kelvin Pollard, for their comments,
suggestions, and assistance in preparing this report. The author also appreciates the comments
of Amy Pienta and Kenneth Ferraro, who reviewed an earlier draft of the manuscript, and the
editorial suggestions and guidance of Mary Kent.
© 2001 by the Population Reference Bureau
Income and Poverty . . . . . . . . . . . . . . . . . . . . . . . . . . . . . . . . . . . . . . . . . . . . . 30
Table 6. Sources of Income Among Americans Age 65 or Older,
by Income Level, 1998. . . . . . . . . . . . . . . . . . . . . . . . . . . . . . . . . . . . . . . . . 31
Box 3. Is There a Social Security Crisis? . . . . . . . . . . . . . . . . . . . . . . . . . . . . . 32
Table 7. Social Security Beneficiaries, December 2000. . . . . . . . . . . . . . . . . . 34
Table 8. Poverty Rates Among Elderly Men and Women,
by Race and Ethnicity, 2000. . . . . . . . . . . . . . . . . . . . . . . . . . . . . . . . . . . . . 35
Figure 9. Poverty Rates of Elderly Men and Women Who Live Alone:
White and African American, 2000 . . . . . . . . . . . . . . . . . . . . . . . . . . . . . . 36
The Future . . . . . . . . . . . . . . . . . . . . . . . . . . . . . . . . . . . . . . . . . . . . . . . . . . . . . . 37
References. . . . . . . . . . . . . . . . . . . . . . . . . . . . . . . . . . . . . . . . . . . . . . . . . . . . . . 38
Suggested Resources . . . . . . . . . . . . . . . . . . . . . . . . . . . . . . . . . . . . . . . . . . . 40
3
T
he United States is in the
midst of a profound demo-
graphic change: the rapid
aging of its population. The 2000
Census counted nearly 35 million
people in the United States 65 years
of age or older, about one of every
eight Americans. By 2030, demogra-
phers estimate that one in five Amer-
icans will be age 65 or older, which is
nearly four times the proportion of
elderly 100 years earlier, in 1930.
The effects of this older age profile
will reverberate throughout the
American economy and society in
the next 50 years. Preparing for
these changes involves more than
the study of demographic trends; it
also requires an understanding of
the growing diversity within the
older population.
The aging of the U.S. population
in the next 20 years is being pro-
pelled by one of the most powerful
demographic forces in the United
States in the last century: the “baby
boom” cohort, born between 1946
and 1964. This group of 76 million
children grabbed media attention as
it moved toward adulthood—chang-
ing school systems, colleges, and the
workplace. And, this same group of
people will change the profile and
expectations of old age in the United
States over the next 30 years as it
moves past age 65. The potential
effects of the baby boom on the sys-
tems of old-age assistance already are
being evaluated. This cohort’s con-
sumption patterns, demand for
leisure, and use of health care, for
example, will leave an indelible mark
on U.S. society in the 21st century.
Understanding their characteristics as
they near older ages will help us anti-
cipate baby-boomers’ future needs
and their effects on the population.
Until the last 50 years, most gains
in life expectancy came as the result
of improved child mortality. The sur-
vival of larger proportions of infants
and children to adulthood radically
increased average life expectancy in
the United States and many other
countries over the past century.
Elderly Americans
by Christine L. Himes
The lives and well-being of older Americans attract increasing
attention as the elderly share of the U.S. population rises: One-
fifth will be 65 or older in 2030.
Photo removed for
copyright reasons.
4
Now, gains are coming at the end of
life as greater proportions of 65-year-
olds are living until age 85, and more
85-year-olds are living into their 90s.
These changes raise a multitude of
questions: How will these years of
added life be spent? Will increased
longevity lead to a greater role for
the elderly in our society? What are
the limits of life expectancy?
Increasing life expectancy, espe-
cially accompanied by low fertility,
changes the structure of families.
Families are becoming more “verti-
cal,” with fewer members in each
generation, but more generations
alive at any one time. Historically,
families have played a prominent
role in the lives of elderly people. Is
this likely to change?
As much as any stage of the life
course, old age is a time of growth,
diversity, and change. Elderly Ameri-
cans are among the wealthiest and
among the poorest in our nation.
They come from a variety of racial
and ethnic backgrounds. Some are
employed full-time, while others
require full-time care. While general
health has improved, many elderly
suffer from poor health.
The older population in the 21st
century will come to later life with dif-
ferent experiences than did older
Americans in the last century—more
women will have been divorced, more
will have worked in the labor force,
more will be childless. How will these
experiences shape their later years?
The answers to these questions are
complex. In some cases, we are confi-
dent in our predictions of the future.
But for many aspects of life for the
elderly, we are entering new territory.
This report explores the characteris-
tics of the current older population
and speculates how older Americans
may differ in the future. It also looks
at the impact of aging on the U.S.
society and economy.
Increasing Numbers
The United States has seen its elderly
population—defined at those age 65
or older—grow more than tenfold
during the 20th century. There were
0
24681012
12 10 8 6 4 2
Men
Women
1900
024681012
12 10 8 6 4 2
Men
Women
1970
Age
85+
80–84
75–79
70–74
65–69
60–64
55–59
50–54
45–49
40–44
35–39
30–34
25–29
20–24
15–19
10–14
5–9
0–4
Male
Female
Baby-boom generationPercent of population Percent of population
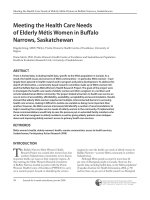
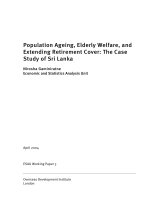
Figure 1
U.S. Population by Age and Sex, 1900, 1970, 2000, and 2030
Note: U.S. population in 1900 does not include Alaska or Hawaii. The baby-boom generation includes persons born between 1946 and 1964.
Sources: U.S. Census Bureau publications: Historical Statistics of the United States: Colonial Times to 1970 (1975); Census 2000 Summary File (SF1)
(, accessed Sept. 5, 2001); and “Population Projections of the United States by Age, Sex, Race, Hispanic Origin, and
Nativity: 1999 to 2100” (www.census.gov/population/projections/nation/summary/np-t4-a.txt, accessed Sept. 25, 2001).
5
just over 3 million Americans age 65
or older in 1900, and nearly 35 mil-
lion in 2000.
At the dawn of the 20th century,
three demographic trends—high fer-
tility, declining infant and child mor-
tality, and high rates of international
immigration—were acting in concert
in the United States and were keep-
ing the population young. The age
distribution of the U.S. population
was heavily skewed toward younger
ages in 1900, as illustrated by the
broad base of the population age-sex
pyramid for that year in Figure 1. The
pyramid, which shows the proportion
of each age and sex group in the
population, also reveals that the eld-
erly made up a tiny share of the U.S.
population in 1900. Only 4 percent of
Americans were age 65 or older, while
more than one-half (54 percent) were
under age 25.
But adult health improved and fer-
tility fell during the first half of the
century. The inflow of international
immigrants slowed considerably after
1920. These trends caused an aging
of the U.S. population, but they were
interrupted after World War II by the
baby boom. In the post-war years,
Americans were marrying and starting
families at younger ages and in
greater percentages than they had
during the Great Depression. The
surge in births between 1946 and
1964 resulted from a decline in child-
lessness (more women had at least
one child) combined with larger fam-
ily sizes (more women had three or
more children). The sustained
increase in birth rates during this 19-
year period fueled a rapid increase in
the child population. By 1970, these
baby boomers had moved into their
teen and young adult years, creating a
bulge in that year’s age-sex pyramid
shown in Figure 1.
The baby boom was followed by a
precipitous decline in fertility: the
“baby bust.” Young American women
reaching adulthood in the late 1960s
and 1970s were slower to marry and
start families than their older counter-
parts, and they had fewer children
when they did start families. U.S. fertil-
ity sank to an all-time low. The average
age of the population started to climb
024681012
12 10 8 6 4 2
Men
Women
2000
024681012
12 10 8 6 4 2
Men
Women
2030
Age
85+
80–84
75–79
70–74
65–69
60–64
55–59
50–54
45–49
40–44
35–39
30–34
25–29
20–24
15–19
10–14
5–9
0–4
Male
Female
Baby-boom generationPercent of population Percent of population
6
as the large baby boom generation
moved into adulthood, and was
replaced by the much smaller baby-
bust cohort. By 2000, the baby-boom
bulge had moved up to the middle
adult ages. The population’s age struc-
ture at younger and older ages
became more evenly distributed as
fluctuations in fertility diminished and
survival at the oldest ages increased.
By 2030, the large baby-boom cohorts
will be age 65 and older, and U.S. Cen-
sus Bureau projections show that the
American population will be relatively
evenly distributed across age groups,
as Figure 1 shows.
The radical shift in the U.S. popu-
lation age structure over the last 100
years provides only one part of the
story of the U.S. elderly population.
Another remarkable aspect is the
rapid growth in the number of eld-
erly, and the increasing numbers of
Americans at the oldest ages, above
ages 85 or 90. The most rapid growth
in the 65-or-older age group occurred
between the 1920s and the 1950s (see
Table 1). During each of these
decades, the older population
increased by at least 34 percent,
reaching 16.6 million in 1960. The
percentage increase slowed after
1960, and between 1990 and 2000,
the population age 65 or older
increased by just 12 percent. Since
the growth of the older population
largely reflects past patterns of fertil-
ity, and U.S. fertility rates plummeted
in the 1930s, the first decade of the
21st century will also see relatively
slow growth of the elderly popula-
tion. Fewer people will be turning 65
and entering the ranks of “the eld-
erly.” Not until the first of the baby-
boom generation reaches age 65
between 2010 and 2020 will we see
the same rates of increase as those
experienced in the mid-20th century.
In the 1940s and 1950s, the rapid
growth at the top of the pyramid was
matched by growth in the younger
ages—the total U.S. population was
growing rapidly, and the general pro-
file was still fairly young. That was not
the case in the second half of the
20th century, as the share of the
population age 65 or older increased
to around 12 percent. The elderly
share will increase much faster in the
first half of the 21st century. This
growth in the percentage age 65 or
older constitutes population aging.
Many policymakers and health care
providers are more concerned about
the sheer size of the aging baby-boom
generation than the baby boom’s
share of the total population. The old-
est members of this group will reach
age 65 in 2011, and by 2029, the
youngest baby boomers will have
reached age 65. This large group will
continue to move into old age at a
time of slow growth among younger
age groups. The Census Bureau pro-
jects that 54 million Americans will be
age 65 or older in 2020; by 2060, the
number is projected to approach 90
million. The size of this group, and
the general aging of the population,
are important in planning for the
future. Older Americans increasingly
Table 1
U.S. Total Population and Population Age 65 or
Older, 1900–2060
Population Percent increase from
(in thousands) preceding decade
Year Total Age 65+ Percent 65+ Total Age 65+
Actual
1900 75,995 3,080 4.1
1910 91,972 3,950 4.3 21.0 28.2
1920 105,711 4,933 4.7 14.9 24.9
1930 122,755 6,634 5.4 16.1 34.5
1940 131,669 9,019 6.8 7.2 36.0
1950 150,697 12,270 8.1 14.5 36.0
1960 179,323 16,560 9.2 19.0 35.0
1970 203,212 20,066 9.9 13.4 21.2
1980 226,546 25,549 11.3 11.5 27.3
1990 248,710 31,242 12.6 9.8 22.3
2000 281,422 34,992 12.4 13.2 12.0
Projections
2020 324,927 53,733 16.5 8.4 35.3
2040 377,350 77,177 20.5 7.5 9.8
2060 432,011 89,840 20.8 7.0 9.6
Note: Data from 1900 to 1950 exclude Alaska and Hawaii. All data refer to the resident U.S. population.
Sources: U.S. Census Bureau publications: Historical Statistics of the United States: Colonial
Times to 1970 (1975); 1980 Census of Population: General Population Characteristics (PC80-1-
B1); 1990 Census of Population: General Population Characteristics (1990-CP1); Census 2000
Demographic Profile, (www.census.gov/Press-Release/www/2001/tables/dp_us_2000.xls,
accessed Sept. 19, 2001); and Population Projections of the United States by Age, Sex, Race,
Hispanic Origin, and Nativity: 1999 to 2100 (www.census.gov/population/projections/
nation/summary/np-t4-a.txt, accessed Sept. 25, 2001).
7
are healthy and active and able to take
on new roles. At the same time,
increasing numbers of older people
will need assistance with housing,
health care, and other services.
The Oldest-Old
The older population is also aging as
more people are surviving into their
80s and 90s. In the 2000 Census,
nearly one-half of Americans age 65
or older were above age 74, com-
pared with less than one-third in
1950; one in eight were age 85 or
older in 2000, compared with one in
20 in 1950 (see Figure 2).
As the baby boomers enter their
late 60s and early 70s around 2020,
the U.S. elderly population will be
younger: The percentage ages 65 to 74
will rise to 58 percent, as shown in Fig-
ure 2. By 2040, however, just 44 per-
cent will be 65 to 74, and 56 percent
of all elderly will be age 75 or older.
Those age 85 or older, the “oldest-
old,” are the fastest growing segment
of the elderly population. While those
85 or older made up only about 1.5
percent of the total U.S. population in
2000, they constituted about 12 per-
cent of all elderly. More than 4 million
people in the United States were 85 or
older in the 2000 Census, and by 2050,
a projected 19 million will be age 85
or older. These oldest-old will make up
nearly 5 percent of the total popula-
tion, and more than 20 percent of all
elderly Americans. This group is of
special interest to planners because
those 85 or older are more likely to
require health services.
Gender Gap
Women outnumber men at every age
among the elderly. In 2000, there
were an estimated three women for
every two men age 65 or older, and
the sex ratio is even more skewed
among the oldest-old.
The preponderance of women
among the elderly reflects the higher
death rates for men than women at
every age. There are approximately
105 male babies born for every 100
female babies, but higher male death
rates cause the sex ratio to decline as
age increases, and around age 35,
females outnumber males in the
United States. At ages 85 and older,
the ratio is 41 men per 100 women.
1
Changes in the leading causes and
average ages of death affect a popula-
tion’s sex ratio. In 1900, the average
sex ratio for the U.S. total population
was 104 men for every 100 women.
But during the early 1900s, improve-
ments in health care during and after
pregnancy lowered maternal mortal-
ity, and a greater proportion of
women survived to older ages. Adult
male mortality improved much more
slowly; death rates for adult men
plateaued during the 1960s.
In recent years, however, male
mortality improved faster than female
mortality, primarily because of a
marked decline in deaths from heart
disease. The gender gap at the older
Age 65–74
Age 75–84
Age 85+
Percent of 65+ population
1900 1950 2000 2050
24
71
70 70 71
71
68
66
62
61
58
53
52
58
54
44 43
26
26
25
5
44
4
5
5
7
9
10
12
15
13 12
18
23
28
5
24
27
31
30
32
36
33
33
33
38
29
Figure 2
Age Distribution of Older Americans, 1900–2000,
and Projection to 2050
Sources: U.S. Census Bureau publications: Historical Statistics of the United States: Colonial
Times to 1970 (1975); 1980 Census of Population: General Population Characteristics (PC80-
1-B1); 1990 Census of Population: General Population Characteristics (1990-CP1); Census
2000 Demographic Profile (www.census.gov/2001/tables/dp_US_2000.xls, accessed Sept.
19, 2001); and “Projections of the Resident Population by Age, Sex, Race, and Hispanic
Origin, 1990-2100” (www.census.gov/population/www/projections/natdet-D1A.html,
accessed July 6, 2001).
8
ages has narrowed, and it is expected
to narrow further. The U.S. Census
Bureau projects the sex ratio for
those age 65 or older to rise to 79
men for every 100 women by 2050. A
sex ratio of 62 is anticipated for those
age 85 or older.
Most elderly women today will out-
live their spouses and face the chal-
lenges of later life alone: Older
women who are widowed or divorced
are less likely than older men to
remarry. Older women are more likely
than older men to be poor, to live
alone, to enter nursing homes, and to
depend on people other than their
spouses for care. Many of the difficul-
ties of growing older are compounded
by past discrimination that disadvan-
taged women in the workplace and
now threatens their economic security.
As the sex differential in mortality
diminishes, these differences may
lessen, but changes in marriage and
work patterns, family structures, and
fertility may mean that a greater pro-
portion of older women will not have
children or a living spouse. High
divorce rates and declining rates of
marriage, for instance, mean that
many older women will not have
spousal benefits available to them
through pensions or Social Security.
Ethnic Diversity
The U.S. elderly population is
becoming more racially and ethni-
cally diverse, although not as rapidly
as is the total U.S. population. In
2000, about 84 percent of the elderly
population were non-Hispanic white,
compared with 69 percent of the
total U.S. population. By 2050, the
proportion of elderly who are non-
Hispanic white is projected to drop
to 64 percent as the growing minority
populations move into old age (see
Figure 3). Although Hispanics made
up only about 5 percent of the eld-
erly population in 2000, 16 percent
of the elderly population of 2050 is
likely to be Hispanic. Similarly, blacks
accounted for 8 percent of the eld-
erly population in 2000, but are
expected to make up 12 percent of
elderly Americans in 2050.
The major racial and ethnic groups
are aging at different rates, depending
upon fertility, mortality, and immigra-
tion among these groups. Immigra-
tion has a growing influence on the
age structure of racial and ethnic
minority groups. Although most immi-
grants tend to be in their young adult
ages, when people are most likely and
willing to assume the risks of moving
to a new country, U.S. immigration
policy also favors the entry of parents
and other family members of these
young immigrants. The number of
immigrants age 65 or older is rapidly
increasing as more foreign-born eld-
erly move to the United States from
Latin America, Asia, or Africa to join
their children.
2
These older immi-
grants, plus the aging of immigrants
who entered as young adults, are alter-
ing the ethnic makeup of elderly
Americans.
2000 2050
84
8
5
4
64
12
16
7
Percent of population age 65+
Other,
non-Hispanic
Hispanic
Black,
non-Hispanic
White,
non-Hispanic
Figure 3
Elderly Americans by Race and
Ethnicity, 2000 and 2050
Note: The 2000 figures refer to residents who identified with
one race. About 2 percent of Americans identified with
more than one race in the 2000 Census.
Sources: U.S. Census Bureau, Census 2000 Demographic
Profile (2001); and U.S. Census Bureau, “Projections
of the Resident Population by Age, Sex, Race and
Hispanic Origin, 1999-2100” (www.census.gov/
population/www/projections/natdel-D1A.html,
accessed Sept. 19, 2001).
9
Geographic
Distribution
One-quarter of all elderly Americans
live in three states: California, with
3.6 million residents age 65 or older
in 2000; Florida, with 2.8 million; and
New York, with 2.4 million. Six other
states had more than 1 million elderly
residents counted in the 2000 Census:
Illinois, Michigan, New Jersey, Ohio,
Pennsylvania, and Texas. These nine
states—which are also the most popu-
lous U.S. states—accounted for just
over one-half of the population age
65 or older. Sparsely populated states
such as Alaska, Wyoming, Vermont,
and North Dakota have small elderly
populations—less than 100,000 each
in 2000.
States with large elderly popula-
tions, however, do not necessarily
have older age profiles. California is
still a relatively young state even
though it has the greatest number of
elderly residents: Less than 11 per-
cent of the state’s total population
was age 65 or older in 2000. In con-
trast, nearly 18 percent of Florida’s
population was age 65 or older, the
highest proportion of any state (see
Table 2). The older population also
exceeded 15 percent of the popula-
tions of Pennsylvania and West Vir-
ginia. While southern states are
regarded as retirement magnets,
states in the Northeast and Midwest
have among the largest proportional
share of the elderly.
The differences in states’ age
profiles are determined primarily by
fertility and migration—mortality is
fairly uniform among states. States
with relatively high fertility rates,
such as Utah, tend to have a
younger age profile: A smaller pro-
portion of state residents are age 65
or older. Migration, both internal
and international, has a large impact
on the elderly population’s distribu-
tion. States in the Midwest and
Northeast have seen steady outflows
of younger people looking for job
opportunities. As these younger peo-
ple move south and west, the older
population is left to “age in place.”
Table 2
States Ranked by Percent Age 65 or Older, 2000
Total resident Population Percent
population age 65+ of population
Rank State (thousands) (thousands) age 65+
1 Florida 15,982 2,808 17.6
2 Pennsylvania 12,281 1,919 15.6
3 West Virginia 1,808 277 15.3
4 Iowa 2,926 436 14.9
5 North Dakota 642 94 14.7
6 Rhode Island 1,048 152 14.5
7 Maine 1,275 183 14.4
8 South Dakota 755 108 14.3
9 Arkansas 2,673 374 14.0
10 Connecticut 3,406 470 13.8
11 Nebraska 1,711 232 13.6
12 Massachusetts 6,349 860 13.5
13 Missouri 5,595 755 13.5
14 Montana 902 121 13.4
15 Ohio 11,353 1,508 13.3
16 Hawaii 1,212 161 13.3
17 Kansas 2,688 356 13.3
18 New Jersey 8,414 1,113 13.2
19 Oklahoma 3,451 456 13.2
20 Wisconsin 5,364 703 13.1
21 Alabama 4,447 580 13.0
22 Arizona 5,131 668 13.0
23 Delaware 784 102 13.0
24 New York 18,976 2,448 12.9
25 Oregon 3,421 438 12.8
26 Vermont 609 78 12.7
27 Kentucky 4,042 505 12.5
28 Indiana 6,080 753 12.4
29 Tennessee 5,689 703 12.4
30 Michigan 9,938 1,219 12.3
31 District of Columbia 572 70 12.2
32 South Carolina 4,012 485 12.1
33 Minnesota 4,919 594 12.1
34 Illinois 12,419 1,500 12.1
35 Mississippi 2,845 344 12.1
36 North Carolina 8,049 969 12.0
37 New Hampshire 1,236 148 12.0
38 Wyoming 494 58 11.7
39 New Mexico 1,819 212 11.7
40 Louisiana 4,469 517 11.6
41 Maryland 5,296 599 11.3
42 Idaho 1,294 146 11.3
43 Washington 5,894 662 11.2
44 Virginia 7,079 792 11.2
45 Nevada 1,998 219 11.0
46 California 33,872 3,596 10.6
47 Texas 20,852 2,073 9.9
48 Colorado 4,301 416 9.7
49 Georgia 8,186 785 9.6
50 Utah 2,233 190 8.5
51 Alaska 627 36 5.7
Source: U.S. Census Bureau, Demographic Profiles: Census 2000 (www.census.gov/
Press-Release/www/2001/demoprofile.htm, accessed Sept. 19, 2001).
California has been a traditional des-
tination for state-to-state and inter-
national migrants, which has kept its
population relatively young. States
that have attracted older retirees,
Florida in particular, have greater
proportions of older residents.
Health and
Functioning
Life expectancy at birth is the aver-
age number of years a group of peo-
ple born in a given year can expect
to live, and it has increased dramati-
cally in the United States since the
beginning of the 20th century (see
Table 3). Life expectancy at birth
rose from 47.3 years in 1900 to 68.2
years in 1950, and 76.9 years in 2000,
a gain of nearly 30 years over the
century. The impressive gains in life
expectancy early in the century were
brought about by dramatic reduc-
tions in infant and childhood mortal-
ity. Improvements in public health,
more sanitary household practices,
and better medical care helped cut
infant mortality from about 100
deaths per 1,000 births to less than
30 deaths per 1,000 births between
1915 and 1950. As vaccinations
against major childhood diseases
became widely available, mortality of
older children fell as well.
3
After the dramatic improvements
of the early 1900s, there was relatively
little room for further improvements
in mortality at the youngest ages by
the end of the 20th century. By 1990,
the infant mortality rate was below 10,
meaning that 99 percent of infants
survived their first year of life. Child
mortality was also extremely low. Fur-
ther improvement in the life
expectancy would depend on reduc-
tions in adult mortality.
The number of years of life gained
by extending life at older ages is rela-
tively small. The expected number of
remaining years of life for those who
survive to age 65 was 11.9 years in
1900. This increased to 13.9 years in
1950, and 17.9 years in 2000. This
means that, on average, someone
reaching age 65 in 2000 could expect
to live six years longer than a person
age 65 at the beginning of the 20th
century. Only about one-half of Amer-
icans born in 1900 were expected to
live to age 60, however, while nearly
90 percent of those born in 2000 are
likely to live to age 60.
4
The gap between male and female
life expectancy hovered between
two and three years throughout
much of the early 20th century. After
1940, however, improvements in
male mortality stalled and women’s
life expectancy began to rise faster
than that of men; the gender gap
expanded to about seven years in the
1970s and 1980s. But the gap appears
to be narrowing again in the early
21st century. In 2000, life expectancy
at birth was 79.5 years for women and
74.1 years for men.
The female advantage in survival
drops off at the oldest ages. It was
only about one year at age 85 and
less than one-half year at age 95 in
2000. Because the gap is already nar-
row at the oldest ages, further reduc-
tions in the gender gap in life
expectancy at birth are likely to result
from improved male survival at
younger ages.
10
American women who reach age 65 can
expect to live another 19 years, American men
another 16 years. This gender gap diminishes
at the oldest ages.
Photo removed for
copyright reasons.
Racial and Ethnic
Mortality Gap
At most ages, the mortality rates for
blacks are higher than those for
whites—and life expectancy at birth is
lower for blacks than for whites. Life
expectancy for white women exceeds
that of black women by about five
years in 2000. The difference is about
seven years among white and black
men. These differences narrow at old
ages, however, so that the black-white
difference in life expectancy at age 65
is about 1.7 years, and it falls to zero at
age 85. This narrowing results in part
from a “crossover” in the mortality
rates for blacks and whites at very old
ages: The death rates of elderly blacks
fall below those of elderly whites at
advanced ages. At ages 90 and older,
black men and women have slightly
more years of additional life expected
than do their white counterparts.
5
The crossover phenomenon has
been widely discussed by demogra-
phers, with two conflicting conclusions.
One view holds that the mortality rates
of the very old are inaccurate. Many
people born in the late 1800s and early
1900s did not have birth records, and
there is no way to verify their ages.
Many very old people tend to overstate
their age. If ages are overstated in both
population and death records, then
death rates are skewed downward for
the older age groups.
6
Another explanation for the
crossover in mortality for black Amer-
icans is that blacks who are still alive
at older ages are the hearty survivors
of extraordinary mortality risks at
younger ages. Because older whites
were not exposed to the same mortal-
ity risks, they are more frail than
blacks of the same age. This “hetero-
geneity of frailty” explanation is
thought to be a combination of social
and biological selectivity. If one sub-
group in the population is subjected
to harsher conditions in early life,
they will experience higher mortality
at young and middle ages. As a result
a smaller, but more select, group will
survive beyond those ages. This group
may be genetically endowed to have a
longer life span.
7
Understanding the reasons for the
crossover in mortality rates for blacks
and whites at older ages may provide
information about the future prospects
for increased life expectancy for
other groups within the population.
Researchers are studying what the
death rates at the oldest ages might
express about mortality throughout life,
and what the various causes of higher
black mortality are at younger ages.
Researchers also look at other
countries that have already achieved
higher life expectancies than the
United States. Japanese women have
the highest life expectancy in the
world: an average of 84 years in 2000.
8
Other industrialized countries are
quickly approaching this level.
Female life expectancy is 80 years or
more throughout northern and west-
ern Europe. Iceland had the highest
male life expectancy in 2000, at 78
years; male life expectancy is 77 years
in Japan. These international exam-
ples help define the prospects for
future life expectancy gains in the
United States.
Realistic estimates of future life
expectancy are important for many
reasons. The Census Bureau relies on
assumptions about future life
expectancy to project the size and
composition of the U.S. population.
These projections are used for plan-
ning a wide variety of government
programs. The Social Security Adminis-
tration has a strong interest in knowing
whether life expectancy will improve,
decline, or remain stable because
mortality trends will determine the
number of future beneficiaries in the
11
Table 3
Life Expectancy at Birth and at Age 65 in Years,
by Sex, 1900, 1950, and 2000
At birth At age 65
Total Male Female Total Male Female
1900 47.3 46.3 48.3 11.9 11.5 12.2
1950 68.2 65.6 71.1 13.9 12.8 15.0
2000 76.9 74.1 79.5 17.9 16.3 19.2
Sources: National Center for Health Statistics, Health, United States, 2000 (2001): table
28; and A.M. Minino and B.L. Smith, National Vital Statistics Reports 49, no. 12 (2001):
table 6.
Social Security system. Insurance com-
panies use life expectancy estimates to
determine premium levels and the
rates at which benefits are paid out.
While current estimates of life
expectancy are based on death rates
observed in the population, projec-
tions of life expectancy are calculated
by applying mathematical formulas to
past patterns of mortality. Projecting
life expectancy becomes more com-
plex as analysts attempt to foresee
changes in mortality by race, ethnic-
ity, and gender. The most recent pro-
jections by the Census Bureau
assume that mortality gaps between
racial and ethnic groups will narrow.
They also assume a slight narrowing
of the gender gap in mortality over
the next 100 years.
Because of the uncertainty inher-
ent in these forecasts, most projec-
tions include a series of estimates
using different assumptions about
future patterns and rates of change.
The Census Bureau, for example,
publishes population projections
using low, middle, and high assump-
tions of future life expectancy (in
combination with assumptions about
fertility and immigration trends).
From a starting life expectancy of 74.0
years for men in 1999, their low series
projects a life expectancy of 79.5 years
in 2050 and 85.0 years in 2100. The
high series, in contrast, projects a
male life expectancy of 83.8 years in
2050, and 92.3 years in 2100. Similar
differences are seen for women. Start-
ing from a life expectancy of 79.7
years in 1999, the Census Bureau pro-
jects a life expectancy of 84.9 years in
2050 and 89.3 years in 2100 in their
lowest series, compared with 88.4
years and 95.2 years for the same time
periods in the highest series.
Many scientists believe that the
maximum average human life
expectancy for a population is around
85 years, and that the maximum
human life span for humans is around
120 years—but both of these assump-
tions are widely debated.
9
Studies of
humans and other animals indicate
that individuals within an age group
tend to die off at increasing rates as
the group ages. The risk of dying over
the next year is greater for a 60-year-
old than for a 55-year-old, for example,
and the risk accelerates sharply after
age 60. But scientists have discovered
that this relationship changes at very
old ages among humans and other
animals. The rise in death rates decel-
erates; that is, while death rates con-
tinue to increase, the rate of that
increase slows. Several theories have
purported to explain this intriguing
finding. One points to the effects of
decreased population density as older
members die off (particularly among
animals studied in laboratory condi-
tions) and another focuses on the
greater diversity among the population
that survives to the oldest ages. Nei-
ther of these explanations is sufficient
to account for the mortality slowdown
among the very old. Studies of animals
raised individually still show a mortal-
ity deceleration in the oldest ages,
which contradicts the theory that the
slowdown in mortality reflects the
health benefits of lower population
density as a group loses more and
more members. While a population
might become more diverse as more
members die off, researchers have con-
cluded that this could not account for
the slower increase in death rates. The
phenomenon appears to occur at the
individual level, and it may involve
behavioral and physiological changes
in individuals as they age.
10
Mathematical models of longevity
and survival allow for the possibility
that the maximum life span could be
much greater than the commonly
assumed limit of 120 years. Studies in
animal models show that the maxi-
mum life span of a population can be
extended in a number of ways. Indi-
vidual cases of superlongevity have
been documented. The most notable
was Jeanne Calment of France, who
died in 1997 at the age of 122. The
longest-lived man is considered to be
Shigechiyo Izumi, who died in 1986 at
the age of 120. As the number of
supercentenarians increases, there is
increasing doubt that the maximum
age for humans stops at 120 years
(see Box 1 on page 14).
12
There is
increasing
doubt that
the maximum
life span is
120 years.
Causes of Death
The increasing life expectancy of the
population is related to a marked shift
in the leading causes of death. In 1900,
tuberculosis, pneumonia, diarrhea and
enteritis, and heart disease were the
top causes of death in the United
States. These four causes accounted for
more than one-third of all deaths. At
the end of the 20th century, heart dis-
eases, cancer, stroke (cerebrovascular
diseases), and lung diseases were the
leading causes of death. They account-
ed for more than one-half of all deaths
among Americans in 2000. This shift to
chronic diseases associated with aging
from infectious diseases that especially
affect infants and young children
reflects the epidemiologic transition
that occurred in industrialized coun-
tries with improved sanitation, personal
hygiene, and housing.
11
Mortality from
diseases such as tuberculosis, pneumo-
nia, influenza, and diarrheal diseases
diminished as living conditions
improved. Their decline was further
hastened by advancements in medical
care and the development of antibi-
otics in the 1930s. The elimination or
control of infectious diseases increased
life expectancy, but it also left people at
greater risk of death from chronic and
degenerative diseases related to aging.
The six leading causes of death for
people age 65 or over in 2000 were
heart diseases, cancer, stroke, chronic
obstructive pulmonary disease, pneu-
monia and influenza, and diabetes
(see Table 4). Heart diseases caused
approximately 33 percent of all deaths
among those age 65 or older. Nearly
600,000 older Americans died from
heart diseases in 2000. Cancer
accounted for 22 percent of the deaths
to the elderly, and cerebrovascular dis-
eases (which cause strokes) claimed
another 8 percent.
In the 1980s and 1990s, deaths from
heart disease and stroke declined
steadily. These declines were most
notable among those ages 65 to 74 and
for whites in all age groups.
12
The lower
mortality from heart disease is often
attributed to such lifestyle changes as
lower-fat diets, more exercise, smoking
cessation, and control of high blood
pressure.
13
Advances in treatment and
prevention could lead to further
declines. New treatments for heart dis-
ease, including aspirin therapy, more
effective surgical procedures, and bet-
ter emergency care, could reduce, or at
least delay, deaths from heart disease.
The risk factors for heart disease are
well-known and many Americans are
adopting healthier lifestyles that will
reduce their risk. But some population
groups maintain lifestyles that increase
their risk of heart disease. Obesity, for
example, has increased among all
population groups. It is especially high
among blacks and Hispanics, and
among Americans with a high school
education or less.
14
Increased smoking
rates among teens, especially among
young women, could undermine the
reduction in deaths from heart disease
as well as other health gains.
Cancer is the second-ranked cause
of death for elderly Americans, and it
is the leading cause of death for women
ages 65 to 74. Death rates from can-
cer are higher for blacks than for
whites, particularly among men.
Much of the recent decline in can-
cer death rates among men is attribut-
able to a drop in lung cancer deaths as
smoking rates declined among adult
13
Table 4
Leading Causes of Death for
Americans Age 65 or Older, 2000
Percent of deaths,
Cause of death persons 65+
All causes 100
Heart diseases 33
Cancer 22
Stroke 8
COPD* 6
Pneumonia, Influenza 3
Diabetes 3
Alzheimer’s disease 3
Kidney diseases 2
Accidents 2
Septicemia 1
Other causes 17
*COPD = Chronic obstructive pulmonary diseases, which
include bronchitis, emphysema, asthma, and other chronic
respiratory diseases.
Source: A.M. Minino and B.L. Smith, National Vital
Statistics Reports 49, no. 12 (2001): table 7.
14
men.
15
The lag between starting to
smoke and the development of lung
cancer means that the death rates
reflect behavior 20 to 30 years earlier.
Lung cancer emerged as a leading
cause of death for women in the
1970s, reflecting the rapid rise in
smoking among women in the 1930s
and 1940s. By 1990, lung cancer had
eclipsed breast cancer as the leading
cause of cancer deaths among U.S.
women, and lung cancer mortality
rates continued to increase among
women at least until 2000.
16
Diabetes was the sixth-ranked cause
of death among Americans age 65 or
older in 2000. It was the third leading
cause of death among American Indi-
ans and the fourth leading cause
among black elderly. The National
Reaching age 100 has long fascinated
society. The century mark holds an
almost mystical importance as a seal of
hardiness and good health—the sign of
a life well-lived. People who reach 100
are regularly feted in newspaper stories,
television broadcasts, and family parties.
Some get birthday greetings from the
White House. As life expectancy
increases, an increasing number of
Americans are attaining this milestone.
Centenarians have a unique perspec-
tive on our recent history. Americans
who reached age 100 in 2000 were born
at the dawn of the 20th century. They
were too young to participate in World
War I and reached adulthood as the
world was gripped by the 1918 influenza
epidemic. This group was forming its
families as the Great Depression started
and had some of the highest rates of
childlessness recorded in the United
States. The advent of World War II
found many of them too old to be
called into service, but they were a vital
force in stateside war efforts. Today’s
centenarians reached retirement age as
the United States entered the Vietnam
War and social turmoil of the 1960s and
1970s. They witnessed remarkable and
unprecedented technological and med-
ical advances in their lifetimes.
Centenarians may hold the key to the
limits of life and are a new and fascinat-
ing focus for medical and social
research. Researchers are examining
their physical and mental health, their
genes, their families, and their lifestyles,
trying to unlock the secrets of long life.
The growth in the number of cente-
narians in the world is remarkable. Accu-
rate records are difficult to come by
before the 20th century, although there
have been claims of super longevity
throughout history, such as the story of
969-year-old Methuselah in the Bible.
Other examples of supercentenarian sta-
tus are found in age claims of 122 years
for St. Patrick of Ireland, 152 years for
Englishman Thomas Parr (1483-1635),
and groups of individuals in Bulgaria,
Kashmir, and the Andes. Rigorous inves-
tigation of these claims, however, finds
no evidence to support them. Some spec-
ulate that before 1900 the incidence of
centenarians may have been as small as
one per century. In small countries, like
Denmark, researchers find little evidence
of centenarians before the 19th century.
1
Given the rarity of living to age 100, it is
possible that few populations were large
enough until recently to produce any
centenarians.
Verification of age is very difficult,
even today. Many centenarians do not
have birth records or other documents
to confirm their stated age. Verification
of age entails collecting credible and cor-
roborating evidence from a variety of
sources, including interviews with the
person when possible. Reported life
events are checked for consistency with
historical records and documents. Verifi-
cation becomes more difficult the older
the individual and after his or her death.
The oldest known age ever attained
was by Jeanne Calment, a Frenchwoman
who died in 1997 at the age of 122. Ms.
Calment is also the only documented
case of a person living past 120, which
many scientists had pegged as the upper
limit of the human lifespan. In 2001, the
oldest living woman appears to be 114-
year-old Maud Farris Luce of the United
States, born in 1887. The oldest docu-
mented age for a man is believed to be a
Box 1
Centenarians
15
Institute of Diabetes and Digestive and
Kidney Diseases uses the term “epidemic”
to refer to the rates of noninsulin-
dependent diabetes in the American
Indian population.
17
Much of the
increase is attributed to changes in
traditional lifestyles that have resulted
in higher body weights and decreased
physical activity among American
Indians. In addition to the deaths
attributed directly to diabetes on death
certificates, diabetes is a likely con-
tributing factor in many more deaths,
particularly from heart disease.
Health Status
Most older Americans report their
health to be at least “good.” Such self-
ratings of health status have proved to
Danish immigrant to the United States,
Christian Mortensen, who died in 1998
at age 115. One man, Shigechiyo Izumi,
is often reported as having reached the
age of 120 before his death in 1986 in
Japan, but his age has not been verified.
Antonio Todde of Italy, born in 1889
and reaching age 112 in 2001, is
believed to be the oldest living man, fol-
lowed closely by two other men born
later the same year.
Some 50,000 Americans were
reported as centenarians in the 2000
U.S. Census. Centenarians account for
less than 0.2 percent of the 35 million
persons age 65 or older, and there is
wide agreement that this is an overesti-
mate because of chronic overreporting
at the oldest ages.
2
Reliable counts for
1990 by the Social Security Administra-
tion, for example, put the number of
centenarians as closer to 28,000 than the
37,000 reported in the 1990 Census.
As at all other older ages, women cen-
tenarians outnumber men. The 2000
Census recorded four women for every
man age 100 or older. Detailed informa-
tion on centenarians from the 1990 Cen-
sus reveal that their racial composition is
similar to that for all older Americans—
78 percent of centenarians were non-His-
panic white and 16 percent were black.
But centenarians have lower levels of edu-
cation than other elderly Americans,
which is not surprising for Americans
born before 1900. And women age 100
or older are more likely than men to be
widowed. Only about 4 percent of female
centenarians counted in 1990 were cur-
rently married, compared with nearly 25
percent of the men age 100 or older.
Centenarians are not necessarily in
poor health or suffering from chronic
disabilities. About 20 percent of the
centenarians in the 1990 Census
reported no disabilities, although they
reported considerably more health
problems than people in their 80s.
3
What accounts for extreme longevity?
It is likely that a combination of genetics,
lifestyle, and luck
4
are responsible for a
long life. As public health measures
advanced early in the 20th century,
cleaner water, vaccination campaigns,
and better personal hygiene allowed
more people to live to older ages. More
recently, treatments for heart disease,
cancer, and other chronic diseases have
extended life at the upper extremes. A
wide-ranging study of the genetic, physi-
cal, mental, and emotional characteristics
of centenarians by Harvard University’s
Thomas Perls suggests that genetic fac-
tors play a large role in longevity,
although Perls also acknowledges the
importance of lifestyle and attitude.
5
References
1. Bernard Jeune, “In Search of the First
Centenarians,” in Exceptional Longevity:
From Prehistory to the Present, ed. B. Jeune
and J.W. Vaupel (Odense, Denmark:
Odense University Press, 1995).
2. Constance A. Krach and Victoria A.
Velkoff, “Centenarians in the United
States,” Current Population Reports P23-
199RV (Washington, DC: U.S. Government
Printing Office, 1999).
3. Ibid.
4. “Luck” at avoiding fatal injuries or expo-
sure to deadly contagious diseases, for
example.
5. Thomas T. Perls and Margery Hutter Sil-
ver, Living to 100 (New York: Basic Books,
1999); and Jeune, “In Search of the First
Centenarians.”
16
be good indicators of current overall
emotional and physical health.
18
In a
survey conducted in the mid-1990s,
72 percent of respondents age 65 or
older said their health was good, very
good, or excellent when asked to rate
their health on a five-point scale that
ranged from poor to excellent.
19
The
proportion of elderly who report
poor health increases with age. Even
among those age 85 or older, however,
a majority considered their health to
be at least “good” in the survey.
Reports of health status vary by the
race of the respondent. Non-Hispanic
black elderly report the poorest
health. Fifty-eight percent of blacks
age 65 or older reported their health
as good to excellent, compared with
65 percent of Hispanics and 74 per-
cent of non-Hispanic whites. The gen-
der gap in self-assessed health is
greater among minority racial and
ethnic groups. Hispanic and black
women age 85 or older were generally
in better health than Hispanic and
black men of the same age.
Racial disparities in health at
later ages are thought to result from
several lifelong processes. At
younger ages, minorities are less
likely to be covered by health insur-
ance or to have access to health serv-
ices; and they are more likely to live
in areas of pollution and toxins and
to have more hazardous and physi-
cally demanding jobs. In addition,
recent evidence points to the health
effects of stress caused by, for exam-
ple, discrimination and lack of
autonomy on the job, and other
emotional factors often experienced
by disadvantaged groups.
20
Chronic Diseases
Chronic diseases—long-term diseases
that are seldom cured but can often
be managed with medication and
lifestyle changes—often impair the
ability of older people to live inde-
pendent and active lives. While
chronic conditions occur at all ages,
older people are more likely to suf-
fer from these debilitating condi-
tions. These diseases have become
the primary focus of health and
health care in later life. Chronic
conditions often require more than
medical care, they also require sup-
port for emotional, social, and per-
sonal care for long periods of time.
As the older population increases,
the number of people with chronic
conditions is expected to increase
as well.
The seven most common chronic
health problems among those ages
70 or older are arthritis, hyperten-
sion, heart disease, diabetes, respira-
tory diseases, stroke, and cancer. Of
these, arthritis is by far the most com-
mon, affecting more than 60 percent
of women and nearly 50 percent of
men in the 70-and-older group. The
prevalence of arthritis increases with
age: More than 60 percent of people
age 85 or older reported problems
with arthritis. Arthritis is seldom fatal,
but it often severely limits physical
activity. Elderly Americans with
arthritis are less likely to report their
health as very good or excellent and
more likely to use health services
than those without arthritis.
21
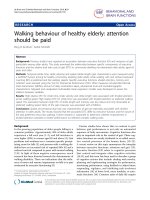
Rates of hypertension are particu-
larly high among elderly African
Americans. Nearly 60 percent of
non-Hispanic black elderly reported
problems with high blood pressure
in 1995 (see Figure 4). In contrast,
cancer rates are much higher among
the white population: More than 20
percent of older whites reported hav-
ing cancer, compared with 9 percent
of black and 11 percent of Hispanic
elderly. Some of this variation in
cancer risk may reflect differences in
diagnosis and treatment, but it also
stems from differences in health
behaviors, diet, levels of stress, and
other environmental factors.
Diabetes among the older popula-
tion, particularly blacks and Hispan-
ics, is of growing concern among
health care professionals. In 1995,
20 percent of black elderly suffered
from diabetes, compared with 11 per-
cent of non-Hispanic whites. In addi-
tion, blacks are more likely than
whites to suffer complications from
diabetes, including eye problems,
kidney failure, and amputations.
22
Most older
Americans
report their
health as
‘good’
or better.
17
Diabetes in the elderly, generally Type
2 (noninsulin-dependent) diabetes, is
related to genetics as well as to diet
and other lifestyle factors. The grow-
ing levels of obesity in some popula-
tion groups contribute to the
increased prevalence of diabetes, but
do not account for all the differences
among groups.
Trends in the prevalence of
chronic disease are important indica-
tors of future health care needs. Most
of the increase in life expectancy at
older ages results from earlier diagno-
sis and better treatment of life-threat-
ening diseases, which allow people to
live longer after the onset of a dis-
ease. As people live longer, the num-
ber of people reporting the presence
of a chronic disease increases. Better
treatment of heart disease, for
instance, means that an individual
may live long enough to develop
other age-related problems such as
arthritis and Alzheimer’s disease (see
Box 2 on page 18). Comparisons of
disease reports between 1984 and
1995 reveal higher proportions of
those age 70 or older reporting that
they suffer from all of the major
chronic diseases associated with age.
23
As mortality declines at older ages, it
will become increasingly important to
manage and treat debilitating condi-
tions that limit functioning and activ-
ity in later life.
Limitations
Some older people find that chronic
illness or disability undermines the
quality of their lives and limits their
ability to live independently. The lim-
itations in the “activities of daily liv-
ing,” or ADLs, often determine the
extent and type of care older people
need. These daily activities commonly
include eating, dressing, walking,
bathing, going outside, using the toi-
let, and transferring from a bed to a
chair. For each activity, individuals
are usually rated as having no diffi-
culty, some difficulty, or as unable to
perform the task. Elderly individuals
are often eligible for health or per-
sonal-care assistance if they have diffi-
culty with two or more ADLs. An
Stroke
Diabetes
Cancer
Heart disease
Hypertension
Arthritis
54%
64%
44%
45%
19%
8%
13%
25%
19%
18%
7%
13%
Stroke
Diabetes
Cancer
Heart disease
Hypertension
Arthritis
58%
67%
44%
42%
50%
59%
22%
9%
1
1
%
17%
12%
10%
19%
9%
1
1
%
21%
20%
17%
Age group
Race/ethnic group
Hispanic
White
African American
Age 70–74
Age 85+
Figure 4
Chronic Health Conditions Among Americans Age 70
or Older, by Race and Selected Age Group, 1995
Note: Whites and African Americans are non-Hispanic. Hispanics may be of any race.
Source: Federal Interagency Forum on Aging-Related Statistics, Older Americans 2000:
Key Indicators of Well-Being (2000): table 14.
18
inability to feed oneself and prob-
lems with toileting are most likely to
lead to institutionalization.
ADL limitation measurements,
however, do not capture the true need
for services in the elderly community.
Cognitive impairments, for example,
may not be reflected in ADL limita-
tion counts, yet people with cognitive
impairments often are unable to think
logically, perform simple math, or fol-
low directions, and they often require
help with everyday tasks. ADL limita-
tions are not always measured the
same way in different surveys and data
collection methods and they are not
always comparable. The way in which
the question about difficulties is
asked, the person who gives the assess-
ment (the elderly person or a proxy),
and the scope of the survey popula-
tion (all elderly or only those who do
not live in institutions) can affect esti-
mates of the levels of difficulty.
24
Alzheimer’s disease (AD) is a progres-
sive brain disorder that results in
memory loss, behavior changes, and a
decline in cognitive abilities. It is the
most common cause of dementia in the
older population. An estimated 4 mil-
lion Americans suffer from the disease;
most are elderly. More than 350,000
new cases are diagnosed each year; this
number is expected to increase as the
size of the older population increases.
1
The disease usually has a gradual
onset characterized by forgetfulness,
but eventually produces increasingly
severe and irreversible disability. The
average length of life after diagnosis is
eight to 10 years, although some indi-
viduals live with the disease for 20 or
more years. The cause of AD is not
known, but researchers believe it may
involve a complex set of changes includ-
ing genetics, oxidative damage,
2
inflam-
mation, and stroke. There are two
identifiable types of AD: familial and
sporadic. Familial AD, which is inher-
ited, accounts for only about 10 percent
of cases. It occurs at much earlier ages,
generally affecting people ages 30 to 60,
and it tends to progress more rapidly
than sporadic AD, which is not inher-
ited and has a much later onset.
Although the risk of developing
Alzheimer’s disease increases with age
and symptoms generally appear after
age 60, it is not considered a part of
normal aging. In early stages of the dis-
ease, individuals may forget names of
familiar people and objects, think less
clearly, and show small changes in per-
sonality. As the disease progresses, peo-
ple with AD forget how to perform sim-
ple tasks such as dressing and bathing.
Individuals in the late stages of AD are
prone to infections and illnesses and
require intensive care either at home or
in an institutional setting. The disease
eventually leaves people bedridden and
unable to care for themselves.
While it has been recognized as a
cause of death for decades, Alzheimer’s
disease gained acceptance as a direct or
contributing cause of death only in the
1980s, reflecting better diagnosis, an
increased willingness to acknowledge the
disease, and wider recognition that the
disease itself caused death. Through the
1980s, the number of deaths attributed
to AD increased rapidly because of this
heightened awareness among medical
practitioners. Over the last several years
the death rate for AD has remained rela-
tively constant. In 2000, it ranked as the
seventh most common cause of death
for Americans age 65 or older.
3
Clinicians use several tools to diag-
nose AD in a patient. Brain scans, assess-
ments of memory, language skills, and
other measures of brain functioning, and
a physical exam can rule out other causes
of memory difficulties and confirm a
probable diagnosis of AD. A conclusive
diagnosis of AD, however, can only be
made by brain autopsy after death. Ear-
lier diagnosis of AD can help physicians
manage the symptoms and help families
and patients plan future care options.
Early diagnosis can also allow AD patients
to participate in decisionmaking about
their futures and use adaptive strategies
for maintaining independence.
Box 2
Alzheimer’s Disease
19
In the 1990s, about 17 percent of
persons age 65 or older had some limi-
tation in at least one ADL or were liv-
ing in an institution (implying they
were limited in two or more ADLs).
25
The most common limitation among
those living in the community (not in
a nursing home or other institution)
was the ability to get outside, followed
by problems with walking and bathing.
The ability to eat independently is the
least common ADL difficulty among
the 65-or-older population in the com-
munity: Less than 2 percent of com-
munity-dwelling elderly reported
problems with eating in the 1990s.
The extent of limitations increases
substantially with age. In a 1991 survey,
about 35 percent of the 85-or-older
population living in the community
reported some difficulty in walking
across a room alone, compared with
just 9 percent of those ages 65 to 74.
26
Even among the oldest-old, however,
There is no cure for AD. Research
is focused on slowing its progression
and preventing its occurrence. Two
new drugs improve the cognitive func-
tioning of AD patients by inhibiting a
key enzyme in brain function. These
drugs appear to be effective for some
in the early stages of the disease, but
do not halt the progression of the
disease. Management of the disease
focuses mainly on controlling some
troubling AD symptoms, including ver-
bal and physical aggression, agitation,
depression, and wandering.
In contrast to many other chronic
disease conditions, Alzheimer’s disease
is not associated with income or eco-
nomic status. Women are more likely to
suffer from AD than are men, but this
primarily reflects their longer life
expectancy. Elderly Americans with
Alzheimer’s are more likely than other
elderly to be in poor physical health.
About 66 percent of the elderly popula-
tion with AD report health status as fair
or poor, compared with 27 percent of
the general elderly population. Those
with AD and other dementias are likely
to have other chronic and acute health
problems as well. Many suffer from
pneumonia, coronary artery disease,
and osteoarthritis.
AD exacts a devastating toll on indi-
viduals and society. The annual cost of
caring for those with AD is close to $50
billion, including the costs of treat-
ment, care, and lost wages by patients
and family caregivers. While providing
care to any elderly family member can
be difficult and stressful, it is especially
difficult for people caring for an eld-
erly person with dementia. Dementia
caregivers spend more hours per week
in care activities and provide assistance
with more activities than do nonde-
mentia caregivers.
4
They are more
likely to miss work, change to part-time
work, turn down promotions, and
choose early retirement than people
who care for other (nondementia) eld-
erly. The stress of caring for a demen-
tia sufferer—who may develop
behavior problems and may not recog-
nize his or her caregiver—leads to
higher rates of physical and mental
problems among caregivers.
References
1. Ron Brookmeyer, Sarah Gray, and Clau-
dia Kawas, “Projections of Alzheimer’s
Disease in the United States and the Pub-
lic Health Impact of Delaying Disease
Onset,” American Journal of Public Health
88, no. 9 (1998): 1337-42.
2. Cell damage related to aging. See
“Can Antioxidants Prevent Cell Damage,
Disease and Aging?” accessed online at:
www.infoaging.org/b-oxdam-home.html,
on Oct. 31, 2001.
3. Donna L. Hoyert and Harry M. Rosenberg,
“Mortality from Alzheimer’s Disease: An
Update,” National Vital Statistics Reports 47,
no. 19 (Hyattsville, MD: National Center
for Health Statistics, 1999).
4. Marcia G. Ory, Richard R. Hoffman III, Jen-
nifer L. Yee, Sharon Tennstedt, and Richard
Schulz, “Prevalence and Impact of Caregiv-
ing: A Detailed Comparison Between
Dementia and Nondementia Caregivers,”
The Gerontologist 39, no. 2 (1999): 177-86.
20
difficulties in eating and toileting are
the least common ADL limitations for
those living in the community.
In addition to ADLs, researchers
may rate how well elderly Americans
can perform complex tasks known as
“instrumental activities of daily living”
(IADLs), which are necessary for
older persons to live successfully on
their own. IADLs include preparing a
meal, shopping for personal items,
managing money, using the tele-
phone, and doing light housework.
Even though the number of older
Americans has increased and there
are more elderly people in the oldest
age groups, the percent of older
Americans reporting difficulty with
these complex tasks has declined
considerably over the past 20 years.
In 1999, about 3 percent of elderly
reported difficulty with IADLs, com-
pared with about 6 percent of elderly
in 1982. While difficulties with IADLs
are viewed as less serious than limita-
tions in ADLs, they can indicate the
ability of a person to live independ-
ently and signal problems in cogni-
tive functioning.
While the prevalence of chronic
diseases is increasing in the older
population, recent studies confirm
that rates of chronic disability are
declining and that these declines are
most rapid in the oldest age group,
people age 85 or older. Between 1982
and 1999, the prevalence of chronic
disability, defined as difficulty with
any IADL or ADL, declined from 26
percent to less than 20 percent. Part
of this change may reflect increasing
levels of education and new product
and environmental designs that
enable individuals to perform fairly
complex tasks despite minor impair-
ments. Improvements in the manage-
ment and treatment of underlying
chronic diseases probably also
reduced chronic disability.
The decline in chronic disability
among elderly Americans is a hopeful
sign that more people now entering
retirement age will be able to live
independently. This trend also eases
the concern that, although people
were living longer lives, the years
gained were plagued by increasing
disability.
27
Now, increases in life
expectancy are more likely to be years
of healthy life. As mortality rates con-
tinue to fall and elderly people live
longer lives, understanding the rela-
tionship between these years of long
life and disability will become increas-
ingly important.
28
Family Roles
The study of aging and older persons
is inevitably tied to the study of fami-
lies. Aging affects the roles that older
individuals play in their families and
the roles that families play in the lives
of their older relatives. Families are a
source of support and affection, and
they provide links to culture and her-
itage. But families are not static units.
They change in form and function;
their role in society evolves. The
increasing participation of women in
the paid work force, the postpone-
ment of marriage, the greater preva-
lence of divorce, and the increase in
childbearing outside of marriage all
have affected families.
Increasing life expectancy has
brought two major changes in family
structure and function. First, more
generations are alive at any one time,
which increases the size and breadth
Longer life expectancies mean that more American families will include
older relatives for more years. Older family members can enrich family life,
but they also require care and support.
Photo removed for
copyright reasons.
21
of families.
29
Second, the longer aver-
age life expectancy has increased the
length of time families are likely to
include a family member with an age-
related disability. It is too soon to
know how these changes will affect
American family life. Much will
depend on trends in disability among
older Americans: the proportion of
later life spent with a disability, the
number of years an older person may
need assistance with daily activities,
and the age at which that assistance is
needed. Because family members have
traditionally provided care to elderly
relatives, the need to care for frail
family members who live to advanced
ages may place a greater strain on
family members, especially when adult
children, nieces, or nephews are
themselves beginning to suffer from
age-related impairments. If, however,
longer lives yield more years of good
health, as recent trends suggest, older
Americans may be able to play an
active role in their families until very
old ages.
Fertility trends of the past century
influence not only the size and shape
of the older population, but of their
families as well. Two trends especially
important for the family relationships
of older people are the proportion of
women who remain childless and the
age at which other women have chil-
dren. An unusually high percentage
of women who were in their child-
bearing ages in the 1930s never had
any children. These same women
entered older ages in the 1970s with-
out adult children to provide social,
emotional, and financial support.
In contrast, American women in
their childbearing ages during the
1950s had very low rates of childless-
ness. A much greater proportion of
these women had at least one living
child when they reached their 60s
and 70s.
30
Many women in their
childbearing ages in the 1970s and
later delayed having children until
their late 20s and 30s. These women
who had children later in life are
more likely to need to provide care
for dependent children and a parent
simultaneously.
Early childbearing carries its own
costs to family life. Another group of
women have children at very young
ages—which can also affect the family
roles of older parents and grandpar-
ents. Young parents, often single
mothers, frequently need more assis-
tance than parents who bear their
children later. These young parents
often turn to their own parents as the
primary resource for financial and
emotional assistance. The importance
of grandparents in providing care
and support for grandchildren is
receiving increasing attention from
researchers, and prompted the addi-
tion of a special question about
grandparenting on the 2000 Census.
31
Marriage and marital dissolution
also affect the structure of families
and the lives of older Americans.
Marriage continues to be the norm
for family formation in the United
States. This was particularly true for
people now age 65 or older. More
than 95 percent of older Americans
have been married. Marriage is
important for older Americans for
several reasons. The presence of a
spouse provides a variety of resources
in the household. Married elderly are
less likely to be poor, to enter a nurs-
ing home, or to be in poor health.
Spouses are the primary caregivers to
their partners.
Most men age 65 or older are mar-
ried, but most elderly women are not:
In 2001, about 75 percent of men
were currently married, compared
with 44 percent of women age 65 or
older (see Figure 5, page 22). But
women are likely to outlive their hus-
bands, and older women are less
likely than older men to remarry after
being widowed or divorced. Accord-
ingly, older women are more likely
than older men to be divorced or wid-
owed. At the oldest ages, both men
and women are less like to have a sur-
viving spouse, but the gender gap is
even wider: Thirteen percent of
women, compared with 53 percent of
men, age 85 or older were married in
2001. While the likelihood of having
experienced a divorce has increased
over time, only a small percentage of
Increases in
life expectancy
are likely to
be years of
healthy life.
22
Americans age 65 or older are
divorced: 7 percent in 2001.
Increasingly, American men and
women have put off marriage until
later ages, and many may not marry at
all. The median age of first marriage
increased from 22.5 years for men
and 20.1 for women in 1956 to 26.8
years for men and 25.1 years for
women in 2000.
32
As Americans wait
longer to get married, the proportion
who never marry is likely to increase.
While just 6 percent of women 30 to
34 years of age in 1970 had never
been married, for example, by 2000,
22 percent of women in their early
30s had never been married. Whether
this delay signals a permanent retreat
from marriage is still unclear, but it is
likely to affect the lives of these Amer-
icans when they enter older ages in
the 21st century.
Caregiving
Spouses and other family members
are important sources of support to
frail or disabled older adults. Those
without family support are more likely
to be institutionalized. Family mem-
bers provide a wide range of assis-
tance to their kin. They commonly
provide transportation to older peo-
ple who cannot drive or negotiate
public transit; they help with shop-
ping, cooking, and other household
chores. Increasingly, family members
are responsible for providing health
care as well. The trend toward more
outpatient treatments and proce-
dures, and earlier discharges from
hospitals, requires that a family mem-
ber be available for changing dress-
ings, administering medications, and
monitoring status. Families also assist
elderly relatives with personal care on
a day-to-day basis. Many family mem-
bers provide help with dressing, feed-
ing, bathing, and toileting activities.
This high level of care can be both
physically and mentally challenging
for family caregivers, especially when
the elderly relative has dementia.
Although many family members
may share caregiving tasks, most of
the family care provided to an older
person comes from a single primary
caregiver.
33
Caregivers are usually
close family members. If a spouse is
not available or is unable to provide
care, adult children are likely to
become the primary caregivers.
Increasingly, adult children are taking
on the role of caregiver. Recent
research has found that adult chil-
dren are more likely than a spouse to
be the primary caregivers for frail
individuals age 70 or older.
34
The source of family care varies
by the race and ethnicity of the family
(see Figure 6). Frail elderly in white
families are more likely to receive
care from a spouse than elderly in
black or Hispanic families. Black
elderly are more likely than others
to have an adult grandchild as a
caregiver—10 percent of the care
provided to black elderly age 70 or
older came from adult grandchildren
in 1993, compared with 4 percent
among whites and 6 percent among
Hispanics. Older blacks also are
more likely to rely on someone out-
side of the family for care. One-third
of blacks age 70 or older were receiv-
ing care from a nonrelative in 1993.
Adult children are more likely to be
primary caregivers for Hispanic
WomenMen
Married
44%
Widowed
45%
Married
75%
Widowed
15%
Divorced
7%
Divorced
7%
Never
Married
4%
Never
Married
4%
Figure 5
Marital Status of Men and Women Age 65 or Older,
2001
Note: Percentage may not add to 100 because of rounding. “Married” includes persons who remar-
ried after divorce or widowhood.
Source: PRB analysis of the March 2001 Current Population Survey.
23
elderly than for white or African
American elderly.
Geographic proximity, gender,
marital status, and the type of rela-
tionship a child has with his or her
parent all come into play when an
adult child assumes the caregiver role
for a frail parent. Adult daughters
tend to occupy this role more often
than sons; this is especially true the
more impaired the older person
becomes.
35
Some research suggests
that men tend to take on roles that
emphasize traditionally male tasks
such as financial management, home
repairs, and dealing with formal
organizations, while women are more
likely to be involved in traditionally
female direct care tasks, such as
bathing and feeding.
The willingness and availability of
family members to provide care for
elderly relatives has important implica-
tions for public policy and for individ-
ual lives in the future. Women are
traditional family caregivers, but
increasing percentages of women are
employed full time and do not have
the time to devote to eldercare. Adult
children often do not live near
enough to their parents to help them
with daily or weekly tasks. Only slightly
more than one-half of elderly people
with children have a child living within
10 miles.
36
Many analysts maintain,
however, that family members will con-
tinue to provide high levels of care to
elderly relatives, which will be crucial
to the well-being of older Americans.
37
Grandparenting
One of the most common family roles
associated with later life is becoming
a grandparent.
38
While grandparents
are associated with a popular image
of white hair and retirement, grand-
parenthood occurs relatively early for
most adults. The transition to grand-
parenthood occurs, on average,
before age 50, and it is earlier among
blacks and Hispanics than among
whites (see Table 5, page 24). By age
65, however, 84 percent of all men
and 80 percent of all women were
grandparents in 1993.
Spouse
28%
Adult
grand-
children
4%
Other
27%
Adult
children
41%
White
African American
Percent of population age 70+
Hispanic
Adult
children
42%
Adult
grand-
children
10%
Spouse
15%
Other
33%
Adult
children
52%
Adult
grand-
children
6%
Spouse
20%
Other
22%
Figure 6
Sources of Informal Care for
Frail Elderly Americans, by
Race, 1993
Note: Whites and African Americans include Hispanics. His-
panics may be of any race.
Source: National Academy on an Aging Society,
“Caregiving,” Challenges for the 21st Century: Chronic
and Disabling Conditions, no. 7 (2000).