Where Do Older Americans Live? Geographic Distribution of the Older Population potx
Bạn đang xem bản rút gọn của tài liệu. Xem và tải ngay bản đầy đủ của tài liệu tại đây (782.57 KB, 32 trang )
Order Code RL33897
Where Do Older Americans Live?
Geographic Distribution of the Older Population
March 5, 2007
Kirsten J. Colello
Analyst in Gerontology
Domestic Social Policy Division
Where Do Older Americans Live?
Geographic Distribution of the Older Population
Summary
The U.S. population age 65 and older grew steadily through most of the last
century. U.S. Census Bureau population projections to 2030 indicate that further
and more dramatic growth is still to come. This increase is, in part, due to longer life
expectancies and the aging of the baby boom generation. As the older population
continues to increase in size and proportion, and as individuals continue to live
longer post-retirement, changes in where older Americans live, or the “geographic
distribution” of the older population, will likely have broad policy implications for
federal, state, and local governments.
Older Americans are not unlike the rest of the U.S. population in that they live
in the most populous states (California, Florida, New York, and Texas). The
majority of the population age 65 and older lives within major metropolitan areas.
However, the older population accounts for a larger proportion of the total U.S.
population living in non-metropolitan or rural areas. Some experts have expressed
concern over the level of access older rural residents have to affordable housing and
transportation options, health and social services, and medical providers and
specialists.
Older Americans are less likely to move than the younger population, and of
those who do move, most move within the same county or state. Among those
moving to different states, the pattern has been to relocate from colder to warmer
climates, from larger metropolitan areas to smaller cities and towns, and from higher
to lower cost of living areas. Over the past few decades, migration patterns among
the older population have led to an increase in the 65-and-older population in some
states in the Southern and Western regions of the country. Other states in the
Midwest and Northeast have relatively high proportions of their resident population
age 65 and older, which is likely due to younger workers having left these regions
combined with a pattern of many older individuals remaining in these communities.
Population shifts affect important aging policy issues that concern both the
government and private sector, including social services, housing, health care, and
transportation. At the federal level, funds for federal programs, such as nutrition and
supportive services under the Older Americans Act (OAA) and the U.S. Department
of Housing and Urban Development (HUD) Section 202 housing program for the
elderly, are disbursed according to state population estimates. At the state and local
levels, understanding geographic patterns and changes in population distribution can
assist policy makers in targeting public funds for needed services, improve service
delivery, and aid in community planning efforts.
In order to inform Congress about important patterns and changes in the older
U.S. population, this report presents estimates of the geographic distribution of the
older population and population growth rates by state, region, and selected major
metropolitan statistical areas and counties. The report also provides a brief
discussion of the policy implications of population growth as it relates to the federal
government.
Contents
Introduction 1
Geographic Distribution of the Older Population 3
State Distribution of Population 4
State Population Growth 7
Regional Distribution of Population 9
Regional Population Growth 10
Population in Metropolitan Areas 11
Population Growth in Metropolitan Areas 12
County Population 14
Policy Implications 16
Federal Government 16
State and Local Government 17
Appendix 20
Data Collection 20
List of Figures
Figure 1. U.S. Population Age 65 and Older and 85 and Older,
1990 to 2030 (projected) 2
Figure 2. U.S. Population Age 65 and Older by State,
2005 5
Figure 3. Percent of State Resident Population Age 65 and Older,
2005 7
Figure 4. Growth Rate of the Population Age 65 and Older by State,
2000 to 2005 8
Figure 5. Growth Rate of the Population Age 85 and Older by State,
2000 to 2005 9
Figure 6. Percent of U.S. Population Age 65 and Older by Region,
2005 10
Figure 7. Percent of the Population Age 65 and Older
in Metropolitan Regions, 2003 11
List of Tables
Table 1. Top Ten States Ranked by Population and Percent
of U.S. Population Age 65 and Older, 2005 4
Table 2. Top 10 and Bottom 10 States Ranked by Percent
of State Resident Population Age 65 and Older, 2005 6
Table 3. Growth Rate of the Population Age 65 and Older by Region,
2000 to 2005 10
Table 4. Growth Rate of the Population Age 85 and Older by Region,
2000 to 2005 11
Table 5. Growth Rate of the Population Age 65 and Older
in Major and Small Metropolitan Areas, 1990 to 2000 13
Table 6. Counties Ranked by Resident Population Age 65 and Older,
2000 14
Table 7. Counties Ranked by Resident Population Age 85 and Older,
2000 15
Table 8. Counties Exceeding the U.S. Proportion Age 65 Years and Older
by Region, 2000 16
Appendix Table 1. States Ranked by the Number and Percent
of U.S. Population Age 65 and Older, 2005 21
Appendix Table 2. States Ranked by the Percent
of Their Resident Population Age 65 and Older, 2005 23
Appendix Table 3. States Ranked by the Percent
of Their Resident Population Age 85 and Older, 2005 24
Appendix Table 4. States Ranked by Growth Rate of Population
Age 65 and Older, 2005 25
Appendix Table 5. States Ranked by Growth Rate of Population
Age 85 and Older, 2005 27
1
For further information on U.S. demographic trends, see CRS Report RL32701, The
Changing Demographic Profile of the United States, by Laura B. Shrestha.
2
Federal Interagency Forum on Aging-Related Statistics, Older Americans 2004: Key-
Indicators of Well-Being, Washington, DC: U.S. Government Printing Office, 2004.
(Hereafter cited as: Federal Interagency Forum on Aging-Related Statistics, Older
Americans 2004).
3
Administration on Aging (AOA), U.S. Department of Health and Human Services, A
Profile of Older Americans: 2005. (Hereafter cited as: AOA, A Profile of Older Americans:
2005). For further information, see CRS Report RL32792, Life Expectancy in the United
States, by Laura B. Shrestha.
4
Federal Interagency Forum on Aging-Related Statistics, Older Americans 2004.
Where Do Older Americans Live?
Geographic Distribution
of the Older Population
Introduction
The U.S. population age 65 and older grew steadily through most of the 20th
century. U.S. Census Bureau population projections to 2030 indicate that further and
more dramatic growth is still to come. This increase is, in part, due to longer life
expectancies and the aging of the baby boom generation (those born between 1946
and 1964).
1
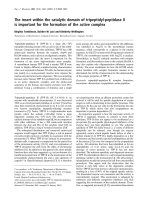
In 2005, the “older population,” defined as those individuals age 65 and
older, was estimated at 37 million, marking a 5% increase from the 2000 decennial
Census estimate of 35 million. Between 2005 and 2010, the older population is
expected to increase by another 10%, to 40 million, and then by an additional 36%,
to 55 million, by 2020. This dramatic growth in the older population is expected to
begin in 2011, when the first of the baby boomers turn 65 years of age, and to
continue beyond 2029, when the youngest of the boomers reach age 65. The Census
projects that in 2030 the U.S. population will have an estimated 72 million older
Americans, more than twice as many as the number estimated in 2000.
2
In 2003, those who reached age 65 could expect to live an additional 18.5 years,
on average (19.8 for women and 16.8 for men), or until 83.5 years of age.
3
And
while the population age 85 and older represents a small segment of the older
population, the “oldest-old,” defined as those individuals age 85 and older, are in fact
the fastest-growing segment of the older population. Between 2000 and 2005, the
population age 85 and older increased by 20%, and is projected to increase by another
20%, to 6.1 million, by 2010. Between 2010 and 2020 the population age 85 and
older is expected to increase an additional 20% to 7.3 million (see Figure 1).
4
CRS-2
5
He, Wan, et al., U.S. Census Bureau, Current Population Reports, P23-209, 65+ in the
United States: 2005, Washington, DC: U.S. Government Printing Office, 2005. (Hereafter
referred to as: He, 65+ in the United States: 2005).
6
For further information on Older Americans Act funding formulas, see CRS Report
RS22549, Older Americans Act: Funding Formulas, by Kirsten J. Colello. For further
information on HUD Section 202 funding formula, see CRS Report RL33508, Section 202
and Other HUD Rental Housing Programs for the Low-Income Elderly, by Libby Perl.
Source: Federal Interagency Forum on Aging-Related Statistics, Older Americans 2004.
Note: Data for 1990 and 2000 are Census estimates of the population 65 and older and 85 and older.
Data for 2010, 2020, and 2030 are Census population projections.
Today, the older population represents just over 12% of the U.S. population;
about one in every eight Americans is age 65 or older. By 2030, the Census projects
that one in every five, or 20% of the U.S. population, will be age 65 or older.
5
As the
older population continues to increase in size and proportion, and as individuals
continue to live longer post-retirement, changes in where older Americans live, or the
“geographic distribution”of the older population, will likely have broad policy
implications for federal, state, and local governments.
Population shifts affect important aging policy issues that concern both the
government and private sector, including social services, housing, health care, and
transportation. At the federal level, funds for federal programs, such as nutrition and
supportive services under the Older Americans Act (OAA) and the U.S. Department
of Housing and Urban Development (HUD) Section 202 housing program for the
elderly, are disbursed according to state population estimates.
6
Furthermore,
understanding geographic patterns and changes in population distribution at the state
and local levels can assist policymakers in targeting public funds for needed services,
help improve service delivery, and aid in community planning efforts.
In order to inform Congress about important patterns and changes in the older
U.S. population, this report presents estimates of the geographic distribution of the
0
10
20
30
40
50
60
70
80
90
100
1990 2000 2010 2020 2030
Population in millions
Age 85+
Age 65-74
Figure 1. U.S. Population Age 65 and Older and 85 and Older,
1990 to 2030 (projected)
CRS-3
7
He, 65+ in the United States: 2005.
8
Longino, Charles F. and Don E. Bradley, A First Look at Retirement Migration Trends in
2000, The Gerontologist, vol. 43, no. 6, pp. 904-907, 2003. (Hereafter referred to as:
Longino, A First Look at Retirement Migration Trends, 2003).
9
Himes, Christine L., Population Bulletin: Elderly Americans, vol. 56, no. 4, Population
Reference Bureau, December 2001. (Hereafter referred to as Himes, Elderly Americans,
2001).
10
Rogers, Carolyn C., Changes in the Older Population and Implications for Rural Areas,
Food and Rural Economics Division, Economic Research Service, U.S. Department of
Agriculture, Rural Development Research Report, no. 90, Washington, DC, December 1999.
(Hereafter referred to as Rogers, Changes in the Older Population, 1999). This report
defines the older population as 60 and older.
older population and population growth rates by state, region, and selected major
metropolitan statistical areas and counties. This report also provides a brief
discussion of the policy implications of population growth as it relates to the federal
government.
Geographic Distribution of the Older Population
Older Americans are not unlike the rest of the U.S. population in that they live
in the most populous states and within major metropolitan areas. While older
Americans are less likely to move than the younger population, of those who do
move, most move within the same county or state.
7
Among those moving to a
different state, their pattern has been to relocate from colder to warmer climates, from
larger metropolitan areas to smaller cities and towns, and from higher to lower cost
of living areas.
8
Over the past few decades, this has led to increases in the older
population in some states in the South and West, and in major metropolitan areas and
counties within these states.
Changes in the geographic distribution of the older population affect not only
the states on the receiving end of retirement migration, but states experiencing
population change due to older and younger residents leaving the state, often referred
to as “out-migration.” For example, out-migration has had a large impact on the age
distribution of the population in some states in the Midwest and Northeast,
particularly as young workers have left work in the farming and mining industries.
In some of these states, a greater share of the state’s resident population is growing
older, but not moving, a concept often referred to as “aging in place.”
9
In addition
to migration patterns among older and younger residents, differences in the
proportion of a state’s older resident population are determined by patterns of
fertility. Generally, states with high fertility rates have a higher proportion of
younger residents and a lower proportion of older residents.
According to some researchers, the changing geographic distribution of the
older population may result in disparities between resources and needs, including
medical services, social services, housing, and long-term care.
10
This section of the
report presents estimates of the older population by state and region, as well as data
CRS-4
on population change by region and selected metropolitan statistical areas and
counties.
State Distribution of Population. In general, the most populous states
account for the largest number of older Americans; conversely, the least populous
states have the fewest number of older Americans. In 2005, just over half of the total
U.S. population age 65 and older (54%) lived in 10 states — California, Florida, New
York, Texas, Pennsylvania, Ohio, Illinois, Michigan, New Jersey, and North Carolina
(see Table 1). With the exception of North Carolina, these 10 states also happen to
be the ten most populous states. The top four states with respect to total population
size (California, Florida, New York, and Texas) each had over 2 million older
Americans and accounted for almost one-third of the entire U.S. older population
(31%). The remaining six states each had more than 1 million older Americans.
Table 1. Top Ten States Ranked by Population and Percent
of U.S. Population Age 65 and Older, 2005
Rank State Number Percent of U.S.
population 65
and older
1. California 3,868,574 10.52
2. Florida 2,993,160 8.14
3. New York 2,515,064 6.84
4. Texas 2,271,845 6.18
5. Pennsylvania 1,892,847 5.14
6. Ohio 1,530,074 4.16
7. Illinois 1,529,430 4.16
8. Michigan 1,258,494 3.42
9. New Jersey 1,129,356 3.07
10. North Carolina 1,054,098 2.87
Total 20,042,942 54.50
Source: CRS compilation based on data from the U.S. Census Bureau.
States with small populations, such as South Dakota, North Dakota, Vermont,
Wyoming, and Alaska and the District of Columbia had fewer older Americans. In
2005, just 1% of the older population lived in these five states and the District of
Columbia. The size of the older population in these states ranged between 44,000
in Alaska and 110,000 in South Dakota. Figure 2 shows a map of the U.S.
population age 65 and older by state. A complete list of states ranked by the number
of older residents and percent of the U.S. population age 65 and older is presented
in Appendix Table 1.
CRS-5
11
This report refers to the proportion of the state’s population age 65 and older relative to
the total U.S. population age 65 and older as the percent of the U.S. population 65 and older
by state. The proportion of the state’s population age 65 and older relative to the total state
population, in this report, is referred to as the percent of the state’s resident population age
65 and older.
Source: CRS compilation based on data from the U.S. Census Bureau.
Generally, the states that had the largest number of older Americans in 2005
were not the same states with the largest proportion of older residents (with the
exception of Florida and Pennsylvania). The first population statistic refers to the
distribution of the total U.S. population age 65 and older by state, the second statistic
refers to the distribution of the population age 65 and older within a state, that is, the
proportion of the state’s older residents relative to the state’s total resident
population.
11
Table 2 shows the top 10 states ranked by percent of the state’s
resident population age 65 and older, and the bottom 10 states with the smallest
proportion of older residents.
DC
United States
Total: 36,790,113
0 to 499,999
500,000 to 999,999
1,000,000 or more
Number
DCDC
0 to 499,999
1,000,000 or more
Number
DCDC
United States
Total: 36,790,113
0 to 499,999
500,000 to 999,999
1,000,000 or more
Number
DCDC
0 to 499,999
1,000,000 or more
Number
Figure 2. U.S. Population Age 65 and Older by State, 2005
CRS-6
Table 2. Top 10 and Bottom 10 States Ranked by Percent
of State Resident Population Age 65 and Older, 2005
Rank Top 10 states with percent of
resident population 65 and over
Rank Bottom 10 states with percent of
resident population 65 and over
State Percent State Percent
1. Florida 16.83 42. Idaho 11.47
2. West Virginia 15.32 43. Washington 11.46
3. Pennsylvania 15.23 44. Virginia 11.43
4. North Dakota 14.71 45. Nevada 11.31
5. Iowa 14.67 46. California 10.71
6. Maine 14.58 47. Colorado 9.97
7. South Dakota 14.24 48. Texas 9.94
8. Rhode Island 13.92 49. Georgia 9.59
9. Arkansas 13.83 50. Utah 8.75
10. Montana 13.77 51. Alaska 6.63
Source: CRS compilation based on data from the U.S. Census Bureau.
Note: Percent of the U.S. population age 65 and older is 12.4%.
States such as California and Texas have relatively lower shares of older
residents due to increases in fertility and in-migration of younger residents. While
California has the largest number of older people, at 3.8 million, it is among the
states with the lowest proportion of older residents, with 10.7% of the resident
population age 65 and older. In contrast, North Dakota and South Dakota are two of
the bottom 10 states with the lowest number of older people, but among the states
with the highest proportion of older residents (14.7% and 14.2%, respectively, well
above the national average of 12.4%). Figure 3 shows a map of the United States
with the percent of each state’s resident population age 65 and older in 2005. A
complete list of state rankings by percent of the state resident population age 65 and
older is seen in Appendix Table 2.
CRS-7
Source: CRS compilation based on data from the U.S. Census Bureau.
More than 5 million U.S. residents were age 85 and older in 2005, representing
1.7% of the total U.S. population. North Dakota has the highest proportion of a
resident population age 85 and older, with 2.7% of its resident population among the
oldest-old. Several New England and Midwestern states were among those with the
highest proportion of oldest-old residents, including Rhode Island, Connecticut, and
Massachusetts in the Northeastern region of the country, and Iowa, Kansas, and the
Dakotas in the Midwest. A complete list of state rankings by percent of the state
resident population age 85 and older is seen in Appendix Table 3.
State Population Growth. Several states have experienced dramatic growth
in their older population over the past five years. States such as Nevada and Alaska
have experienced more than four times the average growth rate, with population
increases of 24.8% and 23.3%, respectively. Another seven states have more than
two times the average growth: Utah, Arizona, Idaho, Colorado, Georgia, New
Mexico, and Delaware. All of these states are in the South and West regions.
Another group of states and the District of Columbia have experienced overall
declines in their older populations: Iowa, Massachusetts, North Dakota,
Pennsylvania, and Rhode Island. These states were either in the Midwest or
Northeast regions of the country. Figure 4 shows a map of the United States with
five-year growth of the population age 65 and older by state. A detailed table with
the percent changes in the population age 65 and older for all the states is provided
in Appendix Table 4.
DC
United States
10.8% to 12.4%
12.5% to 14.1%
14.2% or more
DCDC
United States
Average: 12.4%
10.7% or less
DCDC
United States
10.8% to 12.4%
12.5% to 14.1%
14.2% or more
DCDC
United States
Average: 12.4%
10.7% or less
Figure 3. Percent of State Resident Population Age 65 and Older,
2005
CRS-8
Source: CRS compilation based on data from the U.S. Census Bureau.
Dramatic growth of the oldest-old population occurred in several states between
2000 and 2005. Nine states experienced increases in their population age 85 and
older of about one-third or more: Hawaii, Nevada, Alaska, Delaware, Connecticut,
Maryland, Arizona, Rhode Island, and Washington. However, five of these states
have less than 30,000 individuals age 85 and older (Hawaii, Nevada, Alaska,
Delaware, and Rhode Island). The remaining four states had more than 80,000
oldest-old residents.
The same states that experienced overall declines in their population age 65 and
older had increases in their oldest-old population during the same five-year time
period. This further suggests that retirement migration of a “younger” senior
population, that is, those age 65 to 74, may leave some states with an increasing
oldest-old population that is aging in place and more likely to be frail or in need of
health and supportive services. Two states, Oklahoma and Mississippi, experienced
declines in their oldest-old population over the same five-year period. Figure 5
shows a map of the United States with the five-year growth of the population age 85
and older by state. A detailed table with the percent changes in the population age
85 and older for all the states is provided in Appendix Table 5.
DC
United States
0.1% to 5.1%
5.2% to 10.2%
DCDC
United States
Average: 5.1%
10.3% or more
0 or less
DCDC
United States
0.1% to 5.1%
5.2% to 10.2%
DCDC
United States
Average: 5.1%
10.3% or more
0 or less
Figure 4. Growth Rate of the Population Age 65 and Older by State,
2000 to 2005
CRS-9
12
Longino, A First Look at Retirement Migration Trends, 2003.
13
States in the Northeast region include Maine, New Hampshire, Vermont, Massachusetts,
Rhode Island, Connecticut, New York, New Jersey, and Pennsylvania; states in the Midwest
region include: Ohio, Indiana, Illinois, Michigan, Wisconsin, Minnesota, Iowa, Missouri,
North Dakota, South Dakota, Nebraska, and Kansas; states in the Southern region include
Delaware, Maryland, District of Columbia, Virginia, West Virginia, North Carolina, South
Carolina, Georgia, Florida, Kentucky, Tennessee, Alabama, Mississippi, Arkansas,
Louisiana, Texas, and Oklahoma; states in the Western region include Montana, Idaho,
Wyoming, Colorado, New Mexico, Arizona, Utah, Nevada, Washington, Oregon, California,
Alaska, and Hawaii.
Source: CRS compilation based on data from the U.S. Census Bureau.
There are several reasons why some states may be experiencing higher-than-
average growth among the older population. Historically, migration of the older
population has been concentrated geographically in a few states, such as Florida,
Arizona, California, and Texas. While recent trends suggest a wider variation in
retirement destinations among older interstate migrants, states experiencing high
growth, such as Arizona, Nevada, and Georgia, were among the leading destination
states in 2000.
12
Other states are experiencing higher-than-average growth of their
older populations due to increasing longevity among the older residents who have
remained in these states and aged in place.
Regional Distribution of Population. The Census divides the United
States into four geographic regions: the Northeast, Midwest, South, and West.
13
In
2005, the largest number of older Americans lived in the South, followed by the
Midwest, Northeast, and West regions. More than 13.3 million older Americans, or
one-third (36%) of the total U.S. population age 65 and older, lived in the Southern
region. Almost one-quarter of the older population lived in the Midwest (24%), and
DC
United States
0.1% to 10.1%
10.2% to 20.2%
DCDC
United States
Average: 20.2%
30.4% or more
0 or less
20.3% to 30.3%
DCDC
United States
0.1% to 10.1%
10.2% to 20.2%
DCDC
United States
Average: 20.2%
30.4% or more
0 or less
20.3% to 30.3%
Figure 5. Growth Rate of the Population Age 85 and Older by State,
2000 to 2005
CRS-10
about one-fifth each lived in the Northeast and the West (21% and 20%, respectively)
(see Figure 6).
Source: CRS compilation based on data from the U.S. Census Bureau.
Note: Due to rounding, percentages in Figure 6 total to more than 100%.
Regional Population Growth. Between 2000 and 2005, growth of the U.S.
population age 65 and older has largely occurred in the Southern and Western regions
(see Table 3). Compared to the national average of 5.1%, these regions have
experienced higher-than-average growth, with a 7.0% increase in the population age
65 and older in the South, and a 9.5% increase in the West.
Table 3. Growth Rate of the Population Age 65 and Older by
Region, 2000 to 2005
Region
Population 65+
in 2000
Population 65+
in 2005
Growth Rate
(%)
Northeast 7,372,282 7,451,769 1.1
Midwest 8,259,075 8,443,504 2.2
South 12,438,267 13,314,798 7.0
West 6,922,129 7,580,042 9.5
Total 34,991,753 36,790,113 5.1
Source: CRS compilation based on data from the U.S. Census Bureau.
Growth of the oldest-old population between 2000 and 2005 has largely
occurred in the West (29%) and Northeast (24%) (see Table 4). The average growth
rate for the United States is 20%. Higher-than-average growth of the population age
85 and older in the Northeast and West is likely due to increases in longevity and the
DC
Northeast (21%)
Midwest (24%)
DCDC
South (36%)
West (20%)
DCDC
Northeast (21%)
Midwest (24%)
DCDC
South (36%)
West (20%)
Figure 6. Percent of U.S. Population Age 65 and Older by Region,
2005
CRS-11
14
Himes, Elderly Americans, 2001.
15
Stoller, Eleanor P. and Charles F. Longino Jr., “Going Home” or “Leaving Home”? The
Impact of Person and Place Ties on Anticipated Counterstream Migration, The
Gerontologist, vol. 41, no. 1, 2001, pp. 96-102. (Hereafter referred to as: Stoller, “Going
Home” or “Leaving Home”?, 2001).
pattern of many older individuals to age-in-place.
14
Increases in the oldest-old
population in the Northeast region may also be affected by “counterstream” migration
patterns, where older individuals who retired to Southern states when economic and
health conditions were more favorable return to their state of origin or locations
closer in proximity to family and friends.
15
Many Western states, such as Arizona,
California, and Nevada, were among the leading retirement destination states in
2000, attributing to growth among the older population in the West.
Table 4. Growth Rate of the Population Age 85 and Older
by Region, 2000 to 2005
Region
Population 85+
2000
Population 85+
2005
Growth Rate
(%)
Northeast 938,459 1,163,838 24.0
Midwest 1,064,295 1,265,765 18.9
South 1,430,546 1,624,958 13.6
West 806,287 1,041,377 29.2
United States 4,239,587 5,095,938 20.2
Source: CRS compilation based on data from the U.S. Census Bureau.
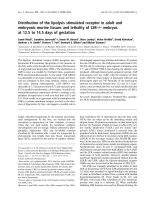
Population in Metropolitan Areas. Similar to other age groups, most
individuals age 65 and older live inside metropolitan areas. In 2004, more than
three-fourths (77%) of the U.S. population age 65 and older lived inside metropolitan
area, an increase from 74% in 1990 (see Figure 7). Of the older population living
inside metropolitan areas, half (50%) lived in the suburbs, while 27% lived in central
cities.
Source: AOA, A Profile of Older Americans: 2005.
50%
27%
23%
Metropolitan: Suburban
Metropolitan: City
Non-metropolitan
Figure 7. Percent of the Population Age 65 and Older in
Metropolitan Regions, 2003
CRS-12
16
The metropolitan areas were defined by the Office of Management and Budget (OMB)
as of June 30, 1999. All metropolitan areas are either metropolitan statistical areas (MSAs)
or consolidated metropolitan statistical areas (CMSAs). For further information, see He,
65+ in the United States: 2005.
17
Rogers, Changes in the Older Population, 1999. This report defines the older population
as 60 and older.
However, the older population accounted for a larger proportion of the total U.S.
population living in non-metropolitan or rural areas (14.7%) than inside metropolitan
areas (11.9%). This pattern holds true for the population age 85 and older, who also
represented a slightly larger proportion of the total U.S. population living outside of
metropolitan areas (1.8% versus 1.4%, respectively) in 2000.
16
While the older population tends to be concentrated in both metropolitan and
non-metropolitan areas in the South, a large proportion of non-metropolitan elderly
reside in the Midwest and Northeast. Compared to other regions, the non-
metropolitan Midwest has the largest proportion of its population age 85 and older.
This reflects both out-migration of young adults and aging in place of older residents
in the Midwest. In general, non-metropolitan areas have a greater proportion of older
individuals that have lower educational attainment, lower incomes and fewer sources
of retirement income, and less adequate housing and transportation, compared to
older individuals living in metropolitan areas.
17
Population Growth in Metropolitan Areas. Several large metropolitan
areas experienced high growth of the older population between 1990 and 2000. For
example, the over-65 population in Las Vegas, NV, grew by 86% during the 1990s.
Major metropolitan areas such as Phoenix, AZ, and Austin, TX, each experienced an
increase of more than one-third in their older resident population (see Table 5).
Smaller metropolitan areas such as Naples, FL, and Anchorage, AK, also experienced
high growth. Much of the growth of the older population in metropolitan areas is due
to population increases in suburban areas, particularly in expanding metropolitan
areas such as Dallas and Atlanta.
CRS-13
18
Metropolitan areas are CMSAs, MSAs, and (in New England) NECMAs, as defined by
OMB in June 2000. Major metropolitan areas have total populations exceeding 1 million
in the year 2000; small metropolitan areas have total populations of less than 1 million in
the year 2000.
19
Frey, William H., Seniors in Suburbia, American Demographics, vol. 23, no.11,
November 2001, pp. 18-21.
Table 5. Growth Rate of the Population Age 65 and Older
in Major and Small Metropolitan Areas, 1990 to 2000
Rank Metropolitan Area
18
Growth Rate
(%)
Major Metropolitan Area
1. Las Vegas, NV-AZ 86.2
2. Phoenix-Mesa, AZ 38.0
3. Austin-San Marcos, TX 37.3
4. Houston-Galveston-Brazoria, TX 31.8
5. Atlanta, GA 30.8
6. Orlando, FL 28.8
7. Sacramento-Yolo, CA 27.8
8. Raleigh-Durham-Chapel Hill, NC 25.8
9. Denver-Boulder-Greeley, CO 25.8
10. Dallas-Forth Worth, TX 25.1
Small Metropolitan Area
1. Naples, FL 77.9
2. Anchorage, AK 72.5
3. Myrtle Beach, SC 61.7
4. Las Cruces, NM 55.7
5. Fort Walton Beach, FL 55.1
6. Ocala, FL 47.0
7. Flagstaff, AZ-UT 46.3
8. Wilmington, NC 45.7
9. McAllen-Edinburg-Mission, TX 43.8
10. Melbourne-Titusville-Palm Bay, FL 42.6
Source: Frey, William H., Seniors in Suburbia, American Demographics, Nov. 2001, p. 19.
The “graying of the suburbs” has occurred as once young adults who first moved
to the suburbs in the 1950s to start families have aged in place into their retirement
years. In the 1990s, senior growth in suburban areas was 20%, compared to just over
2% in central cities.
19
Suburbs with the fastest-growing population age 65 and older
were located in “sunbelt” states such as Arizona and Texas. Suburbs with the largest
proportion of their resident population age 65 and older were located in popular
retirement states such as Florida. These suburbs tend to have “younger” senior
populations, members of which are more likely to live with a spouse, have fewer
disabilities, and higher incomes. Suburbs with the largest share of older residents
were also located in “rustbelt” states such as Pennsylvania and Ohio and upstate New
CRS-14
20
Frey, William H., Boomers and Seniors in the Suburbs: Aging Patterns in Census 2000,
The Brookings Institution, Washington, DC, January 2003, p. 13. Hereafter cited as: Frey,
Boomers and Seniors in the Suburbs, 2003.
21
He, 65+ in the United States: 2005.
York. Members of the older population in these suburbs were, in general, more
likely to be “older” seniors, more likely to be female, and more likely to being living
alone.
20
County Population. In 2000, 11 of the 3,141 counties in the United States
had more than 250,000 residents age 65 and older: Los Angeles (CA), Cook (IL),
Maricopa (AZ), San Diego (CA), Miami-Dade (FL), Queens (NY), Kings (NY),
Orange (CA), Palm Beach (FL), Broward (FL), and Harris (TX). Counties with the
largest population sizes had from approximately 250,000 to more than 900,000 older
individuals. Not surprisingly, many of these counties are located in states with large
numbers of older residents (California, Florida, Illinois, New York, Texas) and
include major metropolitan areas such as Phoenix, Los Angeles, San Diego, Miami,
Ft. Lauderdale, Chicago, New York City, and Houston. In 2000, 331 counties had
20% or more of their population age 65 and older, a decline from 393 counties in
1990.
21
None of the 11 counties that were largest in size of the population age 65 and
older were among the counties with the greatest proportion of older residents (see
Table 6). Counties with the largest proportion of residents age 65 and older were
concentrated in the Midwest and the South, with six in Florida. None were in the
Northeast. In these counties almost one-third or more of county residents were age
65 and older.
Table 6. Counties Ranked by Resident Population
Age 65 and Older, 2000
Percent of resident population
65 and older
Rank County State Percent
1. Charlotte FL 34.7
2. McIntosh ND 34.2
3. Highlands FL 33.0
4. Citrus FL 32.2
5. Kalawao HI 32.0
6. Sarasota FL 31.5
7. Hernando FL 30.9
8. Llano TX 30.7
9. McPherson SD 29.6
10. Divide ND 29.5
11. Indian River FL 29.2
United States 12.4
Source: CRS compilation based on data from He, 65+ in the United States: 2005.
CRS-15
22
Philadelphia County, PA, consolidated with the City of Philadelphia in 1854. New York
County, NY, consolidated with the City of New York in 1874. For further information see,
National Association of Counties, at [].
23
Ibid.
The number of counties with at least 25,000 residents age 85 and older more
than doubled between 1990 and 2000, from 8 counties to 18. These counties include
all of the 11 counties with more than 250,000 residents age 65 and older, as well as
Pinellas (FL), Allegheny (PA), Cuyahoga (OH), Philadelphia (PA), Wayne (MI),
New York City (NY), and Middlesex (MA).
22
The size of the oldest-old population
in the top counties ranged from just over 25,000 in Middlesex (MA) to 109,000 in
Los Angeles (CA). Three states — New York, California, and Florida — each had
3 counties that were among the largest in terms of size of the oldest-old population.
23
However, as shown in Table 7, none of the 18 counties with the largest
population age 85 and older were among the top 18 counties with the largest
proportion of their resident population age 85 and older. With the exception of two
Texas counties (Foard and Stonewall), all counties with the highest proportion of the
oldest-old were in the Midwest, specifically Kansas (7), North Dakota (4), South
Dakota (2), Nebraska (2), and Minnesota (1). Between 1990 and 2000, 121 counties
experienced 100% or more growth of the oldest-old population. Counties that
experienced high growth among the oldest-old were primarily concentrated in the
South and West, none of these counties were in the Northeast.
Table 7. Counties Ranked by Resident Population
Age 85 and Older, 2000
Percent of resident population
age 85 and older
Rank County State Percent
1. McIntosh ND 6.64
2. Hooker NE 6.26
3. Divide ND 5.69
4. Smith KS 5.47
5. Osborne KS 5.28
6. Cloud KS 5.27
7. Traverse MN 5.20
8. Foard TX 5.18
9. Elk KS 5.15
10. Garfield NE 5.10
11. Hutchinson SD 5.08
12. Gregory SD 4.99
13. Nemaha KS 4.98
14. Washington KS 4.97
15. Wells ND 4.86
16. Stonewall TX 4.84
17. Comanche KS 4.78
18. Griggs ND 4.76
Unites States 1.72
Source: CRS compilation based on data from He, 65+ in the United States: 2005.
CRS-16
24
U.S. Census Bureau, Census 2000 Basics, Washington, DC: U.S. Government Printing
Office, 2002.
Of all 3,141 counties in the United States, 72% had a proportion of their resident
population age 65 and older that exceeded the national average of 12.4% in 2000 (see
Table 8). The Midwest had the highest percentage of counties (82%) with an above-
average older resident population, followed by the Northeast (78%), South (69%),
and West (55%). This further suggests that the trends of out-migration of young
workers and aging in place in the Midwest and Northeast have had a disproportionate
effect on these regions. While most states (43) have a majority of counties with a
proportion of residents age 65 and older that is greater than the national value of
12.4%, in seven states more than 90% of the counties had proportions greater than
this value. Not surprisingly, these states were in either the Midwest or Northeast and
include: Rhode Island, Maine, Nebraska, Iowa, West Virginia, Pennsylvania, and
North Dakota.
Table 8. Counties Exceeding the U.S. Proportion
Age 65 Years and Older by Region, 2000
Region
Total
counties
Counties exceeding
U.S. proportion
Number Percent
Northeast 217 170 78.3
Midwest 1,055 869 82.4
South 1,424 980 68.8
West 445 244 54.8
United States 3,141 2,263 72.0
Source: Hetzel, Lisa and Annetta Smith, The 65 Years and Over Population: 2000, Census 2000
Brief, C2KBR/01-10, U.S. Census Bureau, Washington, DC. Oct. 2001.
Note: Proportion of the U.S. population age 65 years and over was 12.4%
.
Policy Implications
The geographic distribution of older Americans and changes in population
distribution over the past few decades have implications for federal policy directly
and for state and local policy that could, in turn, affect federal policy decisions. The
following section describes some implications for federal, state, and local policy.
Federal Government. The federal government relies on population data
from the U.S. Census Bureau to distribute almost $200 billion in federal, state, local,
and tribal funds.
24
Targeting federal funds to areas of the country with large numbers
of older Americans depends on accurate data collection (see Appendix). For
example, allotments to states for OAA Title III supportive services and senior
CRS-17
25
For comparability with published estimates from the U.S. Census and other sources, the
older population in this report is defined as age 65 and older.
26
For further information, see CRS Report RL31336, The Older Americans Act: Programs,
Funding, and 2006 Reauthorization (P.L. 109-365), by Carol O’Shaughnessy and Angela
Napili.
centers, congregate nutrition and home-delivered nutrition services, and disease
prevention and health promotion services are based on a population formula factor
that is defined as each state’s relative share of the total U.S. population age 60 years
and older. Funds for the family caregiver support program are allotted to states based
on each state’s relative share of the population age 70 years and older. States in turn
distribute their federal allotment to local area agencies on aging using an intrastate
funding formula. In addition, the HUD Section 202 program distributes funds for
rental housing for those age 62 and older based, in part, on Census population
estimates.
25
The federal government can also assist state and local governments in preparing
and planning for resources in anticipation of the aging baby boom generation. The
OAA Amendments of 2006 (P.L. 109-365) recognized the importance of state and
local efforts to plan for these coming demographic changes. P.L. 109-365 requires
each state agency on aging, at the election of the state, to include in state plans on
aging an assessment of how prepared the state is for changes in the elderly
population. The assessment may include
! an analysis of how demographic changes may affect older
individuals, including those with low incomes, those with greatest
economic need, minority older individuals, those residing in rural
areas, and those with limited English proficiency;
! an analysis of how the programs, policies, and services provided by
states and area agencies can be improved, and how resource levels
can be adjusted to meet the needs of the changing population of
older individuals in the state; and
! an analysis of how the change in the number of persons age 85 years
and older is expected to affect the need for supportive services.
The law also authorizes area agencies on aging to conduct similar activities and
to make recommendations to government officials on actions to build their capacity
to respond to the needs of the growing aging population, including health and human
services, land use, housing, transportation, public safety, workforce and economic
development, and emergency preparedness, among others.
26
State and Local Government. Many state and local communities face
increases both in the size and proportion of their older resident population, due in
part to longer life expectancy and the aging of the baby boom generation.
Additionally, some states and communities have been identified as retirement
“magnets,” that is, they are popular retirement destination spots. These retirement
hot spots, many in sunbelt states such as Florida, Arizona, and Nevada, are popular
typically because they have warmer climates, a lower cost of living, and lower
population density, relative to the retiree’s state of origin. Popular destination states
CRS-18
27
Frey, Seniors in Suburbia, 2001.
28
Frey, Boomers and Seniors in the Suburbs, 2003.
29
Stoller, “Going Home” or “Leaving Home”?, 2001.
30
Rogers, Changes in the Older Population, 1999. This report defines the older population
as 60 and older.
have experienced an influx of older migrants who are typically in their immediate
post-retirement years, between the ages of 65 and 74, with considerable disposable
income, married, and in favorable health. Some experts believe that areas
experiencing growth from a “younger” senior population are likely to benefit from
increases in consumption of local goods and services, a net increase in the state and
local tax base, and greater community involvement, including volunteerism, from an
active retirement population.
27
Other states and local communities may face increases in the share of their older
resident population due to younger working-age residents leaving for jobs in other
states, leaving an ever-increasing older population. As the economic and health
status of older individuals declines with advanced age, states and local communities
with higher concentrations of older Americans, particularly those age 85 and older,
may face increased demands for public support for resources such as medical and
health services, social services, housing, transportation, and long-term care. The
ability of state and local governments to pay for these services may be difficult.
Communities with a greater proportion of older individuals aging in place may face
greater financial responsibilities than communities with a higher proportion of young
retirees both because those who are among the oldest-old generally have lower
incomes and greater health and social service needs, and because they have fewer
young people to count on for support.
28
A related concern involves older persons who return from popular retirement
destination states to their state of origin possibly due to changes in their economic,
social, or health status, such as widowhood or onset of chronic disease or disability.
These so-called counterstream migrants have been found to be, on average,
somewhat older, and more often widowed and living dependently with relatives and
others than other migrants.
29
Non-Metropolitan Areas. The proportion of the older population in non-
metropolitan or rural areas has increased over the past two decades due to several
factors: older individuals aging in place; out-migration of younger workers leaving
behind an older resident population; and, the movement of older individuals from
metropolitan areas to smaller communities or, “in-migration” of retirees. According
to researchers, the older population, particularly the oldest-old, in rural or non-
metropolitan areas are more likely to be poor than those living in urban or
metropolitan areas.
30
Many observers believe that rural health services can be more costly to deliver
and are less accessible, either due to the recipients lack of close proximity to services
or to fewer providers and less specialized services. Furthermore, the range of health
care services may be limited with few alternatives for patients. Given that the older
CRS-19
31
Ibid.
population accounts for a larger proportion of the total population in non-
metropolitan areas, some experts have expressed concern about ongoing problems
with the delivery of medical and social services to rural residents.
31
As a result, Congress has passed legislation that specifically includes provisions
focusing on the special needs of the rural elderly. For example, under the OAA, Title
III services are available to all persons age 60 and over, but are targeted to those with
the greatest economic or social need, particularly low-income and minority persons
and older persons residing in rural areas. The law also requires that states, in
developing their intrastate funding formulas, take into account the distribution of
people with those characteristics. The law further requires that the agencies set
specific objectives for serving target groups and that program development,
advocacy, and outreach efforts be focused on these groups. Service providers are
required to meet specific objectives set by area agencies for providing services to
target groups, including the rural elderly, and area agencies are required to describe
in their area plans how they have met these objectives.
CRS-20
32
The federal government is mandated by the U.S. Constitution to conduct a census, or
count, of the entire U.S. population every 10 years. In 2000 the census occurred on April
1.
33
Longino, Charles F. Jr., “Geographic Mobility and the Baby Boom,” Generations, Spring
1998, vol. 22, no. 1, pg. 50.
34
Federal Interagency Forum on Aging-Related Statistics, Older Americans 2004.
35
Ibid.
Appendix
Data Collection. The primary source of data for this report is the U.S. Census
Bureau.
32
Data used in this report are from Census population estimates for 2005 and
published data from the 2000 Decennial census. Another source of population data
cited in this report is the Current Population Survey (CPS), a nationally
representative sample survey of households conducted monthly by the U.S. Census
Bureau. Monthly CPS supplements provide demographic and social data. Given that
a large amount of federal spending for programs and services to vulnerable older
populations is distributed based on Census population data, the accuracy of data
collection methods is important. However, some individuals, including older
individuals, may be counted incorrectly or not captured in the Census at all.
The Census may not accurately capture older individuals who travel frequently
or have multiple residences in one year. For example, this may affect the so-called
“snow-bird” population, who choose to spend part of the year, typically the winter
months, in a state with a warmer climate. These older individuals would be
identified in the state where they were residing on April 1, regardless of their
permanent address. Alternatively, some older Americans choose to have no
permanent residence and instead travel continuously in the United States and/or
abroad, live in a vacation home, or live and travel in recreational vehicles. While it
is difficult to quantify the number of older individuals who choose these lifestyles,
some observers indicate this population is increasing.
33
According to experts,
reliable data at the state and local levels are needed to help governments accurately
assess the well-being of their older populations.
34
Information on the older population may also be difficult to obtain due to lack
of data collection or specification by residential setting. Like many large national
household-based surveys that rely on Census population data, the CPS does not
sample the institutionalized population, including those in nursing homes. This
exclusion can be an issue for researchers and policymakers who are interested in
information on the entire older population, particularly among the oldest-old age
group. And, as the use of assisted-living facilities and other types of residential
settings as alternatives to institutional care has increased over the past 15 years, data
collection efforts that distinguish these types of non-institutional community
residences from institutional facilities will be important for state and local long-term
care planning and service delivery.
35
CRS-21
Appendix Table 1. States Ranked by
the Number and Percent of U.S. Population Age 65 and Older,
2005
Rank State
Number of
people 65 and
older
Percent of
U.S.
population 65
and older
1. California 3,868,574 10.52
2. Florida 2,993,160 8.14
3. New York 2,515,064 6.84
4. Texas 2,271,845 6.18
5. Pennsylvania 1,892,847 5.14
6. Illinois 1,530,074 4.16
7. Ohio 1,529,430 4.16
8. Michigan 1,258,494 3.42
9. New Jersey 1,129,356 3.07
10. North Carolina 1,054,098 2.87
11. Georgia 870,422 2.37
12. Virginia 865,103 2.35
13. Massachusetts 852,826 2.32
14. Indiana 777,506 2.11
15. Missouri 773,171 2.10
16. Arizona 758,181 2.06
17. Tennessee 749,951 2.04
18. Wisconsin 721,633 1.96
19. Washington 720,874 1.96
20. Maryland 644,560 1.75
21. Minnesota 623,241 1.69
22. Alabama 603,733 1.64
23. South Carolina 534,980 1.45
24. Louisiana 531,581 1.44
25. Kentucky 525,764 1.43
26. Connecticut 474,150 1.29
27. Oregon 469,906 1.28
28. Oklahoma 468,968 1.27
29. Colorado 465,096 1.26
30. Iowa 435,220 1.18
31. Arkansas 384,450 1.04