HEALTH STATUS AND MEDICAL TREATMENT OF THE FUTURE ELDERLY: IMPLICATIONS FOR MEDICARE PROGRAM EXPENDITURES potx
Bạn đang xem bản rút gọn của tài liệu. Xem và tải ngay bản đầy đủ của tài liệu tại đây (3.8 MB, 249 trang )
HEALTH STATUS AND MEDICAL TREATMENT OF
THE FUTURE ELDERLY: IMPLICATIONS FOR
MEDICARE PROGRAM EXPENDITURES
FINAL REPORT
HEALTH STATUS AND MEDICAL TREATMENT OF THE FUTURE ELDERLY:
IMPLICATIONS FOR MEDICARE PROGRAM EXPENDITURES
FINAL REPORT
By Dana P. Goldman, Project Leader
Michael Hurd, Co-Project Leader
Paul G. Shekelle, Sydne J. Newberry, Constantijn W.A. Panis, Baoping Shang, Jayanta
Bhattacharya, Geoffrey F. Joyce, Darius N. Lakdawalla, Cathi A. Callahan, and Gordon R.
Trapnell
Federal Project Officer: Linda Greenberg
RAND Health
CMS Contract No. 500-95-0056
May 2003
The statements contained in this report are solely those of the authors and do not necessarily
reflect the views or policies of the Centers for Medicare & Medicaid Services. The contractor
assumes responsibility for the accuracy and completeness of the information contained in this
report.
TABLE OF CONTENTS
EXECUTIVE SUMMARY 1
BACKGROUND 1
STUDY DESIGN AND METHODS 2
RESULTS 5
CONCLUSIONS 10
FINAL THOUGHTS 17
CHAPTER 1. INTRODUCTION 19
CHAPTER 2. PROSPECTS FOR MEDICAL ADVANCES IN THE 21
ST
CENTURY 21
THE TECHNOLOGIES 21
CHAPTER 3. METHODS FOR IDENTIFYING AND QUANTIFYING KEY BREAKTHROUGHS 37
SELECTION OF THE MEDICAL TECHNICAL EXPERT PANELS 38
SELECTION OF THE POTENTIAL MEDICAL BREAKTHROUGHS FOR FURTHER EVALUATION 38
FULL LITERATURE SEARCH 47
ARTICLE SELECTION 47
PANEL MEETING 47
CHAPTER 4. MEDICAL LITERATURE REVIEW 49
CARDIOVASCULAR DISEASE 49
NONINVASIVE DIAGNOSTIC IMAGING TO IMPROVE RISK STRATIFICATION 50
BIOLOGY OF AGING AND CANCER 64
NEUROLOGIC DISEASES 79
HEALTH SERVICES 91
CHAPTER 5. THE MEDICAL EXPERT PANELS 95
CARDIOVASCULAR DISEASES 95
BIOLOGY OF AGING AND CANCER 101
NEUROLOGIC DISEASES 106
HEALTH SERVICES 111
CHAPTER 6. THE SOCIAL SCIENCE EXPERT PANEL 115
METHODS 116
LITERATURE REVIEW 117
IMPLICATIONS FOR FUTURE WORK 119
CHAPTER 7. THE FUTURE ELDERLY MODEL (FEM) 123
THE MECHANICS OF THE FEM 123
CHOICE OF THE HOST DATA SET 125
DEFINING HEALTH STATES 126
FEM OVERVIEW 129
COMPONENTS OF THE MODEL 131
CHAPTER 8. HEALTH EXPENDITURES 135
DATA 135
DISABILITY, HEALTH STATUS, AND DISEASE 136
CHAPTER 9. HEALTH STATUS 145
DATA 145
MISSING DATA 148
RESULTS OF ESTIMATION 148
MORTALITY 155
CHAPTER 10. THE HEALTH STATUS OF FUTURE MEDICARE ENTERING COHORTS 159
DATA 159
METHODS 162
iii
CHAPTER 11. SCENARIOS 171
TELOMERASE INHIBITORS 171
CANCER VACCINES 176
DIABETES PREVENTION VIA INSULIN SENSITIZATION DRUGS 182
COMPOUND THAT EXTENDS LIFE SPAN 186
EDUCATION 189
RISE IN HISPANIC POPULATION 192
SMOKING 194
OBESITY 197
CARDIOVASCULAR DISEASES 200
CHAPTER 12. TECHNICAL DETAILS OF THE FEM 205
CHAPTER 13. USEFULNESS TO THE OFFICE OF THE ACTUARY 209
POPULATION PROJECTION 209
EXPENDITURE PROJECTION 211
ECONOMETRIC METHODOLOGY 215
WHAT-IF SCENARIOS 215
USEFULNESS TO THE OFFICE OF THE ACTUARY 216
CHAPTER 14. CONCLUSIONS 219
MODELING FUTURE HEALTH AND SPENDING 219
POLICY IMPLICATIONS 222
RECOMMENDATIONS 224
SUMMARY 226
REFERENCES 229
iv
Tables
Table 3.1: Suggested Breakthroughs in Cardiovascular Diseases 39
Table 3.2: Suggested Breakthroughs in Biology of Aging and Cancer 41
Table 3.3: Suggested Breakthroughs in Neurologic Diseases 43
Table 3.4: Suggested Breakthroughs of Interventions in Health Services 45
Table 4.1: Mortality From Coronary Heart Disease 50
Table 4.2: Accuracy of Electron-Beam CT for the Detection of High Grade Stenosis
and Occlusions of the Coronary Arteries 51
Table 4.3: Sensitivity and Specificity for Coronary Lesion Detection by Coronary MR
Angiography 52
Table 4.4: Results of Pig-to-Primate Heart Xenotransplantation 54
Table 4.5: Relative Risk of Cardiac Arrest or Death from Arrhythmia with Use of
ICD 57
Table 4.6: Evidence Table of Breakthroughs in Cardiovascular Diseases 62
Table 4.7: Role of Antibody in Cancer Therapy 65
Table 4.8: Role of Delayed-Type Hypersensitivity in Cancer Therapy 66
Table 4.9: Role of Cytolytic T Cells (CTL) in Cancer Therapy 66
Table 4.10: Potential Tumor Antigens 67
Table 4.11: Cancer Vaccines in Phase III Clinical Trials 68
Table 4.12: Selective Estrogen Receptor Modulators 69
Table 4.13: Case-Controlled Studies of Estrogen Replacement Therapy (ERT) and
Risk of Alzheimer’s Disease (AD) 71
Table 4.14: Cohort Studies of Estrogen Replacement Therapy (ERT) and Risk of
Alzheimer’s Disease (AD) and Dementia 72
Table 4.15: Selected Pre-Clinical and Clinical Studies on Tumor-Vasculature-Directed
Agents or Strategies 74
Table 4.16: Evidence Table of Breakthroughs in Cancer and the Biology of Aging 78
Table 4.17: Relevant Drugs for Alzheimer’s Disease Awaiting Approval or
Undergoing Phase 3 Trials 81
Table 4.18: Classes of Drugs in Preclinical or Early Clinical Development for the
Treatment of Alzheimer Disease (AD) 83
Table 4.19: Gene Mutations Identified in Familial Parkinson’s Disease 85
Table 4.20: Evidence Table of Breakthroughs in Neurologic Diseases 89
Table 5.1: Summary Results of Cardiovascular Diseases Medical Technical Expert
Panel 97
Table 5.2: Summary Results of Biology of Aging and Cancer Medical Technical Expert
Panel 103
Table 5.3: Summary Results of Neurological Breakthroughs Medical Technical Expert
Panel 107
Table 5.4: Summary Results of Health Services Technical Expert Panel 112
Table 6.1: Social Science Expert Panel 115
Table 7.1: MCBS Sample Size in each year from 1992 to 1998 126
Table 7.2: Prevalence of Select Conditions, MCBS Non-Institutionalized Population 127
Table 7.3: Comparison of Condition Prevalence between the MCBS and NHIS 128
Table 8.1: Sample Size and Medicare Reimbursement, by Year 136
Table 8.2: Frequency of Activity Limitations 137
v
Table 8.3: Average Medicare Reimbursement by ADL Counts 137
Table 8.4: Medicare Reimbursement by Self-Reported Health Status…………… … 138
Table 8.5: Medicare Reimbursement by Self-Reported Conditions ………….…….… 139
Table 8.6: Medicare Costs by Condition and ADL Counts …………………….…… 140
Table 8.7: Mean Medicare Costs by Aggregate Conditions & ADL Counts …… … 141
Table 8.8: OLS estimates from MCBS cost regressions……………………………… 143
Table 9.1: Prevalence and Incidence of Select Conditions, MCBS Estimation
Sample………………………………………………………………………………146
Table 9.2: Age Distribution, MCBS Estimation Sample.……………………………… 147
Table 9.3: Distribution of Sex, MCBS Estimation Sample …………………………. 147
Table 9.4: Distribution of Race, MCBS Estimation Sample … ……………………… 147
Table 9.5: Distribution of Hispanic ancestry, MCBS Estimation Sample …………… 147
Table 9.6: Distribution of Educational Attainment, MCBS Estimation Sample ……… 147
Table 9.7: Distribution of Ever Smoked, by Sex, MCBS Estimation Sample…… … 148
Table 9.8: Distribution of Currently Smoking, by Sex, MCBS Estimation Sample … 148
Table 9.9: Distribution of Marital Status, MCBS Estimation Sample…………………. 148
Table 9.10: Results of Health Transition Estimation (Log-hazard parameters) …….… 150
Table 9.11: Results of Health Transition Estimation (Relative risks)…………………. 151
Table 9.12: Results of Mortality Estimation (Log-hazard parameters and relative
risks)……………………………………………………………………………… 153
Table 9.13: Mortality Hazard Estimates (based on Vital Statistics and Differentially on
the MCBS)…………………………………………………………………………. 156
Table 10.1: Ordered Probit Model of Number of ADL Limitations…………………… 161
Table 11.1: Cancer prevalence by type from MCBS 1998…………………………… 171
Table 11.2: Cancer prevalence by type from MCBS 1998………………… ………… 177
Table 11.3: Disease Prevalence in 2030……………………………………… ……… 187
Table 11.4: Disease Prevalence in 2030…………………………………………….…. 190
Table 11.5: Disease Prevalence in 2030……………………………………………… 193
Table 11.6: Disease Prevalence in 2030……………………………………………… 195
Table 11.7: Disease Prevalence in 2030……………………………………………… 198
Table 13.1: Rates of Change in Size of Entering 65-year old Cohorts………………… 210
Table 13.2: Projected Aged Population in millions……………………………………. 210
Table 13.3: Medicare Expenditures for the Aged in billions……….…………………. 213
Table 13.4: FFS Per Capita Medicare Expenses for the Aged………………………… 213
vi
Figures
Figure S.1: Overview of the FEM Model 6
Figure 4.1: The Amyloid Hypothesis for Alzheimer’s Disease……………………… 80
Figure 4.2: Schematic Representation of Pathways to Cell Death Following Ischemic
Injury…………………………………………… ……………………………… 86
Figure 7.1: Overview of the FEM……………………………………… ……………. 130
Figure 9.1: Log-hazard of Mortality for Men with Selected Health Conditions………. 154
Figure 9.2: Log-hazard of male mortality based on Vital Statistics and the MCBS… 157
Figure 10.1: Population Transitions………………………… ……………………… 165
Figure 11.1: Eligible Population…………………… ………………………………… 172
Figure 11.2: Cancer Prevalence……………………………………………………… 173
Figure 11.3: Mean Age for Cancer Patients Under Base and TI Scenarios… ……… 174
Figure 11.4: Total TI Treatment Costs………………….…………………………… 174
Figure 11.5: Total Medicare Expenditures for Treating Cancer Patients…… ………. 175
Figure 11.6: Total Expenditures for Treating Cancer Patients……………… ………. 175
Figure 11.7: Total and Medicare Cost Differentials Between Base and TI Scenarios… 176
Figure 11.8: Eligible Population……………………………………………………… 178
Figure 11.9: Cancer Prevalence………………… ……………………………………. 179
Figure 11.10: Mean Age for Cancer Patients Under Base and CV Scenarios…………. 179
Figure 11.11: Total CV Treatment Costs……………………………………………… 180
Figure 11.12: Total Medicare Expenditures for Treating Cancer Patients……………. 180
Figure 11.13: Total Expenditures for Treating Cancer Patients……………… ……… 181
Figure 11.14: Total and Medicare Cost Differentials Between Base and CV
Scenarios…………………………………………………………………………… 181
Figure 11.15: Diabetes Prevalence………………… ………………………………… 183
Figure 11.16: Mean Age for Obese Elderly Under Base and DP Scenarios…………… 183
Figure 11.17: Total Treatment Costs for Diabetes Prevention………………… ……. 184
Figure 11.18: Total Medicare Expenditures for Treating Obese Elderly…………… 184
Figure 11.19: Total Expenditures for Treating Obese Elderly…… …………………. 185
Figure 11.20: Total and Medicare Cost Differentials Between Base and DP
Scenarios…………………………………………………………………………… 185
Figure 11.21: Death Rate Under Base and Compound Scenarios……………… ……. 187
Figure 11.22: Total Medicare Expenditure Under Base and Compound Scenarios …. 188
Figure 11.23: Total Expenditures Under Base and Compound Scenarios……………. 188
Figure 11.24: Total Treatment Costs………………………… ……………………… 189
Figure 11.25: Death Rate Under Base and Educ Scenarios…………………………… 190
Figure 11.26: Total Medicare Expenditures under Base and Education Scenarios…… 191
Figure 11.27: Total Expenditures under Base and Education Scenarios……………… 191
Figure 11.28: Hispanic Population Growth……………………………………………. 192
Figure 11.29: Death Rate Under Base and Obesity Scenarios………………………….193
Figure 11.30: Total Medical Expenditures Under Base and Hispanic Scenarios……… 194
Figure 11.31: Total Expenditures Under Base and Hispanic Scenarios……………… 194
Figure 11.32: Death Rate Under Base and Smoke Scenarios……………………… … 195
Figure 11.33: Lung-disease Prevalence Under Base and Smoke Scenarios………… 196
Figure 11.34: Total Medicare Expenditures Under Base and Smoke Scenarios………. 196
vii
Figure 11.35: Total Expenditures Under Base and Smoke Scenarios……………….… 197
Figure 11.36: Death Rate Under Base and Obesity Scenarios………………………… 198
Figure 11.37: Diabetes Prevalence Under Base and Obesity Scenarios……………… 199
Figure 11.38: Total Medicare Expenditures Under Base and Obesity Scenarios… …. 199
Figure 11.39: Total Expenditures Under Base and Obesity Scenarios………………… 199
Figure 11.40: Stroke Prevalence……………………………………………………… 202
Figure 11.41: Total Treatment Costs……………………………… …………………. 203
Figure 11.42: Total and Medicare Cost Differentials Between Base and CV
Scenarios………………………………………………………………………… 203
Figure 11.43: Eligibility for New Treatment…………………….…………………… 204
Figure 14.1: Disease Prevalence 219
Figure 14.2: Total Medicare Costs 220
Figure 14.3: Simulating Better Heart Disease Prevention Among the Young 220
Figure 14.4: Total Medicare Expenditures Under Base and Heart Scenarios 222
viii
EXECUTIVE SUMMARY
The Centers for Medicare & Medicaid Services (CMS) must generate accurate accounts
of present health care spending and accurate predictions of future spending. To obtain a
better method for deriving estimates of future Medicare costs, CMS contracted with RAND
to develop models to project how changes in health status, disease, and disability among the
next generation of elderly will affect future spending.
BACKGROUND
Predictions of future health care spending necessitate estimating the number and
sociodemographic characteristics of future beneficiaries who will be alive in each subsequent
year and the likely magnitude of their health care spending. The official projections of the
aged beneficiary population by age and sex currently used by CMS are taken from the
Trustees Reports of the Social Security Administration (SSA). These projections already
take into account two long-term trends: a decrease in age-specific mortality rates and a
significant increase in the over-65 population that will begin in the year 2010, due to the
aging of the baby boomers.
However, estimating future health care costs is more difficult. To increase the accuracy
of their current projections of health care costs, CMS would like to be able to rely on more
accurate estimates of future health care needs and expenditures. Estimates of future health
expenditures for an individual of a given age are full of uncertainty. Individual health
spending is a function of many factors: age, sex, health status, diseases and the medical
technology used to treat them, the price of care, insurance coverage, living arrangements, and
care from family and friends. Per capita estimates of spending are uncertain because they
depend on hard-to-predict changes in all these factors. Existing models do not attempt to
forecast specific treatment changes that will affect health status and future expenditures or
other key trends.
The trend that may be most controversial is the apparent delay in morbidity: many people
are staying healthy to older ages. As a consequence of this trend, it has been theorized that
the attendant functional limitations and costs of morbidity may be compressed into the last
few years of life, which could reduce health care costs. However, the expected savings from
compressed morbidity may be offset by the effect of extending life expectancy. Current
models account for the added cost of greater longevity that would result from reduced
mortality, but these models assume that health remains the same throughout life. However,
studies of particular diseases find that mortality gains follow from lifestyle changes, primary
and secondary disease prevention, and dramatic improvements in treatment. These factors
can result in a postponement of disease, disability, and proximity to death, i.e. a compression
of morbidity, which should offset the expected costs of extending life expectancy. Thus,
lower mortality rates might have less effect on expenditures than current models would
predict, although, clearly, not all treatment advances postpone morbidity or the need for
medical care.
1
The primary objective of the present study was to develop a demographic-economic
model framework of health spending projections that will enable CMS actuaries and policy
makers to ask and answer “what if” questions about the effects of changes in health status
and disease treatment on future health care costs. The model answers the following types of
questions:
• What are the future health expenditures for Medicare likely to be during the next 25
years if the trends of the last decade are taken as projections into the next decade, and
if disability among the elderly declines at a steady rate?
• How will the growth of future health care expenditures for the elderly be affected if
advances in the development of new diagnostic tools, medical procedures, and new
medications for chronic and fatal illnesses continue?
• How will the sociodemographic characteristics of the next generation of elderly
individuals affect future health care spending?
STUDY DESIGN AND METHODS
The study was conducted in four phases. Phase I consisted of a literature review, Phase
II was a technical expert panel (TEP) assessment, Phase III included the development of the
model, and in Phase IV, we applied the model to various “what if” scenarios.
Literature Review
During Phase I, we reviewed the current literature on trends in the health and functional
status of the elderly, the likely effects of new medical advances and treatments on morbidity
and mortality among the elderly, and the likely costs of new medical treatments. In what we
later refer to as the social science literature review, we also reviewed past efforts to model
the effects of changes in health status, risk factors, and treatments on health care
expenditures.
Expert Panel Assessments
During Phase II, we convened TEPs to provide guidance on the likely future advances in
the medical treatment of specific illnesses and the early detection and prevention of diseases.
We used a modification of the technical expert panel method developed at RAND to convene
four separate panels targeted at specific clinical domains: cardiovascular disease, the biology
of cancer and aging, neurologic disease, and changes in health care services. Using our
literature reviews, past experience with expert panels, and the advice of local experts, we
selected individuals who represented a broad range of clinical and basic science expertise.
The technical experts were surveyed to identify what they considered the leading
potential medical breakthroughs in each area, considering factors of potential impact and
cost. Based on these responses and our preliminary literature review, we selected a number of
potential breakthroughs in each of the four areas for further, in-depth review using the
2
procedures of evidence-based research. For each breakthrough, we identified the current
developmental status and potential barriers to implementation.
As part of Phase II, we also convened a fifth expert panel composed mainly of social
scientists from the fields of demography, epidemiology, health economics, actuarial science,
and operations research. The role of this panel was to help us determine the appropriate
health status measures and methodologies and to identify data sets for estimating model
parameters as well as the best modeling techniques.
Development of the Future Elderly Model
During Phase III, with the guidance of our social science technical expert panel, we
developed a demographic-economic model, the Future Elderly Model (FEM). The FEM is a
microsimulation model that tracks elderly, Medicare-eligible individuals over time to project
their health conditions, functional status, and ultimately their Medicare and total health care
expenditures. The FEM was intended to serve two purposes. First, it was to be used to
answer the question, “If current health status and disability trends continue, what will be the
costs to Medicare for treating the elderly?” Second, it was to be used to simulate and
evaluate a variety of scenarios regarding the future health care environment. The FEM we
developed actually combined three individual models: a model of health care costs, a model
of health status transitions, and a model to predict characteristics of future, newly-entering
Medicare enrollees (the “rejuvenation” model).
Data. The FEM starts with data from the Medicare Current Beneficiary Survey (MCBS),
a nationally representative sample of beneficiaries aged 65 and older, as the host dataset (the
dataset consisted of individuals who turned 65 and participated in the MCBS from 1992
through 1998). The MCBS is an interview survey designed to ascertain utilization and
expenditures for the Medicare population, particularly expenditures borne by the beneficiary
or by supplemental insurance. The survey sample is a large, nationally representative
population of Medicare beneficiaries who are interviewed some 12 times over a three-year
period. The data set contains detailed self-reported information on height, weight, the
prevalence of various conditions, measures of physical limitations in performing activities of
daily living and instrumental activities of daily living, and health service use, as well as
Medicare service use records. The sample size for individuals 65 and older in 1998 with
complete records was 10,881. Each sample member’s data are weighted to take into account
the number of beneficiaries in the Medicare population that that member represents.
Our data set also included only MCBS respondents who participated in two or more
consecutive survey waves. The outcome measure was based on pairs of consecutive
interviews. In order to ensure that we were examining the transition from good health to a
disease state, only individuals who did not report a specific condition at the initial interview
were included—i.e., among people without a condition, we modeled the likelihood they got
the condition in the next year.
Health Status Transition Model. The FEM then predicts the health conditions and
functional status of the baseline sample for the next year (reweighting to match the health
status trends from the National Health Interview Survey (NHIS) and the Census population
3
projections). To project the health transitions, a discrete piece-wise linear hazard model was
estimated. The hazard of getting disease and dying depends on risk factors (gender,
education, race, ethnicity, education, obesity, ever having smoked); other conditions if
medically warranted; functional status; and age (piecewise-linear spline, node at age 77). The
model did not control for household income or for current smoking behavior, since doing so
would require projection models of future income and smoking behavior, respectively. A
similar model was used to predict functional status and nursing home residency. We treated
all health states as “absorbing”—i.e., once people got an illness they had it forever and could
therefore not get it —and modeled transitions into the states. This is consistent with the
definitions in the data (“Has a doctor ever told you…”) and most of the chronic diseases
(diabetes, heart disease, etc.). For some conditions such as functional status, recovery is
possible; therefore, the hazard model would overestimate their prevalence.
Sample Rejuvenation. As our initial sample ages, it becomes less representative of the
entire over-65 population; thus, we “rejuvenated” our sample yearly (through 2030) with a
newly entering cohort of 65-year-olds.
Cost Modeling. Finally, the FEM predicts costs. The cost estimations were based on
pooled weighted least squares regressions with total Medicare reimbursement and total
healthcare reimbursement as the dependent variables, and health status measures, self-
reported disease categories, and interactions of health measures and disease conditions as the
independent variables. The model was calibrated to replicate the total healthcare and
Medicare expenditures for the elderly sample represented by the MCBS.
All FEM costs are in 1998 dollars and are adjusted for inflation, but not for cost of living
and changes in the economy. The FEM does not include supply-side factors (e.g. physician
supply) or changes in insurance coverage. We dropped Medicare HMO enrollees and
assumed that all Medicare beneficiaries were covered under Medicare FFS in our estimation,
which may overestimate the total costs if HMOs actually save money compared to FFS.
However, the difference will not be substantial, because only five percent of Medicare
beneficiaries were covered under Medicare HMO in the years 1992 through 1998. The FEM
also does not model the shifts from inpatient to outpatient services. Finally, we assumed that
every beneficiary had both Medicare Part A and Part B, in predicting future Medicare costs.
Our choice of health status measures was designed to meet several competing goals.
First, we needed measures that could be used to predict costs. Second, our measures had to
capture clinically relevant diseases that would be useful for predicting the effects of the
breakthrough technologies. Third, the measures had to be readily available in the MCBS and
any other data sets we would use to provide estimates for the microsimulation, for example,
the NHIS. The health status measures were based on self-reported health conditions and
disability. The conditions on which we decided to focus were the ones selected earlier by our
expert panels as having the greatest potential for breakthroughs; these conditions are also the
ones most prevalent in the elderly population and the most costly to treat. The models are
integrated by first estimating costs for the representative cohort. We then “age” them one
4
year using the health status model, introduce the new 65-year-olds, and then estimate costs
again. This process is repeated for each year until a terminal date is reached.
The What-If Scenarios
Finally, during Phase IV, we considered the implications of a number of potential health
care scenarios suggested by the experts—including potential breakthrough technologies as
well as changes in lifestyle and the health care system—by exploring changes in the
parameters of the model via “what if” modeling.
RESULTS
The Potential Breakthroughs.
From the lists of suggested breakthroughs in future health care, our technical expert
panels identified 33 key potential breakthroughs for further review. These breakthroughs
spanned the areas of improved disease prevention, more precise risk stratification and earlier
detection of subclinical diseases through improved imaging and genetic profiling; better
treatment for established diseases through biomedical engineering, cell biology, and genetic
engineering; and changes in lifestyle and care management. For each breakthrough, the
panels assessed the eligible (target) patient population, likelihood of implementation within
10 and 20 years, impact, and cost. The breakthroughs are listed in Table S.1.
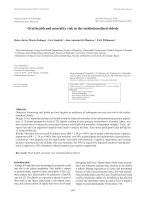
The Future Elderly Model.
The first step in creation of our microsimulation model was to estimate health transition
models for each individual. We then estimated future health transitions. Figure S.1 depicts
how the cost models, transition models, and rejuvenation models are integrated into the
microsimulation model.
5
Figure S.1
Overview of the FEM Model
“1998” MCBS
host data
(age 65+)
1998
costs
C
t
=C(H
t
,X
t
)
1999 health
status data
(age 66+)
“1998” MCBS Age 65 Rejuvenation Sample
New age 65
W
t
=W(t)
H
t+1
=H(H
t
,X
t
)
Deceased
Survivors
2000 health
status data
(age 66+)
New age 65
W
t
=W(t)
H
t+1
=H(H
t
,X
t
)
Deceased
Survivors
H
t+1
=H(H
t
,X
t
)
Deceased
Survivors
Etc.
1999
costs
C
t
=C(H
t
,X
t
)
2000
costs
C
t
=C(H
t
,X
t
)
We assessed the baseline health care characteristics for the cohort of individuals age 65
and older in the 1998 MCBS data set and used these findings to predict per capita
expenditures for that year. We then assessed the yearly health and functional status and
projected the conditions and health care costs of the survivors for each subsequent year. As
people became deceased, they were removed from the cohort. Likewise, each year, the
sample was “rejuvenated” by the addition of a pool of new beneficiaries who turned 65.
Determinants of Health Care Expenditures (the Cost Model).
Using MCBS data, we explored how alternative measures of health and disability affect
expenditures. Reporting one or more functional limitations (assessed as activities of daily
living [ADL]), residing in a nursing home, and having one or more chronic diseases were
associated with higher expenses. Although none of these measures necessarily explains or
predicts costs, the combination of ADLs and chronic diseases provides a more accurate
assessment of spending. Likewise, self-reported health status was highly correlated with
health expenditures; however, the social science TEP cautioned us against considering this
measure for a forecasting model, as treatment breakthroughs are difficult to translate into
changes in self-reported health status.
Our final cost model included demographics and measures of physical health.
Demographics included such factors as age, gender, ethnicity, education, and geographical
area of residence. Measures of physical health included self-reported health status, ADL
categories (including nursing home residence), chronic diseases, and interactions of these
measures.
6
Ever having smoked, residing in the northeast, mortality, obesity, and physical health
status (measured by number of ADLs and admission to nursing home) had considerable
effects on expenditures. Consistent with the literature, individuals who die during the year
have substantially higher medical expenses than survivors. Medical expenditures increase
with age, until about age 85. Lower expenditures among the oldest old may reflect biological
differences among those who have survived to that age as well as less aggressive medical
treatment. We also find that costs increase substantially with ADLs, particularly 3 or more.
The interactions of ADLs and disease vary in magnitude and significance, both in this model
and others.
Determinants of Health Status: the Health Status Transition Model.
Using the Health Status Transition Model revealed a set of factors that increase the risk
for a variety of chronic conditions, decreases in ADL, and nursing home residence:
• Men tend to have higher risks of cancer and heart disease and lower risks of
hypertension, arthritis, and disability than do women.
• Blacks and Hispanics have higher risks of hypertension than do Caucasians.
• Hispanics also have higher risks of diabetes than do Blacks or Caucasians.
• Hispanics are far less likely than non-Hispanics to enter a long-term care facility
such as a nursing home.
• Better-educated individuals tend to be in better health.
• Having ever smoked increases the risk of cancer, stroke, lung disease, and
disability, but not by very much and only marginally significantly for cancer.
• Co-occurrence of two or more health conditions tended to increase the risk for
certain other conditions significantly, for example, diabetes and hypertension
significantly increased the risk of developing a heart condition.
We also estimated the effect of a variety of health conditions on the risk for mortality.
Cancer, heart disease, stroke, Alzheimer’s disease, lung disease, and disability (low ADL
score) were associated with an increased risk of mortality, whereas arthritis was associated
with a decreased risk.
The Health Status of Future Medicare Users.
Using data from the NHIS, we then created a model to predict the health status of future
cohorts of Medicare beneficiaries between the years 2001 and 2030. We considered seven of
the chronic conditions most prevalent among the elderly – heart disease, hypertension,
cerebrovascular disease, Alzheimer’s’ disease, cancer, diabetes, and chronic obstructive
pulmonary disease – as well as physical disability. Unfortunately, the NHIS provides each
7
age cohort with a unique list of conditions from which to choose; thus, respondents cannot
select the conditions they have had from the full list of conditions. Our prediction strategy
consisted of four steps. In the first step, we used the NHIS data to obtain age-specific
prevalence rates for the conditions of interest. These prevalence rates were smoothed to
produce noise-free estimates of the incidence of low-prevalence diseases. In the second step,
we used a synthetic cohort approach to estimate an age-incidence profile for each disease
from the smoothed prevalence estimates. In the third step, we used the prevalence and
incidence functions to generate our projections of the health status of future Medicare
entering cohorts. The method is based on the idea that for any given future year, we know the
current age of the entering cohort for that year. Finally, in the fourth step, we constructed
population-weighted estimates to predict the co-occurrence of several diseases in the same
individuals, in order to predict future expenditures more accurately.
Consideration of Future Scenarios.
We modified our FEM to simulate the impact on expenditures of a variety of likely
scenarios or breakthroughs proposed by our expert panels. We then compared projected
expenditures without the scenarios or breakthroughs (the “baseline” situation) with our
estimates of expenditures following the breakthroughs over the course of the first 30 years of
the 21
st
century. To assist in this effort, the expert panels identified eligible populations,
likelihoods of occurrence, costs, and estimates of impact on morbidity and mortality for most
of the technologies.
The use of telomerase inhibitors (TI) to treat cancer. We modeled the potential effects
of the use of a class of cell-replication inhibiting chemicals known as telomerase inhibitors
(TI) to treat cancer. The results of our model suggested that TI would reduce the prevalence
of cancers considerably: those who received treatment and were cured or whose cancer was
controlled would experience an increase in life expectancy. Although TI would increase total
expenditures on the elderly, they would not greatly increase Medicare spending. However,
we did not consider several factors, such as cancer type: TI works only on solid tumors and
less well on metastatic cancer than on localized cancer.
The use of cancer vaccines. We also modeled the possible effects of the introduction of a
cancer vaccine, which could be used against all types of cancers. Cancer vaccines would
have a large effect on cancer prevalence while modestly increasing Medicare costs, largely
due to prolongation of life. However, we did not include melanoma in our simulation:
because the vaccines could cure melanoma, their impact on prevalence and related
expenditures would be larger than our results suggest.
The use of a drug to prevent diabetes. The third scenario we modeled was the use of an
insulin sensitization drug to prevent type II diabetes. It is expected that of the 80 million
obese people (obesity being defined as a body mass index over 30) in the United States, some
10 percent will develop type II diabetes; we assumed that 30 percent of elderly obese people
would develop diabetes. The prevalence of diabetes among the elderly is expected to rise by
about 12 percent from 2001 to 2030. Over 5 years, our model showed, the drugs would
prevent over 50 percent of new cases of diabetes. Making a number of assumptions, such as a
8
reduction of 65 percent over 10 years and a treatment rate of only 30 percent (with random
targeting of treatment), we found only modest effects. The drug would reduce prevalence by
only about one percent, in part due to the large size of the obese diabetic population. The
drug had little effect on Medicare expenditures, particularly over the long-term where the
drug would be expected to increase life expectancy.
The effect of extending lifespan. We modeled the possible impact of a not-yet-identified
compound that would extend life span by mimicking the effects of long-term reduction in
caloric intake. This scenario is based on findings from the 1970s that chronically reducing
rodents’ energy intake prolonged their lives. According to our simulation, if begun early
enough (around the age of 35), the treatment would extend life expectancy by 10 to 20 years.
With no concomitant improvements in health status, disease prevalence and Medicare costs
would increase substantially. However, based on the findings from the animal model, the
incidence of several diseases, including cardiovascular disease and some types of cancer, is
reduced or at least delayed, raising the prospect of compressed morbidity and its attendant
costs.
The effect of increasing education level. We also modeled the potential impact of an
increase in the average level of education of the future Medicare population. We considered
two possible scenarios: 1) after 2002, everyone who became Medicare-eligible had a college
degree, or 2) after 2002, the education level of each Medicare-eligible person increased one
level (for example, persons with some high school education became high school graduates,
high school graduates now had some college education, etc.). Whereas neither scenario was
realistic, they showed how the FEM incorporated information about education and could be
used to project the impact on health status, Medicare expenditures, and total health care
costs. Increasing educational attainment resulted in a decrease in death rate and in the
prevalence for a number of diseases but higher Medicare and total expenditures; however the
differences in expenditure were small.
The effect of changing ethnicity. We modeled the possible effects of a continued
increase in the Hispanic population. Between 2000 and 2030, the proportion of the U.S.
population that is made up of Hispanics is expected to grow from 11 percent to 19 percent.
This increase is expected to result in an increased mortality rate, an increase in the prevalence
of particular diseases such as heart disease, diabetes, arthritis, and hypertension, and a
decrease in the prevalence of cancer, stroke, lung disease, and nursing home use. However,
our simulation assumed that the future Hispanic population would have demographic and
socioeconomic status similar to the current Hispanic population.
The effect of decreasing smoking rates. We modeled the potential effect of a decrease in
the rate of smoking among new Medicare beneficiaries to zero as of 2002. From 2002 to
2030, the death rate among Medicare beneficiaries would decrease by 4.3 percent. Whereas
the prevalence rates for a number of diseases would change (for example, the lung disease
prevalence would fall by 8 percent) with the decrease in smoking, the decrease in mortality
rate would also alter the disease prevalence. The reduction in smoking would result in a
decrease in Medicare and total health care expenditures, with a savings to Medicare alone of
$434 billion dollars. Whereas we realize these two scenarios are unrealistic, more modest
9
decreases in the rate of smoking might still alter disease prevalence and Medicare
expenditures; the FEM could be used to predict their magnitude.
The effect of decreasing obesity rates. We also modeled the potential impact of a
decrease in the rate of obesity among Medicare beneficiaries. We considered two scenarios:
no one entering Medicare after 2002 is obese and 2) after 2002, no Medicare beneficiary is
obese. Neither scenario resulted in a decrease in the mortality rate. Nevertheless, the
prevalence of a number of diseases, including arthritis, diabetes, and heart disease decreased.
Initial differences in the magnitude of the decreases between the two scenarios diminish over
time as cohorts who entered prior to 2002 leave the population through death. Our model
showed that the unrealistically extreme measure of eliminating obesity reduced Medicare and
total expenditures only minimally, suggesting that more modest improvements in weight
control would have a smaller effect.
The effects of changes in diagnosis and treatment of cardiovascular diseases. Finally,
we modeled the application of eight different emerging technologies to the diagnosis and
treatment of cardiovascular diseases. In this simulation, beneficiaries were randomly
assigned to a treatment based on the probabilities estimated by the expert panel, and it was
assumed that each beneficiary would receive only one such treatment. Our model showed
that with the exception of stroke, the disease prevalence was unaffected by the treatments:
the prevalence of stroke decreased relative to the baseline. Nevertheless, the costs of treating
cardiovascular diseases are likely to continue to increase over those of the baseline. A major
limitation to this simulation was that we had no information on the predicted effects of the
technologies on health outcomes, only on hospitalization and use of procedures.
CONCLUSIONS
This project served several purposes. First, it identified possible breakthroughs that could
greatly affect the future health of and expenditures on behalf of the elderly. Second, we
developed a microsimulation model that can be used to quantify the impact of these
breakthroughs and other scenarios of interest to CMS and other policy makers. The model is
flexible enough to consider life extensions and the interaction of treatment with disease, and
it incorporates what is known about the health of future cohorts. Several key policy issues
and recommendations arise as a result of this work.
Modeling future health and spending
Under the status quo (health status and disability trends defined by technology and risk
factors of the elderly population in the 1990s), we predicted a particular disease prevalence
and Medicare costs in the next 30 years, which we called the base scenario. In the base
scenario, we held the health transitions and risk factors in the elderly population constant, so
the variations in disease prevalence and costs came from two sources: the health status of
entering 65-year-olds and the population growth. Under the base scenario, the Medicare
expenditures will reach $360 billion dollars in 2030.
10
Breakthroughs in medical technologies or changes in risk factors in the elderly population
change the health status transitions and the cost projections. Therefore, we can simulate the
effects of medical breakthroughs and changes in risk factors on disease prevalence and costs
by altering the health status transition parameters or risk factors among the elderly according
to the assessments from the expert panel. The difference in disease prevalence and costs
between the base scenario and the scenario with the breakthroughs will be solely due to the
breakthroughs, because we hold other factors constant. In a hypothetical example,
eliminating heart disease among the entering 65- year-olds would result in a decrease in the
prevalence of heart disease and total Medicare costs. But the mechanism is far more
complicated because of the interactions between all diseases, disability, and death in the
health status transitions. In this case, eliminating heart disease among the young directly
reduces costs, the hazards for death, stroke, disability and nursing home residence, but the
lower death rate results in an increase in the risk for other conditions and in life expectancy,
both of which result in higher costs. The FEM explicitly models these interactions and
provides estimates of the net effects. Thus, eliminating heart disease among the young
reduces heart disease prevalence by about 20 percentage points in 2030 and saves Medicare
$328 billion dollars over the next 28 years. However, it also increases the prevalence of
cancer, stroke, diabetes, hypertension, lung disease, and arthritis, increases the prevalence of
disability (ADL1+ and ADL3+), and has no significant effects on the prevalence of
Alzheimer’s and use of nursing home care. The model can be used to quantify the future
ramifications of changes in demographic trends and in patient behaviors and certain types of
changes in medical technologies.
Implications of the Panel Findings
In the first part of this project, nationally recognized experts identified the most important
potential breakthroughs in four areas: cardiovascular disease, biology of aging and cancer,
neurologic disease, and health services. They provided estimates about the likelihood that a
breakthrough could occur, the potential impact of the breakthrough, and the potential cost
implications. Their work provides important insight into the future of medicine as it affects
the elderly. Several themes emerged from their deliberations:
11
Improved disease prevention. Improved prevention of disease was the subject of
breakthroughs in all three of the medically focused panels. These breakthroughs include the
prevention of cardiovascular disease, the prevention of a variety of cancers with the use of
selective estrogen receptor modulators, the prevention of diabetes through the use of new
insulin sensitizing drugs and the prevention of Alzheimer’s disease and Parkinson’s disease
through several different mechanisms. Nearly all of these breakthroughs have relatively low
costs on a per-person basis. However, because the interventions would need to be applied to
very large populations, their cumulative costs are high. Counterbalancing these increased
costs is the improvement in the direct cost of the care related to the prevented condition and
improvements in morbidity and mortality.
Better detection or risk stratification of people with early disease. The health and
expenditures of the future elderly could be dramatically affected by better detection of
subclinical disease or early clinical disease. Breakthroughs in this area were identified by
two panels: the cardiovascular panel and the health services panel. In both cases, the
breakthroughs involve better detection of people at higher risk than the general population
for worse outcomes from the chronic conditions of cardiovascular disease, depression,
osteoporosis, diabetes, vision and hearing impairments, dementia, and urinary incontinence.
The Human Genome Project is expected to vastly increase our ability to genotype people and
determine their susceptibility to disease. Improved imaging should also increase our ability to
detect subclinical disease. The concept behind this breakthrough is that better detection of
subclinical disease or early clinical disease will allow for better targeting of effective
therapies, to try to ameliorate the progression of morbidity and mortality associated with the
diseases.
Better treatment for patients with established disease. Breakthroughs in many different
disciplines are likely to influence the treatment of established diseases.
Advances in biomedical engineering were identified by the cardiovascular panel as being
especially critical. These included the development of intraventricular cardiodefibrillators,
left ventricular assist devices, and improvements in atrial pacemakers and defibrillators. In
general, these technologies would be extraordinarily expensive on a per-person basis but
would necessarily be applied to only a limited number of patients with very advanced
disease.
Medical breakthroughs targeting genes or specific cells are also likely to have important
consequences. Examples of these breakthroughs were identified by all three of the medical
panels and include the manipulation of angiogenesis (neovascularization, or, the growth of
new blood vessels), to stimulate it in patients with poor cardiac circulation and to inhibit it in
patients with the neo-vascularization associated with the growth of cancer, vaccines to
control cancer and Alzheimer’s disease, and the use of small molecules targeting specific
enzymes thought to be important in the development of Alzheimer’s and the continued cell
proliferation that is characteristic of cancer. All of these breakthroughs tended to be of
moderate cost, consistent with existing new drug therapies.
12
Breakthroughs in cell or organ transplantation could be much more costly. These include
the use of xenotransplants for people with failing hearts and the use of stem cell
transplantation for patients with Parkinson’s disease or acute stroke. These breakthroughs
tended to be very expensive on a per-person basis and also face a host of ethical and
technological challenges to successful implementation.
Lastly, a variety of breakthroughs identified by the health services panel consisted of
changes in the organization and delivery of healthcare that could improve the receipt of
effective services by persons at risk for or with established diseases. Better care management
includes increasing the use of known effective interventions, better care coordination, better
medication management, and improved home environment. And perhaps most importantly,
changes in lifestyle could have the most dramatic consequences for the health and medical
expenditures of the future elderly. These changes include increases in physical activity,
decreases in obesity, healthful modification of diet composition, cessation of cigarette
smoking, and moderation in the use of alcohol. All such changes would be substantially cost
saving.
Implications of the Results of Our “What If” Scenarios
As shown in the simulations of “what if” scenarios, the existing FEM can be directly used
to assess the future ramifications of changes in demographic trends (e.g. better-educated
future elderly and rise in Hispanic population) and in patient behaviors (trends in risk factors
such as smoking and obesity) because these factors are explicitly built into the FEM as
covariates in the hazard models.
For changes in medical technologies in the areas of primary prevention (e.g. technologies
for disease immunization) and secondary prevention (e.g. screening tests), FEM can also be
applied with only minor modifications. Examples include technologies that can eliminate
heart disease among the young, a compound that extends life span, and diabetes prevention
via insulin sensitization drugs.
For certain types of changes in medical technologies, moderate modifications need to be
made to the FEM with detailed information on eligibility and the impact of these
technologies on health status and costs. Examples include the development of telomerase
inhibitors, cancer vaccines, and treatments for cardiovascular disease in the simulation
scenarios.
For other types of changes in medical technologies and changes in the health care system,
the existing FEM would need to be modified substantially. Examples include better care
coordination, better medication management, and environmental improvements.
Our approach was broadly supported by our social science expert committee. The policy
community generally has been interested in this approach as well, especially technical
advisors to Medicare trustees, because of its great policy relevance: These potential
breakthroughs could have important effects on future health conditions and health care
expenditures, and the FEM could help CMS and other government agencies evaluate these
13
effects as well as the effectiveness of corresponding policies. But FEM cannot replace the
existing baseline forecasts developed by the CMS Office of the Actuary (OAct) and can only
serve as a tool for evaluating specific trends or breakthroughs.
One limitation to our what-if scenarios that needs to be considered is that the panels did
not adopt uniform definitions for likelihood of occurrence or adoption. The first panel had a
difficult time assessing the likelihood of adoption, with estimates ranging in some cases from
0 to 100 percent. The reason for this range is that some interpreted “likelihood of adoption”
as the likelihood that even one person would receive a treatment, whereas others interpreted
the term to mean the likelihood that any eligible person would receive it (which would be
close to the prevalence rate). After clarification of the term to refer to the likelihood of this
procedure being an important part of clinical practice, subsequent panels estimated much less
variable rates of adoption. Variation also existed in the definition of likelihood of
occurrence (for a breakthrough). Technologies with a low probability of occurrence clearly
would have been of less importance than those with higher probabilities. Thus we did not
consider the estimated likelihood of occurrence but rather the impact conditional on
occurrence in our simulations.
Evaluating the Usefulness of the FEM
We considered a number of aspects of the FEM in assessing its likely utility to the OAct.
These aspects included population projection, expenditure projection, econometric
methodology, and “what-if” modeling.
Population projection. Population projections are based on starting population, mortality
rates, migration, and fertility patterns (for a variety of reasons, the latter two factors can be
disregarded for this report).
The FEM used Census data to determine the size of each entering cohort. In contrast, the
population projection on which the OAct models are based is generated annually by the
Office of the Actuary at the Social Security Administration (SSA). The SSA includes three
populations excluded by the Census: those missed by the Census, those residing in territories
and outlying areas, and military personnel and dependents residing overseas. Thus, SSA
estimates of current population are higher than those of the Census. However, the FEM also
assumes all individuals 65 years and older are covered by Medicare Parts A and B, resulting
in a small (approximately 3 percent) overstatement of the Medicare population and costs.
The FEM and SSA estimates of mortality also diverge, due to differences in their
projections of mortality improvement. The most recent SSA projections assume a decline in
the death rate through the year 2030, based on a set of implicitly assumed medical advances
and an analysis of historical trends in the causes of death. In contrast, the FEM baseline
projections are based on MCBS data from the 1990s and no further improvement in medical
technology or mortality rates.
Expenditure projections. We compared our projected expenditures based on the FEM to
those of the Medicare Trustees’ Report for 2002, making appropriate adjustments.
14
The FEM is based on four sets of projections with dependent variables for total
Medicare expenditures, Medicare Part A payments, Medicare Part B payments, and Medicare
Part A and Part B payments. However, the FEM model estimates per capita expenditures
only for those with both Part A and Part B. The FEM also includes cases with less than 12
months enrollment (often due to death).
According to the CMS projections, Medicare expenditures will grow at a rate far
exceeding that predicted by the FEM, even after adjusting for inflation and population
growth. The only factor causing an increase in baseline projected per capita Medicare
expenditures is the aging of the 65 and older population. The growth in the Trustees’ Report
projections is based on a number of implicit advances in medical technology that result in
increased per capita costs. These advances are handled in a more explicit fashion by the
FEM and are not considered to be part of the baseline. A baseline concept where there are no
changes in the underlying morbidity and mortality cannot be reasonably expected to occur.
Put differently, the FEM baseline is what would occur under the status quo of medical
technology, a potentially useful concept for “what-if” modeling (since it allows us to choose
the changes we wish to test), but not necessarily for actuarial purposes. The central concept
of the OAct baseline is that it is based on the scenario most likely to occur, according to
general trends in morbidity and mortality. It is these conflicting concepts of baseline that
make any direct comparison between the two difficult. The modeling of a “what-if” scenario
that mimics the assumptions in the OAct baseline would help bridge this gap.
Econometric methodology. The FEM modeled transitions into a variety of health states,
using proportional hazards modeling. The transition probabilities are based on a variety of
independent variables including age, sex, race, education, and other medical conditions. The
results are consistent with epidemiological findings and clinical intuition.
“What-If” scenarios. The “What If” Scenarios summarized above illustrate one of the
most useful features of the FEM to the Office of the Actuary, namely the ability to model the
potential effects on future costs of a variety of hypothetical or likely trends in medical
technology, health care services, and demographics. However, we realize that the current
utility of the model is limited because of the differences in baselines and expenditure
projections enumerated above.
Conceptually, these differences could be bridged by adopting specific scenarios in
which the FEM-projected death rate decreases similarly to that projected by the SSA, using it
as a baseline, and analyzing “what if” scenarios relative to such a baseline. However, the
work required to produce a suitable baseline would be substantial and the analytical problems
to be overcome would be non-trivial.
Several other changes to the FEM would also make it more suitable to the OAct.
These include modifying the calculations of Medicare costs (using the same categories of
services as does CMS) and the choice of dependent variables.
15
Recommendations
Expand the expert panel process. Our expert panel process seems to have merit, but
more assessment is needed. Ideally, this process would be made more formal and would be
repeated at regular intervals. The choices made by this panel (and perhaps the alternatives
they deem best) would be reviewed regularly. One alternative might include organizing
panels by research areas, e.g., bioengineering or stem cells, rather than by disease type, so
that experts can provide more detailed and reliable information about the breakthroughs in
their areas of specialization. Key themes should be reviewed regularly. Scenarios would
incorporate updated information and then make changes accordingly because of the rapidity
of technological development.
Integrate the FEM into the OAct. The FEM is an innovative tool and produces
interesting results that will be useful in several policy venues. The FEM is especially useful
as a tool for conducting “what if” simulations that explain what might happen with explicit
changes in demographics and medical technology. It could be used by the OAct to answer
questions about specific medical technologies. However, for it to be useful, the model needs
to be kept up-to-date with recent MCBS and NHIS data.
Model complex scenarios. Some of the technologies identified in this report may have
spillover effects, that is, therapeutic benefits in more than one area. For example, the use of a
“longevity pill” that mimics caloric restriction might lower the risk of a number of diseases,
in addition to extending life span. More information from the expert panels about joint
probabilities and treatment scenarios would be useful. We rely on the literature review and
the panel assessments to quantify these effects precisely; such quantification needs to be
done on a case-by-case basis. Past assessment of novel technologies could also assist in this
effort.
Model technology diffusion. The ultimate impact of a technology depends on its timing
and its price, both of which are difficult to forecast, are interrelated, and influence its
diffusion. For instance, our “longevity” pill could be very expensive and have only a few
users, or it could be very inexpensive and have many users. The ultimate diffusion of such a
pill would also affect the “price” of services for treating cardiovascular disease and diabetes.
But it is unclear how to forecast future prices in the context of our model. The panels
recognized, but could not predict, that costs of a procedure will fall over time with higher
rates of adoption. In fact, costs are affected by both supply and demand factors. On the
supply side, the marginal cost will fall as quantities rise, because the production technology
will get more efficient. In addition, demand will increase as the price rises. Thus, from a
modeling perspective, scenarios that envision high rates of use need to adjust prices, even if
it is ad hoc.
The price also has implications for when the breakthrough enters into clinical practice. In
the FEM, we hold the transition matrix constant until some assumed date of discovery and
then apply the new transition matrix for all successive periods. It might be useful to allow
for uncertainty by performing the modeling process for several different values of time to
discovery, where the set of times is drawn from a probability distribution. However, given
the speculative nature of these estimates, sensitivity analysis should be sufficient. For
16
example, we can explore high and low estimates of impact as well as simultaneous
consideration of different scenarios.
Information from the expert panels might also be used more formally, although the first
panel had a difficult time assessing the likelihood of adoption for a number of breakthroughs.
In many instances, their estimates ranged from 0% to 100%, which may have resulted in part
from some confusion over the meaning of these probabilities. Some panel members may
have interpreted them to be the probability that at least one person will be treated using these
methods in the future, whereas others may have interpreted them as the likelihood that any
eligible person would receive this type of treatment. The latter is much closer to a prevalence
rate.
Model recovery. Some of the health states in the MCBS might allow for recovery,
including disability and nursing home entry. Even some of the health states such as cancer
might allow for a “cure” after a 5-year survival. Recovery could be modeled in several ways.
Since it is hard to predict who will recover, the easiest method is to examine the raw
probabilities of people leaving states in subsequent years. This method is the opposite of the
estimation underlying the FEM in modeling health transitions: it would look at the year-to-
year changes in the fraction of people with a disease or functional state who do not report
having it in a subsequent year, for example, the percentage of people with one or more ADL
who report having none the subsequent year. One would then randomly allow the simulation
sample to recover from that health state by drawing a random sample with the same
percentage as in the actual data.
Collect additional information in the Medicare Current Beneficiary Survey. Our
modeling exercise showed some of the unique benefits of the MCBS. The link between self-
reported information and claims and enrollment information in Medicare is particularly
useful. The MCBS has the disadvantage of containing poor economic data: in particular,
employment, income, and wealth. Information on these economic factors would greatly
improve the range of useful scenarios since one could consider key economic trends.
Furthermore, some self-reported information about disease and its treatment, e.g., whether
people had angioplasty or were taking oral hypoglycemics, would also allow much better
links between claims data and self-reported information.
FINAL THOUGHTS
At the core of this project was the development of the FEM. The FEM is a
microsimulation model that tracks individuals over time to project health conditions,
functional status, and ultimately Medicare and total health care expenditures for the elderly.
This approach was broadly supported by a national panel of social science experts. The
policy community generally has been interested in this approach as well, especially technical
advisors to Medicare trustees because of its great policy relevance. These potential
breakthroughs could have important effects on future health conditions and health care
expenditures, and FEM could help CMS and other government agencies to evaluate these
effects and even the effectiveness of corresponding policies. Ultimately though, this project
was a feasibility exercise: Could one forecast future medical breakthroughs and then simulate
17