ALDEHYDE AND OTHER VOLATILE ORGANIC CHEMICAL EMISSIONS IN FOUR FEMA TEMPORARY HOUSING UNITS – FINAL REPORT pdf
Bạn đang xem bản rút gọn của tài liệu. Xem và tải ngay bản đầy đủ của tài liệu tại đây (9.95 MB, 61 trang )
LBNL-254E
ERNEST ORLANDO LAWRENCE
BERKELEY NATIONAL LABORATORY
ALDEHYDE AND OTHER VOLATILE ORGANIC CHEMICAL
EMISSIONS IN FOUR FEMA TEMPORARY HOUSING
UNITS – FINAL REPORT
Randy Maddalena, Marion Russell, Douglas P. Sullivan,
and Michael G. Apte
Environmental Energy
Technologies Division
November 2008
DISCLAIMER
This document was prepared as an account of work sponsored
by the United States Government. While this document is
believed to contain correct information, neither the United
States Government nor any agency thereof, nor The Regents of
the University of California, nor any of their employees, makes
any warranty, express or implied, or assumes any legal
responsibility for the accuracy, completeness, or usefulness of
any information, apparatus, product, or process disclosed, or
represents that its use would not infringe privately owned
rights. Reference herein to any specific commercial product,
process, or service by its trade name, trademark, manufacturer,
or otherwise, does not necessarily constitute or imply its
endorsement, recommendation, or favoring by the United
States Government or any agency thereof, or The Regents of
the University of California. The views and opinions of authors
expressed herein do not necessarily state or reflect those of the
United States Government or any agency thereof, or The
Regents of the University of California.
Ernest Orlando Lawrence Berkeley National Laboratory
is an equal opportunity employer.
LBNL-254E
Aldehyde and other Volatile Organic Chemical
Emissions in Four FEMA Temporary Housing Units –
Final Report
Randy Maddalena, Marion Russell, Douglas P. Sullivan,
and Michael G. Apte
Indoor Environment Department
Environmental Energy Technologies Division
Lawrence Berkeley National Laboratory
Berkeley, CA 94720
November 2008
This work was supported by interagency agreement 08FED894632 from the Centers for Disease Control and
Prevention (CDC) – National Center for Environmental Health (NCEH) and also the Assistant Secretary for Energy
Efficiency and Renewable Energy, Office of Building Technology, State, and Community Programs, of the U.S.
Department of Energy under Contract No. DE-AC02-05CH11231. Its contents are solely the responsibility of the
authors and do not necessarily represent the official views of CDC –NCEH or US DOE. We thank Mike Gressel and
Chad Dowell of CDC-NIOSH for their technical and field support on this project. We also thank Antoinette “Toni”
Stein, California Department of Health Services, Indoor Air Quality Branch, Richmond, CA and Al Hodgson,
Berkeley Analytical Associates, LLC, Richmond, CA for their detailed and thorough reviews of this report.
This page is intentionally blank.
ABSTRACT
As part of an ongoing effort with the U.S. Centers for Disease Control and Prevention (CDC),
Lawrence Berkeley National Laboratory (LBNL) entered into an interagency agreement with
CDC to help identify mitigation strategies for reducing indoor emissions of volatile organic
compounds (VOCs) including formaldehyde in Federal Emergency Management Administration
(FEMA) temporary housing units (THUs)
1
. Four unoccupied FEMA THUs were studied to
assess their indoor emissions of VOC including formaldehyde. Indoor measurement of whole-
THU VOC and aldehyde emission factors (µg h
-1
per m
2
of floor area) for each of the four THUs
were made at FEMA’s Purvis Mississippi staging yard using a mass balance approach.
Measurements were made in the morning, and again in the afternoon in each THU. Steady-state
indoor formaldehyde concentrations ranged from 378 µg m
-3
(0.31ppm) to 632 µg m
-3
(0.52
ppm) in the morning, and from 433 µg m
-3
(0.35 ppm) to 926 µg m
-3
(0.78 ppm) in the afternoon.
THU air exchange rates ranged from 0.15 h
-1
to 0.39 h
-1
. A total of 45 small (approximately
0.025 m
2
) samples of surface material, 16 types, were collected directly from the four THUs and
shipped to Lawrence Berkeley Laboratory. The material samples were analyzed for VOC and
aldehyde emissions in small stainless steel chambers using a standard, accurate mass balance
method. Quantification methods for the VOCs included high performance liquid chromatography
for formaldehyde and acetaldehyde, ion chromatography for the acetic acid, and gas
chromatography-mass spectrometry for the remaining VOCs. Material specific emission factors
(µg h
-1
per m
2
of material) were quantified. Approximately 80 unique VOCs were initially
identified in the THU field samples, of which forty-five were quantified either because of their
toxicological significance or because their concentrations were high. Whole-trailer and material
specific emission factors were calculated for 33 compounds. The THU emission factors and
those from their component materials were compared against those measured in other types of
housing and the materials used in their construction. Whole THU emission factors for most
VOCs were similar to those from comparative housing. The three exceptions were large
emissions of formaldehyde, acetic acid, TMPD-DIB (a common plasticizer in vinyl products),
and somewhat elevated emission of phenol. Of these compounds, formaldehyde was the only
one with toxicological significance at the observed concentrations. Whole THU formaldehyde
emissions ranged from 173 to 266 µg m
-2
h
-1
in the morning and 257 to 347 µg m
-2
h
-1
in the
afternoon. Median formaldehyde emissions in previously studied site-built and manufactured
homes were 31 and 45 µg m
-2
h
-1
, respectively. Only one of the composite wood materials that
was tested appeared to exceed the US Department of Housing and Urban Development (HUD)
formaldehyde emission standard for new material but several of the materials exceeded if the
decline in emission with aging is considered. The high loading factor (material surface area
divided by THU volume) of composite wood products in the THUs and the low fresh air
exchange relative to the material surface area may be responsible for the excessive
concentrations observed for some of the VOCs and formaldehyde.
1
This is a final project report which supersedes the previously submitted interim report by the same authors titled
INTERIM REPORT: VOC AND ALDEHYDE EMISSIONS IN FOUR FEMA TEMPORARY HOUSING UNITS
dated 4 May, 2008.
i
TABLE OF CONTENTS
ABSTRACT i
TABLE OF CONTENTS ii
LIST OF FIGURES iii
LIST OF TABLES iv
LIST OF ABBREVIATIONS vi
EXECUTIVE SUMMARY vii
RECOMMENDATIONS FOR FUTURE WORK X
INTRODUCTION 1
EMISSION FACTORS 1
FORMALDEHYDE EMISSIONS FROM BUILDING MATERIALS – BACKGROUND INFORMATION 2
Formaldehyde Emission Behavior 3
VOLATILE ORGANIC COMPOUND (VOC) EMISSIONS FROM BUILDING MATERIALS - BACKGROUND INFORMATION. 3
METHODS 4
OVERVIEW OF EXPERIMENTAL APPROACH 4
DESCRIPTION OF STUDY UNITS 4
AIR SAMPLING AND ANALYSIS 5
Volatile Organic Chemicals 5
Low Molecular Weight Aldehydes 6
Acetic Acid 6
QUALITY ASSURANCE 6
MEASUREMENT OF WHOLE TRAILER CONCENTRATIONS 7
MEASUREMENT OF STEADY-STATE VENTILATION RATES 7
COLLECTION AND CHARACTERIZATION OF INDOOR MATERIALS 8
MEASUREMENT OF MATERIAL SPECIFIC EMISSION FACTORS 8
DATA ANALYSIS 9
RESULTS 9
MATERIAL SPECIFIC LOADING RATIOS 9
WHOLE TRAILER VENTILATION AND VOC MEASUREMENTS 10
MATERIAL SPECIFIC VOC MEASUREMENTS 11
PERCENT CONTRIBUTION OF MATERIAL SPECIFIC EMISSIONS TO WHOLE TRAILER MEASUREMENTS 11
DISCUSSION 11
VOC EMISSIONS FROM BUILDING MATERIALS 12
ALDEHYDE EMISSIONS FROM BUILDING MATERIALS 13
CONCLUSIONS 15
RECOMMENDATIONS FOR FUTURE WORK 16
REFERENCES: 17
TABLES: 19
FIGURES: 42
ii
LIST OF FIGURES
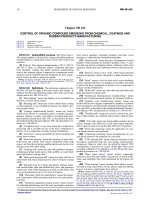
Figure 1. Preparation for indoor sampling in a THU. Half inch holes were drilled into the THU
door for insertion of ¼” stainless steel sampling tubes. A sampling tube and sample pump
are seen in the foreground 42
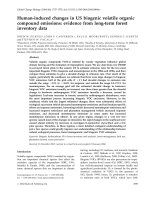
Figure 2. Collection of indoor sample through the THU door. 43
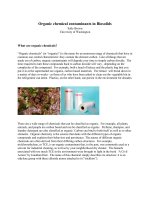
Figure 3. Example of tracer gas experiment determining ventilation rate in trailer showing
initial stabilization period followed by the linear decay region. The ventilation rate is
determined from the slope of the decay curve in the linear region as described in the text.
The response shown here for Trailer 1 is typical of all the units tested. 44
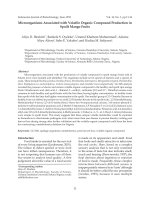
Figure 4. Comparison of measured indoor air concentration (ppm) data for new site-built and
manufactured homes (Hodgson et. al., 2000), German residences (Hippelein, 2004) and the
four THUs. The data are reported as geometric mean (GM) with error bars representing
one geometric standard deviation (GSD). The GSD for the Hippelein (2004) data were
calculated from the arithmetic mean and standard deviation 45
Figure 5. Comparison of GM (GSD error bars) measured whole building VOC emission factors
(emissions per floor area) for seven new site built houses, four new manufactured houses
(Hodgson et. al. 2000), and the four THUs studied in this project. Note that this chart is
plotted on a logarithmic scale 46
iii
LIST OF TABLES
Table 1. Specifications and Ventilation Characteristics of the Temporary Housing Units 19
Table 2. Projected Surface Area of Indoor Materials (m
2
) 19
Table 3. Description of Surface Materials Harvested from Trailers and Tested for Emissions 20
Table 4. Surface Coverings and Finishes on Tested Materials 21
Table 5. Surface Loading Ratios and Area-Specific Clean Air Flow Rates 22
Table 6. Environmental Conditions 23
Table 7 Target VOCs Identified in Temporary Housing Units 24
Table 8. Measured Steady-state VOC Concentrations (µg/m
3
) in Field Samples 25
Table 9. Whole Trailer Emission Rates Normalized to Floor Area (µg m
-2
h
-1
) 26
Table 10. Material Specific Emission Factors (µg m
-2
h
-1
) for the Dutchmen trailer 28
Table 11. Material Specific Emission Factors (µg m
-2
h
-1
) for the Pilgrim trailer 29
Table 12. Material Specific Emission Factors (µg m
-2
h
-1
) for the Coachman trailer 30
Table 13. Material Specific Emission Factors (µg m
-2
h
-1
) for the Cavalier trailer 31
Table 14. Material Emission Factors Normalized to Whole Trailer Floor Area (µg m
-2
h
-1
) for the
Dutchmen trailer 32
Table 15. Material Emission Factors Normalized to Whole Trailer Floor Area (µg m
-2
h
-1
) for the
Pilgrim trailer 33
Table 16. Material Emission Factors Normalized to Whole Trailer Floor Area (µg m
-2
h
-1
) for the
Coachmen trailer 34
Table 17. Material Emission Factors Normalized to Whole Trailer Floor Area (µg m
-2
h
-1
) for the
Cavalier trailer 35
Table 18. Total (µg m
-2
h
-1
) and Percent Contribution of Each Material to Area Normalized
Whole Trailer Emission Rates for the Duchmen 36
Table 19. Total (µg m
-2
h
-1
) and Percent Contribution of Each Material to Area Normalized
Whole Trailer Emission Rates for the Pilgrim 37
Table 20. Total (µg m
-2
h
-1
) and Percent Contribution of Each Material to Area Normalized
Whole Trailer Emission Rates for Coachmen 37
iv
Table 21. Total (µg m
-2
h
-1
) and Percent Contribution of Each Material to Area Normalized
Whole Trailer Emission Rates for the Cavalier 38
Table 22. Comparison of Sum Material Specific Emission* (µg m
-2
h
-1
) with Measured Whole
Trailer Emission 39
Table 23. Material specific aldehyde emissions from cabinetry, passage door, and subfloor used
to fabricate a new manufactured house 40
Table 24. Material specific emission factors of terpene hydrocarbons from indoor sources used
to fabricate a new manufactured house 40
Table 25. Reported Formaldehyde Emission Factors from CARB’s Battelle (1996) study
1
41
v
CV
LIST OF ABBREVIATIONS
ACH Air Exchanges per Hour
ASTM American Society for Testing and Materials
CARB California Air Resources Board
CDC Centers for Disease Control and Prevention
CPSC US Consumer Product Safety Commission
Coefficient of Variation
FEMA Federal Emergency Management Administration
GM Geometric Mean
GSD Geometric Standard Deviation
HUD US Department of Housing and Urban Development
HWPW Hardwood Plywood
LBNL Lawrence Berkeley National Laboratory
NCEH National Center for Environmental Health
NIOSH National Institute for Occupational Safety and Health
NIST National Institute of Standards and Technology
ORNL Oak Ridge National Laboratory
ppm parts per million
ppb parts per billion
PVC polyvinylchloride
REL Recommended Exposure Limit
TAC Toxic Air Contaminant
THU Temporary Housing Units
TMPD-DIB 2,2,4-Trimethyl-1,3-pentanediol diisobutyrate
TMPD-MIB 2,2,4-Trimethyl-1,3-pentanediol monoisobutyrate
UFFI Urea Formaldehyde Foam Insulation or expandable foam insulation
VOC Volatile Organic Chemical
vi
EXECUTIVE SUMMARY
This document superseded the previously submitted interim report titled “INTERIM REPORT:
VOC AND ALDEHYDE EMISSIONS IN FOUR FEMA TEMPORARY HOUSING UNITS”
by the same authors dated 4 May, 2008. This final report includes updated data on acetic acid, a
more detailed comparison of the results to regulatory product standards and published emission
factors and updated figures and tables.
The objectives of this study have been to 1) directly measure indoor concentrations and whole
trailer emission factors in four unoccupied temporary housing units (THUs) for a range of
volatile organic compounds (VOCs) and aldehydes including formaldehyde, and 2) determine
materials specific emission factors of these compounds from individual surface materials
collected directly from the THUs providing initial information into the magnitude and potential
sources of indoor pollutant loadings in the tested THUs. The results of this study will be used by
the U.S. Centers for Disease Control and Prevention to help identify mitigation strategies for
reducing indoor emissions of VOCs including formaldehyde.
The Federal Emergency Management Administration (FEMA) has supplied over 100,000
emergency THUs to families that lost their homes in Louisiana and Mississippi during the
Hurricane Katrina and Rita disasters. FEMA owns approximately 160,000 of these THUs. Some
are deployed to other parts of the U.S., some are used to house emergency workers, and many
are in storage. Concerns about the indoor environmental quality in the THUs have arisen based
on occupant health complaints and concerns. These health concerns have been identified by
physicians treating THU occupants, and through risk analyses of indoor air quality
measurements made in both occupied and unoccupied units. These measurements were reported
by the Sierra Club and by the Centers for Disease Control and Prevention (CDC). Formaldehyde
concentrations observed in both occupied and unoccupied THUs have exceeded the National
Institute for Occupational Safety and Health (NIOSH) recommended exposure limit (REL) of
0.016 ppm, often by a factor of 10 or greater. The NIOSH REL was based on the analytical limit
of detection and not on health effects data.
Measured emission factors for individual building materials can be used to assess the
contribution of specific materials to the overall indoor pollutant load using mass balance
modeling. Emission factors describe the mass of a particular compound released by a specific
material per hour, per unit area of material. Measured emission factors provide a means to
directly compare emission characteristics from one material to another. Emission factors from
materials are dependent on a range of environmental parameters such as temperature, relative
humidity and boundary layer diffusion characteristics, which are influenced by air flow across
the surface. These parameters need to be considered when emission factors are compared.
When describing emissions from a single material, i.e., fiberboard or flooring, emission factors
are typically expressed in terms of the projected surface area of the material itself. However,
when describing the emissions from a composite assembly of materials, such as a house or travel
trailer that is constructed from a variety of component pieces, it is difficult to isolate a single
emission source. In this case, it is customary to present emissions of a particular compound as a
net mass emitted per unit area of floor, per hour. Both of these emission factor metrics have the
-2
h
-1
same units: µg m
.
It is important to understand the distinction between emissions on a per-
material area versus a net per-floor area basis when studying material emission characteristics.
vii
Sources contributing to elevated formaldehyde indoors are primarily related to building products
and furnishings. Formaldehyde is only one compound of concern that is emitted from these
materials. A range of VOCs typically present when formaldehyde is observed, are also emitted
from materials. Like formaldehyde, which is a toxic air contaminant, many of the VOCs are
known to have low odor thresholds, high potency as respiratory irritants, and in some cases
carcinogenicity.
This report presents results from experiments designed to assess their indoor emissions of VOCs,
including formaldehyde, in four unoccupied FEMA THUs. Whole-THU emissions were
measured, and then selected material samples were collected directly from the four units and
their material specific emission rates were measured in small chambers. Standard analytical
methods employing rigorous quality control were used to quantify a range of VOCs and
aldehydes in the air in both the whole-THU and chamber emissions experiments and these
measurements were used along with characteristics of the THUs to estimate emission rates.
The THUs selected for study were all of the travel trailer design including a Thor Industries
Dutchmen manufactured September 2005, a Pilgrim International manufactured October 2005, a
Coachmen’s Spirit of America manufactured October 2006 and a Gulfstream Coach Cavalier
manufactured March 2006. The units were in excellent condition. The approximate floor areas
ranged from 221 – 240 square feet. The Dutchman trailer was equipped with an additional
pullout section approximately 14 feet long by 3 feet (~42 ft
2
) that was not opened up during
sampling.
Measurement of whole-THU VOC and aldehyde emission factors (µg h
-1
per m
2
of floor area)
for each of the four THUs were made at FEMA’s Purvis Mississippi staging yard.
Measurements were made in the morning, and again in the afternoon in each THU. Steady-state
indoor formaldehyde concentrations ranged from 378 µg m
-3
(0.31ppm) to 632 µg m
-3
(0.52
ppm) in the morning, and from 433 µg m
-3
(0.35 ppm) to 926 µg m
-3
(0.78 ppm) in the afternoon.
THU air exchange rates ranged from 0.15 h
-1
to 0.39 h
-1
.
A total of 45 small (approximately 0.025 m
2
) samples of surface material, 16 types, were
collected directly from the four THUs and shipped to Lawrence Berkeley Laboratory (LBNL).
Material specific emission factors were determined using small chambers generally following the
ASTM Standard Guide D-5116-97. The material samples were analyzed for VOC emissions in
small stainless steel chambers using a standard, accurate mass balance method. Quantification of
VOCs was done via gas chromatography – mass spectrometry; low molecular weight aldehydes
via high performance liquid chromatography; and acetic acid via an ion chromatography method.
Material specific emission factors (µg h
-1
per m
2
of material) were quantified. Approximately 80
unique VOCs were initially identified in the THU field samples, of which forty-five were
quantified either because of their toxicological significance or because their concentrations were
high.
All THUs had a significant fraction of the internal surface area (walls, ceiling, cabinet walls)
constructed of 1/8-inch plywood with a vinyl or PVC skin or simulated wood finish. All units
had sheet vinyl flooring while the Dutchmen and Pilgrim also had carpeted areas. All
countertops were particleboard surfaced with high-pressure laminate. A variety of wood products
were used for the sub-floor and for the bench and bed platforms.
Whole-trailer and material specific emission factors were calculated for 33 compounds. The
THU emission factors and those from their component materials were compared against those
viii
measured from other types of housing and the materials used in their construction. Whole THU
emission factors for most VOCs were similar to those from comparative housing measured in the
U.S (all approximately 6 months old or less). Four exceptions were large emissions of
formaldehyde, acetic acid and TMPD-DIB (2,2,4-Trimethyl-1,3-pentanediol diisobutyrate - a
common plasticizer in vinyl products), and somewhat elevated emissions for phenol. A detailed
assessment of the toxicology and risk associated with the identified indoor pollutants was not
performed but of the compounds that were identified, the observed concentration of
formaldehyde is thought to be of toxicological significance. Additionally, several VOCs
(dodecane, tridecane, p-xylene, alpha-pinene, beta-pinene and hexanal) were measured in the
four THUs at concentrations above those reported in a study of 39 German homes. Acetic acid
was also measured at levels that were well above reported odor thresholds for VOCs.
Whole THU formaldehyde emissions ranged from 173 to 266 µg m
-2
h
-1
in the morning and 257
to 347 µg m
-2
h
-1
in the afternoon. Median formaldehyde emissions in previously studied site-
-2
h
-1
built and manufactured homes (approximately 6 months old or less) were 31 and 45 µg m ,
respectively.
The material specific formaldehyde emission factor measurements showed that the highest
material emissions were from the cabinet walls, sub flooring, and the bench materials (the fabric
and foam materials also showed elevated emissions, but these may be due to the re-emission of
formaldehyde that had sorbed to the material from the indoor air, rather than as primary
emitters). Only one material, the Cavalier plywood cabinet wall (490 µg m
-2
h
-1
) exhibited
emissions in excess of the HUD standard of 130 µg m
-2
h
-1
for new material. However, the
material in the THUs had aged and as a result the emission rates are expected to be lower than
initial emissions from new material. If this aging is accounted for then several of the materials in
the THUs may have emission that exceeded the HUD standard when the materials were new.
Knowledge on the rate of decline in emission rates with aging is limited so it is difficult to
conclude that the aged materials would have been below the HUD standard or within previously
reported ranges for other structures. Nevertheless, even with the aged materials, the emission
factors for phenol, TMPD-DIB, acetic acid and formaldehyde remained higher in the THUs than
the new homes.
We conclude that whole trailer formaldehyde emission factors are high, but the materials
emission factors may be within those commonly found in the building industry. This indicates a
difference in the construction/design that may lead to elevated concentrations and whole trailer
emission rates. Three features of material application in the THUs differ from most other
dwellings: 1) the extensive use of lightweight composite wood products, 2) very high surface
loading of composite wood products and 3) low fresh air per unit surface area of composite wood
products in the THUs.
Much of the projected surface area in the THUs (wall, ceiling, and cabinetry) use 1/8” hardwood
plywood (HWPW). The wood product loading factor of the THU is far higher than in houses that
use gypsum board for walls and ceilings. These high loading factors in combination with
observed ventilation rates may be the primary reason for the unusually high rates at which
formaldehyde mass is emitted into the THU. Considering this in terms of the area-specific clean
air flow rates, the high material loading ratio in the units combined with relatively low fresh air
ventilation rates results in area-specific air flow rates that are quite low relative to other housing
types. With all other factors being equal, the steady-state concentrations indoors are inversely
proportional to the air exchange rates. The THUs in this study are not outfitted for increased
ix
ventilation and may be under ventilated for housing with such small volume. Although low
ventilation does not directly affect the measured formaldehyde emission rates presented in this
report, it can influence the concentrations experienced by the THU occupants.
The results of this study are not statistically representative of the entire fleet of FEMA THUs
because the study was based on a convenience sample of four THUs. Nonetheless, the measured
material-specific emission factors for volatile organic compounds, including formaldehyde, were
similar to values reported in the literature for materials. However, it is important to consider that
the materials in this study were both aged and allowed to interact with emissions from other
materials. Formaldehyde and some of the other VOCs measured in the unoccupied THUs and the
associated whole trailer emission factors were found to be higher, sometimes much higher, than
what is typically found in residential environments. The difference between these THUs and
other housing appears to be the very high composite wood surface areas relative to room volume
used in the travel trailer design and the low ventilation rates in terms of low area-specific fresh
air flow rates in the THUs.
Recommendations for future work
This report provides a preliminary assessment into the effect of THU design and material choices
on indoor VOC and aldehyde concentrations. It is by no means definitive because we studied
only four THU models produced by four manufactures and the focus of this study was limited to
the travel trailers, while a significant portion of THUs are park trailer models, and mobile homes.
A systematic assessment across a wider range of THU makes and models including a better
characterization of fresh air ventilation rates under occupied conditions could provide a better
understanding of the time integrated exposure concentrations in occupied units.
The results in this report do not yet address temperature and humidity effects on material
emissions within the studied units. It is hypothesized that at the higher temperature and relative
humidity conditions found in the summertime in the southeastern portions of the US, emissions
of formaldehyde from the urea-formaldehyde composite materials will increase. Chamber
experiments and a seasonal study designed to investigate the potential effects of temperature and
humidity should be completed.
x
INTRODUCTION
This document superseded the previously submitted interim report titled “INTERIM REPORT:
VOC AND ALDEHYDE EMISSIONS IN FOUR FEMA TEMPORARY HOUSING UNITS”
by the same authors dated 4 May, 2008. This final report includes updated data on acetic acid, a
more detailed comparison of the results to regulatory product standards and published emission
factors and updated figures and tables.
FEMA has supplied over 100,000 emergency THUs to families that lost their homes in Louisiana
and Mississippi during the Hurricane Katrina and Rita disasters. FEMA owns approximately
160,000 of these THUs. Some are deployed to other parts of the U.S., some are used to house
emergency workers, and many are in storage. Concerns about the indoor environmental quality
in the THUs have arisen based on occupant health complaints and concerns. These concerns
have been identified by physicians treating THU occupants, and through risk analyses of indoor
air quality measurements made in both occupied and unoccupied units. These measurements
were reported by the Sierra Club and by the Centers for Disease Control. Formaldehyde
concentrations observed in both occupied and unoccupied THUs have exceeded the National
Institute for Occupational Safety and Health (NIOSH) recommended exposure limit (REL) of
0.016 ppm, often by a factor of 10 or greater. The NIOSH REL was based on the analytical limit
of detection and not on health effects data.
Although formaldehyde levels in the THUs was highlighted by the Sierra Club survey, and by
media focus, a concern has existed that other irritating, odorous, or potentially toxic volatile
organic compounds (VOC) may be emitted from the THU construction materials and
furnishings, and that the design of the THUs, including extensive use of plywood, particle board
and laminated material in combinations with low ventilation rates may lead to elevated exposure
concentrations. A careful study of indoor VOC emissions in the whole trailers and from the
individual THU materials was needed to identify sources of indoor pollutants and begin to assess
exposure concentrations that result from these emissions.
Emission Factors
Measured emission factors for individual building materials can be used to assess the
contribution of specific materials to the overall indoor pollutant load using mass balance
modeling (Hodgson et. al., 2004). Emission factors describe the mass of a particular chemical
released by a material per hour and per unit surface area. Measured emission factors provide a
means to directly compare emission characteristics from one material to another. Emission
factors from materials can be influenced by a range of environmental parameters such as
temperature, relative humidity and boundary layer diffusion characteristics, which are influenced
by air flow across the surface. It is important that these parameters are consistent when emission
factors are compared. Measurement method standardization helps to ensure this.
When describing emissions from a single material, i.e., fiberboard or flooring, emission factors
are typically expressed in terms of the projected surface area of the material itself. However,
when describing the emissions in a complete structure, such as a house or travel trailer that is
composed of a variety of different materials that can release and absorb air pollutants, it is
difficult to isolate a single emission source. In this case, it is customary to present emissions of a
particular compound as a net mass emitted per unit area of floor, per hour. Both of these
-2
h
-1
emission factor metrics have the same units: µg m
.
It is important to recognize the
1
distinction between emissions on a per-material area versus a net per-floor area basis when
studying material emission characteristics. The convention followed in this work is to report
whole-trailer emission factors on a floor area basis while the individual materials are reported on
a projected surface area basis.
Formaldehyde Emissions From Building Materials – Background Information
Sources contributing to elevated formaldehyde indoors are primarily related to building products
and furnishings. Formaldehyde is only one compound of concern that is emitted from these
materials. A range of VOCs typically present when formaldehyde is observed, are also emitted
from materials (Hodgson, 1999). Like formaldehyde, which is a toxic air contaminant, many of
the VOCs are known to have low odor thresholds, high potency as respiratory irritants, and in
some cases carcinogenicity. However, given the toxicity and prevalence of formaldehyde in
residences it has been the focus of a number of studies over the last several decades.
The problem of excessive formaldehyde emissions from building materials reached national
awareness starting in the early 1980s with the increase in commercial and industrial use of urea
formaldehyde as a bonding agent and as an expanded foam insulation (UFFI). The US Consumer
Product Safety Commission (CPSC) had reported health complaints caused by UFFI since 1972.
In 1980 the National Academy of Science advised maintaining the lowest practical formaldehyde
concentrations in order to minimize possible adverse effects on public health, based upon
emerging results from an ongoing carcinogenicity study (NAS 1980). A heightened concern
began with the emergence of health effects in occupants of mobile homes (Hileman, 1982). In
1982 the Consumer Product Safety Commission placed a ban on UFFI (CPSC 1982). This ban
was subsequently lifted a year later by court order (CPSC 1983). However, the use of UFFI as a
building material was curtailed by the industry.
In 1984 the U.S. Department of Housing and Urban Development (HUD) established
formaldehyde product standards for all plywood and particleboard materials using bonding,
coating, or surface finishing systems containing formaldehyde when installed in manufactured
homes (Turner et al. 1996). The standard is embodied in the HUD Standard 24 CFR Chapter XX
Part 3280, Manufactured Home Construction and Safety Standards (HUD 2001). The standard
is based upon the ASTM emission testing method E-1333 that continues to be used (ASTM
2002). The standard was intended to cap the mass of formaldehyde that emanated from fresh
wood composite materials in terms of concentration in a test chamber using standardized surface
loading ratios and area specific air flows or air exchange rates. The standard was developed for
testing newly manufactured wood products prior to their use in construction
2
.
The wood products industry adopted the HUD standard in the U.S. during the 1980s.
Subsequent surveys indicated that because the reduction of the mass emission rate of
formaldehyde from wood products and the discontinuation of the use of UFFI in residential
2
The HUD safety standards for certified plywood and particleboard used in manufactured home construction require
that formaldehyde concentrations not exceed 200 ppb (0.246 mg/m
3
) from plywood and 300 ppb (0.369 mg/m
3
)
from particleboard, as measured under the conditions specified in ASTM Method E1333. Engineered wood products
are tested with specified loading ratios for particleboard and plywood of 0.43 m
2
of material per m
3
of test chamber
volume (0.13 ft
2
/ft
3
), and 0.95 m
2
/m
3
(0.29 ft
2
/ft
3
), respectively. Using the operating conditions and formaldehyde
emissions rate equation specified in the standard, the initial formaldehyde emissions rates from the newly
manufactured materials are 430 µg/m
2
/h (8.81 x 10
-8
lb/ft
2
/h) for particleboard and 130 µg/m
2
• h (2.66 x 10
-8
lb/ft
2
•
h) for plywood.
2
construction, formaldehyde levels in residences dropped substantially (Azuma et al. 2006)
through the 1980s and 1990s.
Formaldehyde Emission Behavior
Past research has established that the rate at which formaldehyde is emitted from some building
products drops slowly as the materials ages after manufacture. This concept is often brought up
when the topic of indoor formaldehyde emissions from materials is discussed. The fact is often
used to indicate that indoor formaldehyde concentrations will decrease with time, lessening risk
and health problems. However, the rate at which emissions drops is not well determined and will
depend upon many factors. A recently released industry association report (SEFA 2008)
concluded that emissions can drop by 25% within a month of manufacture and usually drop by
half within six months.
A study of emission characteristics of pressed-wood products conducted by Oak Ridge National
Laboratory (ORNL) for the U.S. Consumer Product Safety Commission (Matthews 1985) found
that the time needed for emissions to drop to approximately 37% of initial rate was between 0.9
and 2.2 years depending on the material tested. These decay rates indicate a rate constant of 1.1
per year and 0.45 per year. The longer decay period (slower decay rate) was for a mixture of
materials (particleboard underlayment, industrial particleboard, hardwood plywood paneling and
medium density fiberboard). The shorter decay periods were associated with weaker board
material at lower starting formaldehyde concentrations.
Using the slower decay period of 2.2 year determined in the ORNL study (Matthews 1985) for
materials that are similar to THU materials, and assuming a starting formaldehyde concentration
of 300 ppb with an air exchange rate of 0.5 h
-1
(HUD standard for particle board), the required
duration for the concentration in a new trailer to drop to a concentration of 10 ppb (similar to
background, ASTDR 1999) is 7.5 years. For the lighter materials with the faster decay rate
measure by ORNL, and assuming a starting concentration of 200 ppb, the time to reach 10 ppb is
between three and five years.
Another key finding in the ORNL study was the effectiveness of vinyl flooring as a barrier in
reduction of formaldehyde emission rates. This finding is salient to the THUs studied in this
project in that much of the floor area had sheet vinyl covering and the walls, ceiling, cabinets,
and doors were also covered with a polyvinyl chloride (PVC), photo-laminate or vinyl material.
The ORNL report found through both modeling and measurements that carpet and cushion
covering resulted in approximately a 2.5 fold reduction in formaldehyde emission rates while
vinyl flooring reduced emission by approximately 30 fold (Matthews 1985).
Other building material studies have reported on the effectiveness or lack of effectiveness of
coatings, layers, laminates, and other coverings showing that different coverings retard emissions
differently. Some studies have shown that there can be significant sink effects with certain floor
and wall covering materials when used in conjunction with other emitting sources highlighting
more complex interactions and effects of flooring and wall assemblies including peak VOCs
shifts with respect to time instead of simple decays (Won et al. 2001).
VOC Emissions from Building Materials - Background Information
Considerably less information is available on VOC emissions from construction materials other
than formaldehyde. Key sources of new information are Hodgson et al. (1999, 2000, and 2004),
3
Hodgson and Levin (2003), the California Integrated Waste Management Board (CIWMB 2003),
Hipellein (2004) and Won et.al. (2004). For the purposes of this report we are able to make
comparisons of residential concentrations and to whole structure VOC emission factors on a per-
floor area basis. The sparse data on VOC emissions at the material level make comparisons more
tenuous, however, enough data exists to make some qualitative conclusions regarding individual
materials’ contributions to indoor VOC concentrations in the THUs.
The objectives of this study are to 1) directly measure indoor concentrations and whole trailer
emission factors in four unoccupied THUs for a range of VOCs and 2) determine materials
specific emission factors from individual surface materials collected directly from the THUs
providing initial information into the magnitude and potential sources of indoor pollutant
loadings in the tested THUs.
METHODS
Overview of Experimental Approach
Four unoccupied THUs, each produced by a different manufacturer, were selected for study from
stock at the FEMA staging yard in Purvis, Mississippi. For each THU, indoor and outdoor air
concentrations were determined under steady-state ventilation conditions for a range of
pollutants at two separate time points and ventilation rates were measured. After completion of
the whole trailer measurements, representative surface materials were cut directly from each
THU, packaged and shipped to LBNL for testing in small chambers to determine material-
specific VOC emission factors. The projected surface areas of the materials in the THUs were
measured and used along with the emission factors to characterize the relative contributions of
the materials to total pollutant loads in the THUs.
Description of Study Units
The THUs selected for study included a Thor Industries Dutchmen manufactured September
2005, a Pilgrim International manufactured October 2005, a Coachmen’s Spirit of America
manufactured October 2006 and a Gulfstream Coach Cavalier manufactured March 2006. The
units were unoccupied and in excellent condition. The approximate floor areas ranged from 221
– 240 square feet. The Dutchman trailer was equipped with an additional pullout section
approximately 14 feet long by 3 feet (~42 ft
2
) that was not opened up during sampling.
The trailer dimensions and specifications are summarized in Table 1. The Pilgrim and Cavalier
trailers were built to FEMA specification while the Dutchmen and Coachmen were built to HUD
standards. The units tested were all travel trailer designs that had either not been previously
occupied or had been reconditioned and made ready for re-deployment. The projected surfaces
areas of each surface material in the THUs are summarized in Table 2. A description of the
individual building material types is provided in Table 3 and the surface covering or finishes are
summarized in Table 4.
The trailers were moved to a central staging area at the storage yard on November 9, 2007 and
were parked in approximately the same directional orientation. A series of small holes (~6 mm)
were drilled in the entrance door of each trailer (Figure 1) to allow insertion of rigid stainless
steel sampling tubes for sample collection ( Figure 2). Rigid sampling tubes were extended
approximately 1 meter into a trailer and elevated 1 meter from the floor to facilitate sampling of
VOCs, aldehydes, acetic acid, temperature, relative humidity, and tracer gas concentrations
without opening the trailer. Mixing fans were installed in each trailer for use only in mixing the
4
injected tracer gas to determine each THU’s characteristic air exchange ventilation rates. These
fans were not otherwise operated during VOC sampling.
After initial setup, the trailers were closed and remained closed to allow the ambient ventilation
rates to come to steady-state. Sampling was conducted on November 14, 2007. Temperature,
relative humidity and CO
2
concentrations were monitored in each trailer and at a central location
outdoors during the experiments using calibrated indoor air quality monitors (Q-Trac Plus; TSI).
Air Sampling and Analysis
Volatile Organic Chemicals
VOC samples were collected and analyzed following USEPA Methods TO-1 and TO-17
(USEPA 1999). VOCs were collected onto multibed sorbent tubes (P/N 012347-005-00; Gerstel
or equivalent) with primary bed of Tenax-TA® sorbent backed with a section of Carbosieve®.
Prior to use, the sorbent tubes were conditioned by helium purge (~10 cc/min) at 275
o
C for 60
minutes and sealed in Teflon capped tubes. VOC samples were collected through a rigid stainless
steal tube inserted through the trailer door, directly into the tube for outdoor samples, and
directly from the exit port in the small emission chamber. A vacuum pump (Model DOA-P104-
AA; Gast) with electronic mass flow controllers (lab), or calibrated personal sampler pumps
(field) were used to pull air through the sample tubes at ~100 cc/min. Approximately 6 liters
were collected from the whole-trailers and 3 liters from the emission chambers. Flows were
verified using a separate calibrated flow meter prior to the emission chamber experiments. The
personal sampler pumps used in the field were calibrated prior to use and checked after use.
Sorbent tubes were sealed with Teflon lined caps after use and either analyzed the same day or
stored on ice or in a freezer until analysis. Sample stability over freezer storage times of more
than 2 months have been confirmed previously in our lab for many of the VOCs included in this
study.
Sorbent tubes were thermally desorbed for analysis by gas chromatography/mass spectrometry
(TD-GC/MS) using a thermodesorption auto-sampler (Model TDSA2; Gerstel), a
thermodesorption oven (Model TDS3, Gerstel) and a cooled injection system (Model CIS4;
Gerstel). The cooled injection system was fitted with a Tenax-packed glass liner (P/N 013247-
005-00; Gerstel). Desorption temperature was 25
o
C with a 0.5 minute delay followed by a 60
o
C
ramp to 250
o
C and a 4 minute hold time. The cryogenic trap was held at -10
o
C and then heated
within 0.2 minutes to 270
o
C at a rate of 12
o
C/s, followed by a 3-minute hold time. Compounds
were resolved on a GC (Series 6890Plus; Agilent Technologies) equipped with a 30 meter HP-
1701 14% Cyanopropyl Phenyl Methyl column (Model 19091U-233; Agilent Technologies) at
an initial temperature of 1
o
C for 0.5 minutes then ramped to 40
o
C at 25
o
C/min, to 115
o
C at 3
o
C/min and finally to 250
o
C at 10
o
C/min holding for 10 minutes.
The resolved analytes were detected using an electron impact MS system (5973; Agilent
Technologies). The MS was operated in scan mode. One sample from each trailer was analyzed
and all compounds over the detection limit (< 1 to several ng) were identified by library search
using the National Institute of Standards and Technology (NIST) spectral library followed by
comparison to reference standards. Multipoint calibrations were prepared from pure standards for
43 VOCs that were common indoor pollutants and/or elevated in one or more of the whole trailer
samples. All pure standards and analytes were referenced to an internal standard (~120 ng) of 1-
bromo-4-fluorobenzene.
5
Low Molecular Weight Aldehydes
The target analytes in the aldehyde analysis included formaldehyde, acetaldehyde and acetone.
Higher carbon-number aldehydes were quantified using the VOC method described above.
Samples of these low molecular weight carbonyl compounds were collected and analyzed
following ASTM Test Method D 5197-92 (ASTM, 1997). As with the VOCs, the air samples
were drawn directly from the small emission chamber or through a short rigid tube inserted
though holes in the trailer door. Samples were collected on commercially available silica gel
cartridges coated with 2,4-dinitrophenyl-hydrazine (XPoSure Aldehyde Sampler; Waters
corporation). An ozone scrubber (P/N WAT054420; Waters) was installed upstream of the silica
cartridge in the field samples. Samples were collected from the trailers for 60 minutes at ~ 1 lpm
using personal sampling pumps that were calibrated before use and checked after use. Samples
were collected from the laboratory emission chambers using a vacuum pump (Model DOA-
P104-AA; Gast) with sample flow rates regulated by electronic mass flow controllers. Sample
cartridges were capped and stored on blue ice or in the freezer until extraction.
Cartridges were eluted with 2 mL of high-purity acetonitrile into 2 ml volumetric flasks and the
eluent was brought to a final volume of 2 ml before analysis. Extracts were analyzed by high-
performance liquid chromatography (HPLC) (1200 Series; Agilent Technologies) using a C
18
reverse phase column with 65:35 H
2
O:Acetonitrile mobile phase at 0.35 ml/minute and UV
detection at 360 nm. Multipoint calibrations were prepared for the target aldehydes using
commercially available hydrazone derivatives of formaldehyde, acetaldehyde and acetone.
Acetic Acid
Acetic acid was collected in the same way as the carbonyl samples but collected on silica gel
sorbent tubes (P/N 22655; SKC) and extracted using 5 mL of 18 mOhm deionized water, filtered
through a 0.22 micron membrane. Samples were collected from the trailers for 60 minutes at ~ 1
lpm using personal sampling pumps that were calibrated before use and checked after use.
Samples were collected from the emission chambers using a vacuum pump (Model DOA-P104-
AA; Gast) with sample flow rates regulated by electronic mass flow controllers. Samples were
stored in sealed plastic bags at -15°C until extraction and analysis.
Extracts were analyzed by ion chromatography (IC) (ICS 2000; Dionex) equipped with an
autosampler (AS40; Dionex), hydroxide ion generator (EluGen cartridge, P/N 058900; Dionex)
and a conductivity detector. Samples were separated on an AS11 column (P/N 044076; Dionex)
at a flow rate of 1.0 ml/min. The column was not heated. An injection loop of 25 µL was used to
inject samples. A gradient of hydroxide ions was generated starting at 0.20 mM for 2.3 min.
before increasing to 15.00 mM at 12.0 min, then to 35.00 mM at 15.0 min. A multipoint
calibration ranging from 0.287 mg/L (of extract) to 52.363 mg/L was prepared from a 1.000g/L
acetate ion chromatography standard (P/N 13669; Fluka) and was used to quantify the instrument
response. The approximate instrumental limit of quantitation is 0.287 mg/L with a limit of
detection of 0.05 mg/L. A typical calibration curve has a relative standard deviation of 4.53%
and a coefficient of determination of 99.80%.
Quality Assurance
All samples were quantified with multipoint calibration curves prepared from pure chemicals.
For the VOCs that did not have pure standard available or that were a mixture of compounds
(i.e., alkylbenzenes), the compounds were tentatively identified by National Institute of
6
Standards and Testing (NIST) library spectrum search and quantified as toluene equivalent
values. Analytical blanks were included in all analyses. Trip blanks were prepared, transported to
the field sampling site, stored and analyzed along with the whole trailer samples. Method blanks
for the small chamber emission experiments including backing plate and tape in the chamber
represented more than 10% of all samples collected and chamber blanks representing only the
background in the chamber represented an additional 10% of samples collected.
Measurement of Whole Trailer Concentrations
Air concentrations were measured under pseudo steady-state conditions on November 14, 2007
after the THUs had been closed for several days. No attempt was made to control the ambient
wind or temperature that the THUs were subjected to during this period. All THUs were setup
with samplers and pumps so that all three samples (VOC, aldehyde and acetic acid) could be
collected simultaneously in all THUs. A morning sampling event and an afternoon sampling
event were conducted for each trailer and at a central outdoor location. The first sample
collection started between 11:00 and 11:30 AM and continued for approximately one hour
during which time the ambient temperature, relative humidity and wind speed were 25.1 ± 2.6%
(C) and 49 ± 6.5% (%) and 2.8 ± 41% (m/s), respectively. The second sampling event started
between 14:00 and 14:30 and again lasted about an hour during which time the ambient
temperature, relative humidity and wind speed were 26.4 ± 1.5% (C), 48 ± 3.2% (%) and 2.6 ±
43% (m/s), respectively. Start and stop times were recorded for each sample along with flow
rates. Each sample pump was checked against a calibrated flow meter before and after the
sampling event. All samples including two trip blanks for each sample type were sealed and
placed on ice for transport back to LBNL. Upon arrival at LBNL the samples were stored in a
freezer until analysis.
Measurement of Steady-State Ventilation Rates
The THUs did not include mechanical forced air ventilation systems and operable windows
remained closed throughout the study period. Ventilation rates were determined after collection
of air samples using a tracer gas decay method. Externally controlled circulation fans were
switched on in each trailer and pure carbon dioxide (CO
2
) was injected from a Tedlar bag into
each unit to achieve an initial concentration that was significantly elevated over ambient
conditions. The concentration of CO
2
was measured continuously using Q-Trac Indoor Air
Quality monitors through the sample ports in the trailer doors. Mixing fans were run for 15 - 20
minutes after dumping CO
2
into trailers allowing the air concentrations and decay curves to
stabilize then the fans were shut off while the decay of the concentration of tracer gas was
measured.
The ventilation rate is determined from the decay of the tracer gas concentration in the trailer.
When using a chemical like CO
2
as a tracer gas, the background level can influence the clearance
rates. The equation for decay or clearance of the tracer gas from a trailer after elevating and
mixing the CO
2
tracer gas is
* Q
(
tt
C
t
= C
ss
+
(
C C
ss
)
exp
*
)
(1)
where C
t
(ppm) is the measured concentration in the unit at time t, C* is the maximum at the
start of the stable decay period, C
ss
is the background or ambient concentration, and Q (h
-1
) is the
7
rate constant for removal of the tracer from the system, which for a non-reactive chemical that
does not significantly interact with surfaces, is the ventilation rate in terms of air changes per
hour, ACH (h
-1
). Equation 1 can be rearranged to the form
ln
(
C
t
C
ss
)
= Q
(
t t
*
)
(2)
so the slope of the natural log of the difference between measured concentration and the ambient
concentration against elapsed time is the –ACH as illustrated in Figure 3.
Collection and Characterization of Indoor Materials
The total projected surface area of each material in the trailer was measured and recorded in the
field when the material samples were collected for testing after the whole trailer measurements
were collected. A representative piece (> 15 cm on a side) of each material was cut directly from
the trailer, triple wrapped in foil, placed in a labeled manila envelope and boxed for shipment to
LBNL. A total of 45 samples representing 16 different materials were collected from the four
trailers. The materials were inventoried upon arrival at LBNL and stored at room temperature in
their original packing. Prior to testing, the materials (excluding the fabric and cushions) were cut
to size using a dry table saw with sharp blade and returned to their original packing. The fabric
and cushion materials were cut to size with a razor or knife. Each material was either pressed
into a stainless steel tray to expose only the face or the back was covered with a stainless steel
plate and the edges sealed with aluminum tape. When tape was used to seal the edges, the final
exposed face was measured and recorded. The individual material samples had already aged in
the trailers prior to collection of the test materials so we did not include an additional
conditioning period beyond what was required to achieve steady state concentrations in the
chambers prior to testing.
Measurement of Material Specific Emission Factors
Material specific emission factors were determined using small chambers generally following the
ASTM Standard Guide D-5116-97. Because the goal was to reconstruct whole-trailer emission
rates and the trailers were well aged in the field, the individual materials were not conditioned
prior to testing. Also, the air-sampling period in the small chambers started after approximately
six air changes rather than the recommended 96 hour pre-test period used for new materials. This
approach was taken to provide emission factors that were more closely linked to the actual
emission rates measured in the whole trailers.
The emission tests were conducted in four 10.5 liter stainless steel chambers that were
maintained at 23 ± 1
o
C in a controlled environmental chamber with a 0.06 m
3
/h inlet flow of
carbon filtered preconditioned air at 50% ± 5% relative humidity supplied continuously to each
test chamber. The relative humidity within the test chambers was controlled by a flow of mixed
streams of dry- and water-saturated air. After sealing the backs and raw edges of the material as
described above, the materials were placed face up on screens resting slightly below the center of
the test chambers. The emitting area, A, (m
2
) was 0.023, the loading factor, L, (m
2
/m
3
) was 2.2
and the area specific flow rate (m
3
/m
2
/h) was typically 2.6 for each material. The collection of air
samples was initiated after at least six air changes and the VOC, aldehyde and acetic acid
samples were all collected from the chamber exhaust stream at a total rate less than 90% of the
inlet air stream.
8
Data Analysis
The whole trailer emission rates normalized to floor area and the material specific emission
factors normalized to projected surface area were calculated assuming that the systems (trailer or
test chamber) were at pseudo steady-state and were well mixed. The steady-state form of the
mass balance equation for calculating area-specific emission rates, ER,(g/m
2
/h) in a well-
mixed system is
f
(
C C
)
ER =
0
(3)
A
where f (m
3
/h) is the ventilation flow rate, A (m
2
) is the exposed surface area of the material or
the floor area of the whole trailer, C (g/m
3
) is the measured steady state concentration in the
chamber or trailer and C
0
(g/m
3
) is the background concentration in the chamber or the outdoor
concentration for the whole trailer experiments. Ventilation rate in terms of air flow are not
readily available for the whole trailer measurements but given that ACH is equal to the
ventilation rate divided by the volume (f/V) and the loading factor is equal to the exposed area
divided by the volume, Eq. 3 can be rearranged to give
ACH
(
C C
)
ER =
0
(4)
L
where L (m
2
/m
3
) is the loading factor in the chamber or trailer. To relate the material specific
emission factors to the whole trailer emission rates we multiply the material specific emission
rates by the projected surface area of the material and divide by the floor area of the THU.
Normalizing to floor area facilitates comparison among units of different size. To get the floor
area normalized emission rate for the whole trailer experiments we note that ACH is equal to f/V
as indicated above and that V is the floor area multiplied by the height, h (m) so that Eq. 3 may
also be written as
ER = ACH h
(
C C
0
)
(5)
for estimating the area normalized emission factors for the whole trailers. The formaldehyde
emission rates were compared across trailers and differences between the morning samples and
afternoon samples were tested in Excel using the TTest function with two tailed distribution and
assuming the samples were of unequal variance. A probability associated with a Student's
paired t-Test with a two-tailed distribution less than 0.05 is considered significant.
RESULTS
Material specific loading ratios
The loading ratio for the different composite wood categories in the THUs are compared to the
recommended loading ratios in the HUD standard and the ASTM E6007 Standard in Table 5.
The recommended loading ratios in the HUD standard are for consistency in the emission
measurements and not necessarily intended to represent actual home designs. The loading ratios
are calculated from the total amount (surface area) of each composite wood type found in each
THU and the approximate internal volume of the THU where volume includes the entire indoor
space. No attempt was made to determine readily exchangeable volume where some of the
9
internal volume of the THUs is taken up by closed cabinet and storage space that may not
interact rapidly with the bulk air in the THU so the actual loading ratio of materials in the trailers
may be greater than reported in Table 5.
Additionally the ratio of air flow (f) to projected surface area of each wood type in each THU is
calculated and compared to the values defined in the HUD standard (Section 408). As with the
loading ratios, these airflows are only for standardization and not meant to represent actual
conditions in the indoor environment. The air flow is estimated as the product of the internal
volume and air exchange rate. Again, no attempt was made to determine readily exchangeable
internal volume so the f/A values reported in Table 5 might be biased high, i.e., actual flows are
likely to be lower than what is calculated in Table 5.
These calculations show that the loading ratios for Hardwood plywood range from between 2 to
3 times the loading ratio used in the HUD standard for which the concentration limits are
established. The ratios of air flow to projected material surface areas in the THUs do not match
those used in the standard either. Using HUD compliant hardwood plywood (HWPW) at the
loading ratio found in the four different manufactured THUs would be expected to result in a
steady-state room concentration 2 to 3 times higher the HUD concentration limit as determined
under standardized conditions with all other things being equal.
Whole trailer Ventilation and VOC measurements
When determining ventilation rates, the linear region of the decay curves in the tracer experiment
were monitored for approximately 2 hours after the CO
2
concentration had stabilized in each
THU. The duration of the decay curves and the correlation coefficient (r
2
) from the calculation of
ACH are included in Table 1. The outdoor CO
2
concentration during the ventilation
measurements was 366 ppm ± 1.6% and the indoor starting concentration for the decay curves
were a factor of 9.3, 6.5, 6.8 and 6.6 greater than outdoors for the Dutchmen, Pilgrim, Coachmen
and Cavalier, respectively. The minimum tracer concentration indoors relative to outdoor levels
at the end of the CO
2
decay period was greater than a factor of 3.4 for all units. The temperature,
relative humidity and wind speed (average ± the percent coefficient of variation (CV)) measured
during the two VOC sampling periods and during the tracer gas experiment are summarized in
Table 6. Wind speed and indoor/outdoor temperature gradient were similar for the morning
(AM) and afternoon (PM) air sampling events. The tracer gas-sampling period had calm wind
conditions and the indoor/outdoor temperature gradient was elevated compared to the air
sampling times.
In the initial qualitative analysis of VOC samples from the four THUs, approximately 80
individual compounds were tentatively identified in the four different units. Forty-five of the
compounds were positively identified and quantified. These target compounds were selected
because they were toxicologically important (i.e., benzene) and/or their concentrations were
relatively high. Thirty-three of the 45 chemicals that were quantified had steady-state
concentrations above 0.4 µg/m
3
in one or more of the units. The 33 VOCs are listed in Table 7
sorted by chemical class and increasing boiling point.
A number of higher molecular weight alkyl-benzenes were detected in one THU. These alkyl-
benzenes had analytical retention times between 36 and 40 minutes in the GC analysis and were
combined and quantified as toluene equivalents. The 2,2,4-Trimethyl-1,3-pentanediol
diisobutyrate (TMPD-DIB, TXIB) was quantified as 2,2,4-Trimethyl-1,3-pentanediol
monisobutyrate (TMPD-MIB, Texanol) although the toluene equivalent quantification gave
10
similar results. The steady-state concentration for each compound in the morning and afternoon
samples is given in Table 8 along with the morning and afternoon outdoor concentrations. The
indoor concentrations are converted to whole trailer indoor emission rates normalized to the floor
area for each unit and presented in Table 9.
Material Specific VOC measurements
All THUs had a significant fraction of the internal surface area (walls, ceiling, cabinet walls)
constructed of 1/8-inch plywood with a vinyl or PVC skin or simulated wood finish. All units
had sheet vinyl flooring while the Dutchmen and Pilgrim also had carpeted areas. All
countertops were particleboard surfaced with high-pressure laminate. A variety of wood products
were used for the sub-floor and for the bench and bed platforms.
Material specific emission factors were measured for the same target chemicals that were
identified in the whole trailer measurements. The emission factors for each material are first
summarized by individual THU in Tables 10 through 13. These values are converted to whole
trailer emission factors for each THU by multiplying the measured emission factor by the
projected surface area for each material in the trailer then dividing by the total floor area of the
trailer. These results are presented in Tables 14 through 17.
Percent Contribution of Material Specific Emissions to Whole Trailer Measurements
The values in Table 14 through Table 17 are transformed to the approximate percent contribution
to total pollutant load in each THU and reported in Tables 18 through 21. The chemicals are
sorted in order of decreasing emission for each THU. As an example, the total emissions of
formaldehyde from all materials in the Pilgrim is reported in Table 19 as 493 (µg m
-2
h
-1
) with
55% of the emission stream from “cabinet” material, 14% from walls, 8% from seat cushion and
small fractions from curtain, bed deck, carpet, and ceiling. These percentages should be treated
as approximations given the limited number of samples tested and the differences between the
test conditions and the actual whole trailer conditions. In addition, the results cannot distinguish
between primary sources and secondary sources that are re-emitting chemicals that have been
sorbed over time in the THU.
The total material specific emission factors across all materials normalized to the THU floor area
are compared to the average of the two field measurements for the whole trailer emission factors
for each THU in Table 22. These results further illustrate that the dynamics in the whole THU
likely suppress emissions from the primary sources given the long-term mixing of pollutants
among the indoor sources and competitive emissions in the whole trailer that do not exist in the
small chamber experiments with individual materials.
DISCUSSION
Building material emission measurements for formaldehyde and other VOCs have been
published in the literature over recent years. These emission factors may be used for comparison
to those measured in the THUs. However, it is important to note that both the whole THU
emission rates and the material specific measurements represent materials that have been
exposed to the entire mixture of VOCs in the indoor environment for the life of the THU. The
values from the chamber experiments and the whole trailer measurements do not necessarily
reflect primary emissions that are typically measured in standard protocols where new,
unexposed materials are tested after a specific aging period. In addition, the conditions used to
11