Health Care for the Elderly - How Much? Who Will Pay For It pot
Bạn đang xem bản rút gọn của tài liệu. Xem và tải ngay bản đầy đủ của tài liệu tại đây (327.42 KB, 5 trang )
MS
R
12
sePtember 5, 1999
The Business
Of Medicine
Health Care for the Elderly
How Much? Who Will Pay For It
By Victor R. Fuchs
H
ealth care expenditures on the elderly have
outpaced the gross domestic product (GDP) by
3.5 to 4.0 percent per year in recent decades.
1
This differential is partly attributable to demographic
change, with the number of elderly growing about 1.0
percent per year faster than the rest of the population. By
far the more important factor, however, is the rapid growth
of age/sex-specific consumption of health care by the
elderly.
2
If the trends of the past decade or two continue
until 2020, the elderly’s health care consumption in that
year will be approximately $25,000 per person (in 1995
dollars), compared with $9,200 in 1995.
3
If the current
public/private shares remain unchanged (a bit less than
two-thirds public, a bit more than one-third private), an
enormous increase in taxes will be necessary, and the elderly
still will be left with less income for other goods and services
than they had in 1995. Without a dramatic change in health
care costs, income, or both, health spending on the elderly
in 2020 is likely to be two to three times the income
available for all other goods and services.
4
• AGE/SEX-SPECIFIC EXPENDITURES. A more de-
tailed picture of the rate of growth of age/sex-specific
expenditures (Exhibit 1) shows the average annual per-
centage rate of change between 1987 and 1995 of Medi-
care payments in constant dollars. The calculations were
made by single years of age from a 5 percent sample of
Medicare patients and then smoothed with a five-term
moving average to reduce the effects of sampling variabil-
ity.
5
The rate of change tended to be greater at older ages
and somewhat greater for women than for men. On aver-
age, the rate of increase was between 4 percent and 5
percent per year in constant dollars. During that same pe-
riod real GDP per capita grew at only 1.2 percent per year.
It is this gap that is at the heart of the “Medicare problem.”
And because the private share of health care expenditures
looms so large in the total financial needs of the elderly, it
has major implications for the earnings-replacement prob-
lem as well.
Why did age/sex-specific expenditures increase so rap-
idly during a period when reimbursement rates for physi-
cians and hospitals were being held under tight rein? It was
not because physician fees for specific interventions were
growing rapidly; they were not. It was not because hospi-
tal admission rates were increasing or patients were staying
in the hospital longer; they were not. Moreover, the
growth of utilization over time cannot be attributed to
declining health of the elderly. On the contrary, age-spe-
cific health status probably has been improving over time.
Most experts believe that “technology” is the driving
force behind the long-term rise of health care spending.
In a survey of fifty leading health economists in 1995, 81
percent agreed with the statement, “The primary reason
for the increase in the health sector’s share of GDP over
the past 30 years is technological change in medicine.”
6
Expenditures grew primarily because the medical care sys-
tem was delivering more and better services to patients:
new drugs, magnetic resonance imaging (MRI),
angioplasties, hip replacements, and many other costly in-
terventions. Advances in medical technology have made
it feasible and desirable to do more for each patient and to
intervene with more patients.
• THE IMPACT OF TECHNOLOGY. The effect of tech-
nological advances on expenditures is rarely simple or im-
mediate. Occasionally a blockbuster “breakthrough” has a
rapid impact on expenditures; Viagra, the new male impo-
tence drug, for example, is expected to boost annual health
care spending by more than a billion dollars within a year
or two of its introduction.
7
More often, however, a tech-
nological advance such as a new drug, surgical procedure,
or diagnostic technique has only a modest effect on ex-
penditures initially. Over time, however, further develop-
ment, refinement, and diffusion of the technology result
in large increases in spending. This process of progressive
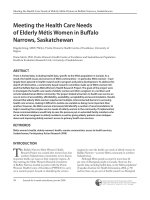
diffusion can be seen in Exhibit 2, which shows levels of
utilization of seven frequently used procedures in 1987
and 1995 and rates of change between those years. The
changes are age/sex-specific, thereby eliminating the ef-
fects of these demographic variables on changes in utiliza-
tion. All seven procedures showed substantial increases in
utilization between 1987 and 1995 for both sexes at all
ages. Even the rapid diffusion of angioplasty, which was
expected to obviate the need for coronary artery bypass
graft (CABG) for many patients, did not result in lower
utilization of the latter procedure. The median rate of
change for the thirty-five procedure/age groups was 11.1
percent per year for men and 10.7 percent per year for
PHOTO: Max Aguilera-Hellweg
MS
R
13
VOLUME 1VOLUME 1
VOLUME 1VOLUME 1
VOLUME 1 NumbeR 1
women. The rate of increase tended to be more rapid at
older ages.
One lesson from these data is that the attribution of
increases in expenditures to “technological change” must
be understood in a broad sense. None of the seven proce-
dures was a breakthrough in 1987. Instead, as physicians
developed greater confidence and capacity to perform the
procedures on more patients, especially on older patients,
utilization steadily increased. Most of the growth in health
care use probably follows this pattern, rather than the sud-
den appearance of a new intervention that is widely used
from the start. Increases in rates of procedures and other
interventions most likely have contributed to longer and
better-quality lives for many elderly persons. From 1987
to 1995 their age/sex-specific mortality rates declined at a
brisk pace (about 1 percent per year). It is possible that the
additional expenditures, on average, met reasonable cost-
effectiveness standards. If so, the key question is not, “Shall
we do it?” but rather, “Who will pay?” If expenditures
continue to grow at the same rate as they have in the past,
health care for the elderly in 2020 will require 10 percent
of GDP, compared with 4.3 percent in 1995. Will it be
possible to raise tax rates enough to maintain the
government’s current share? That seems unlikely. Will the
elderly have enough income to pay their current share, or
more, without seriously jeopardizing their ability to buy
other goods and services?
Nothing in current income trends of the elderly or in
prospects for greater Social Security retirement payments
in the future suggests that they will. What can be done?
There are only two possibilities to avoid the economic
and social crises foreshadowed in current trends. The na-
tion must either slow the rate of growth of health care
spending on the elderly or find ways to pay for the addi-
tional care.
• SLOW THE GROWTH OF HEALTH CARE
SPENDING. Only three routes exist to slowing the
growth of health care spending: (1) reduce the rate of
growth of the prices of the resources used in health care
(for example, squeeze physicians’ incomes); (2) produce
the same or more services with fewer resources (for
example, automate laboratory tests); or (3) slow the rate
of growth of real services to patients. The first route may
be politically popular as long as the bashing is confined to
physicians and drug companies, but it will not yield much
over an extended period of time. Managed care
organizations scored some quick gains this way in the mid-
1990s, but by 1998 the possibility of further squeezing
without jeopardizing quality of care has become much
smaller. Over a period of twenty years or more, trying to
pay lower prices for health resources can have only a
modest impact on the rate of growth of expenditures
because prices must approximately keep pace with the rest
of the economy, to attract resources to the health sector.
The second route, greater efficiency, faces problems similar
to lowering the prices of resources. A few quick gains can
be scored by eliminating obvious inefficiencies, but there
is little reason to expect that the health care system can
continue to achieve ever greater gains in efficiency decade
after decade without undermining quality of care.
Over the long haul, there is only one reliable way to
slow spending growth: slow the growth of services to
patients. Will this affect quality of care? Almost certainly.
Although some ineffective services are delivered in every
system and at every point in time, it is virtually impossible
to cut back only on those services without affecting the
delivery of other services that do extend lives, improve
functioning, or provide assistance with activities of daily
living. Furthermore, because technology is the principal
force behind the growth in use of services, the most
important strategy for slowing that growth must be to
slow the development and diffusion of new technology.
One way that public policy affects technology is through
Medicare, Medicaid, and other publicly funded health
insurance programs. Government’s willingness to pay for
particular services influences the adoption and diffusion
of technologies, and the pace of adoption influences pri-
vate investment in research and development. Govern-
ment also influences the development and diffusion of
technology by subsidizing medical research and the train-
ing of specialists and subspecialists.
If the rate of growth of age-specific expenditures could
be reduced by one percentage point per year, health care
spending per older person in 2020 would be less than
$20,000 (1995 dollars); if it could be reduced by two
percentage points per year, spending would average about
$15,000 per person, a figure that probably would be
manageable with modest tax increases and some realign-
ment of the elderly’s priorities regarding work, savings,
and consumption. But most present thinking in Washing-
ton is to accelerate the rate of growth of medical technol-
ogy. Proponents of this strategy usually assert that new
technology will reduce spending. On balance, it has not
worked out that way in the past, and there is no particular
reason to think that it will in the future. A technological
advance may cut the cost of performing a particular inter-
vention, or of treating a particular patient, but expendi-
tures depend on the number of units of service as well as
on the price per unit. For example, technological advances
in the computer industry have led to spectacular decreases
in price per unit of service; nevertheless, spending on
computers has soared. Much the same happens with most
technological advances in medicine.
• FIND WAYS TO PAY FOR THE ADDITIONAL
CARE. Most people want to live longer, better-quality
lives; therefore, some policy advisers prefer to focus on
MS
R
14
sePtember 5, 1999
finding ways to pay for more health care rather than on
slowing spending growth. After all, there is no physical
law or economic principle that says a nation cannot spend
10 percent of its GDP on health care for the elderly if it
chooses to do so. But how can this be accomplished? An
increase in government’s share of the bill seems very
unlikely. Indeed, even to maintain its current share, gov-
ernment will have to hike tax rates appreciably and make
major cuts in other programs. If the growth of services
were to continue as before, with many new and improved
interventions available to patients, the elderly would have
to be willing to forgo other goods and services, work
more than they have in the past, and greatly increase their
savings prior to retirement. These are not easy options.
Consider cutting back on other goods and services. If the
health bill were $25,000 per person (1995 dollars) in
2020, the elderly would have to adjust to a cut of more
than 20 percent in other goods and services relative to
1995, even if their share of the bill remained the same.
8
An increase of five percentage points in the elderly’s
share of health care spending would result in a further
decrease of more than 10 percent in income available for
other goods and services. There probably are limits to
how much the elderly would be willing to sacrifice an
adequate diet, a car that runs, or a roof that doesn’t leak
for more medical care. Given better health and longer
life expectancy, an increase in work may be one feasible
approach to curbing spending growth. Many policy ana-
lysts look to an increase in the Social Security retirement
age as a way of increasing labor-force participation at older
ages. Such an increase surely would help, but it is impor-
tant to note that many men and women substantially
decrease their paid work well before age sixty-two, the
age at which Social Security retirement benefits first be-
come available. Exhibit 3 shows indexes of mean annual
hours of all persons, percentage of persons working, and
mean hours of those who were working by single years of
age from forty-five to seventy-five, averaged over the years
1993, 1994, and 1995.
9
The values for ages forty-five to
forty-nine were set equal to 100.
10
By age sixty, men’s hours are only 67 percent of the
average of ages forty-five to forty-nine; for women, only
57 percent. The decrease in mean hours arises for two
reasons: (1) a decline in the percentage of persons who
have any paid work during the year, and (2) a decline in
average annual hours for those who are working. Exhibit
3 shows that the former is by far the more important
reason. At age sixty the percentage of men who have any
hours of work during the year is only 76 percent of the
average at ages forty-five to forty-nine; the comparable
figure for women is 64 percent. Some decline in average
annual hours of those who are working does occur, but
the change is much smaller than the percentage dropping
out of the workforce entirely. Moreover, only 3 percent
of the sixty-year-olds who had no paid work during the
year spent any time looking for work.
11
A critical examination of the public and private policies
that discourage older workers from seeking work and in-
hibit firms from employing them is badly needed. The
most important potential source of increased income for
the elderly is greater saving prior to retirement. The rea-
son is in the numbers: After age sixty-five, income from
savings (interest, dividends, and private pensions) is now
four times larger than income from work.
12
Thus, only a
25 percent increase in the savings rate prior to age sixty-
five would add as much to income as a doubling of work.
Furthermore, the nonannuitized portion of the increased
savings could be “spent down” in later years, thus adding
to the elderly’s capacity to pay for health care and other
goods and services.
How can current workers be induced to save more? Tax
incentives almost surely would help, as evidenced by the
EXHIBIT 2
Use And Rates Of Change In Use Of Seven Procedures, By Age And Sex, 1987–1995
Men Women
65–69 70–74 75–79 80–84 85+ 65–69 70–74 75–79 80–84 85+
Procedures per 100,000
Angioplasty
1987
1995
249
712
215
756
122
589
75
411
22
131
124
339
111
367
82
322
56
245
15
74
CABG
1987
1995
560
750
545
849
357
706
179
436
33
106
187
266
179
322
138
324
59
171
12
29
Cardiac
catheterization
1987
1995
1,146
1,624
1,135
1,863
74 0
1,652
379
1,109
111
399
708
1,086
709
1,254
483
1,064
182
706
52
183
Carotid
endarterectomy
1987
1995
182
321
287
460
246
553
174
433
65
152
111
221
132
229
132
273
95
217
30
77
Hip replacement
1987
1995
76
250
90
331
113
467
122
609
92
724
78
338
133
519
175
782
174
965
143
1,444
Knee replacement
1987
1995
160
403
182
478
205
529
200
385
70
164
218
523
278
657
322
667
242
475
82
193
Laminectomy
1987
1995
208
285
215
322
169
320
97
218
54
106
188
278
186
316
153
258
103
143
32
57
Average rate of change (percent per year from 1987 to
1995)
Angioplasty
CABG
Cardiac catheterization
Carotid endarterectomy
Hip replacement
Knee replacement
Laminectomy
13%
4
4
7
15
12
4
16%
6
6
6
16
12
5
20%
9
10
10
18
12
8
21%
11
13
11
20
8
10
22%
15
16
11
26
11
8
13%
4
5
9
18
11
5
15%
7
7
7
7
11
7
17%
11
10
9
19
9
7
18%
13
17
10
21
8
4
20%
11
16
12
29
11
7
SOURCE: V.R. Fuchs and M. McClellan, “Medical Technology and Mortality in an Aging Society” (National Bureau of Economic
Research paper in progress, 1998).
NOTE: CABG is coronary artery bypass graft.
MS
R
15
VOLUME 1VOLUME 1
VOLUME 1VOLUME 1
VOLUME 1 NumbeR 1
individual retirement account (IRA) program during
1981–1986. When public finance economists at the forty
leading U.S. university economics departments were asked
what percentage of inflows to IRAs represented net addi-
tions to national savings, the median estimate was 20
percent.
13
Tax incentives alone, however, probably would
not be enough. Many workers with average, or even
above average, income did not participate in the IRA
program and do not now participate in employer-spon-
sored 401-K plans, even when the employer would pro-
vide a matching contribution. In recent years millions of
Americans have reached age sixty-five without any sig-
nificant financial assets.
Not only is the average level of savings very low, but
inequality in income from savings of retirees is
extraordinarily large relative to inequality in employment
income of the same cohort when they were younger
(Exhibit 4).
14
To measure inequality, family income
reported in the Current Population Survey (CPS) was
divided equally among family members, and the ratio of
each person’s income to the median was calculated. At
ages sixty-five to sixty-nine in 1995, less than 10 percent
of persons had income between 0.6 and 1.4 times the
median of $1,800. Most of this age group were
concentrated at the extremes of the distribution: 36
percent had less than 0.2 of the median, and 42 percent
had more than 1.8 times the median. The inequality in
employment income experienced by this cohort when
they were ages fifty-five to fifty-nine (in 1985) or ages
forty-five to forty-nine (in 1975) was much less. Although
there are many factors that influence the ability to save
for retirement, employment income surely is the
dominant one. Thus, the data in Exhibit 4 suggest that
differences in the willingness to save probably provide a
major explanation for the huge inequality in accumulated
savings at retirement.
This view receives substantial support in a study by
Steven Venti and David Wise based on longitudinal
data from the Health and Retirement Survey. They
show that inequality in savings for retirement is not
primarily the result of inequality in earnings prior to
retirement: Households with the same lifetime earn-
ings approach retirement with vastly different levels of
accumulated wealth.
15
Even after adjustments for special factors that affect
the ability to save and for differences in investment
returns, the authors conclude, “The primary determi-
nant of the dispersion of wealth at retirement is evi-
dently the choice to save or spend while young.”
16
If
public policy aims at greatly increasing the elderly’s in-
come from savings while avoiding huge increases in in-
come inequality after age sixty-five, it seems that part of
the program would have to be compulsory. Even then,
if the elderly became more dependent on their own
income from work and savings, there probably would
be greater income inequality among the elderly than
there is now. Such a possibility should be evaluated in
context. Once Social Security retirement is added to
income from savings and employment, there is less total
income inequality at older ages than at any other age.
17
An inalterable commitment to an egalitarian policy after
age sixty-five probably would inhibit the changes in
work and savings that will be required to pay for future
increases in health care.
Long-term reform of medicare (and Social Security)
must face three harsh but inescapable facts. First, total
expenditures for health care of the elderly are rising
much faster than GDP, tax revenues, or the personal
income of the elderly. Second, the number of years
that the elderly are financially dependent on savings
and government transfer payments continues to increase
because rising life expectancy at age sixty-five has not
MS
R
16
SePtember 5, 1999
been matched by rising labor-force participation after that
age. Third, on average, Medicare pays for less than half of
the health care of the elderly, and Social Security retirement
benefits provide less than half of total personal income after
age sixty-five. Thus, efforts to “save Medicare” or “save So-
cial Security” miss the main point: Even when these efforts
move policy in the right direction, they will prove to be “too
little, too late” unless they are embedded in broader policy
initiatives that slow the rate of increase in health care spend-
ing and/or increase the income of the elderly.
__________
Victor R. Fuchs Victor R. Fuchs
Victor R. Fuchs Victor R. Fuchs
Victor R. Fuchs is the Henry J. Kaiser, Jr. Profes-
sor Emeritus at Stanford University, where he applies
economic analysis to social problems of national con-
cern, with special emphasis on health and medical care.
He has authored nine books, including the landmark Who
Shall Live? Health, Economics, and Social Choice (1974,
1998). He is the recipient of numerous distinguished
awards and is currently studying the relationships among
empirical research, values, and economic policy.
The author gratefully acknowledges financial support to
the National Bureau of Economic Research from the
Robert Wood Johnson and Andrew W. Mellon Foundations,
and the research assistance of Deborah Kerwin-Peck.
This article reprinted with permission from the January/February ’99 issue of Health
Affairs, pages 11-21. Copyright 1999, The People-to-People Health Foundation,
Inc., Project HOPE. Subscriptions and single copies of articles and journals are avail-
able. Please call 301-656-7401 or refer to www.projhope.org/HA.
FOOTNOTESFOOTNOTES
FOOTNOTESFOOTNOTES
FOOTNOTES
1. V.R. Fuchs, “Provide, Provide: The Economics of Ag-
ing,” in
Medicare Reform: Issues and Answers,
ed. T.R.
Saving and A. Rattenmaier (Chicago: University of Chi-
cago Press, forthcoming), currently available as National
Bureau of Economic Research (NBER) Working Paper no.
6642 (1998). Total health care spending on the aged for
1975, 1985, and 1995 was estimated by applying ratios of
total personal health care to Medicare payments as pre-
sented in D.R. Waldo et al., “Health Expenditures by Age
Group, 1977 and 1987,”
Health Care Financing Review
(Summer 1989): 116–120. Rates of change for 1975–1995
and 1985–1995 were calculated by the author.
2. For 1975–1995 and 1985–1995 the rate of change of
health care expenditures on the aged was decomposed into
(1) change in the age/sex-specific expenditures per person;
(2) change in the number of elderly persons; and (3) change
in the age distribution of the elderly. For both time periods
the rate of change of age-specific expenditures was more
than double the sum of the demographic effects. Fuchs,
“Provide, Provide.”
3. Ibid. Projections were based on past trends in age/sex-
specific expenditures in constant dollars combined with
Census Bureau population projections (middle series).
4. Ibid. Income available for other goods and services was
defined as total personal income minus personal taxes and
personal health care expenditures.
5. V.R. Fuchs and M. McClellan, “Medical Technology and
Mortality in an Aging Society” (NBER paper in progress,
1998).
6. V.R. Fuchs, “Economics, Values, and Health Care Re-
form,”
American Economic Review
(March 1996): 1–24,
Table 1.
7. D.J. Morrow, “The Elixirs of Life Style,”
New York Times,
11 November 1998, C1.
8. Fuchs, “Provide, Provide.”
9. CPS Utilities, March CPS Utilities, 1964–1996, Release
96.1 (1997) (Unicon Research Corporation, 1640 Fifth
Street, Santa Monica, California 90401; tel.:310-393-4636).
10. The actual values at ages forty-five to forty-nine are as
follows: average annual hours for all persons, 2,024 for men
and 1,439 for women; percentage working, 91 for men and
79 for women; average annual hours for those working,
2,217 for men and 1,817 for women.
11. CPS Utilities.
12. Fuchs, “Provide, Provide.”
13. V.R. Fuchs, A.B. Krueger, and J.M. Poterba, “Econo-
mists’ Views about Parameters, Values, and Policies: Sur-
vey Results in Labor and Public Economics,”
Journal of
Economic Literature
(September 1998): 1387–1425, Table
2.
14. CPS Utilities.
15. S.F. Venti and D.A. Wise, “The Cause of Wealth Disper-
sion at Retirement: Choice or Chance?”
American Eco-
nomic Review
(May 1998): 185–191.
16. Ibid., 191.
17. Fuchs, “Provide, Provide.”
Medicaid-covered asthmatic children high
utilizers of expensive emergency care
WESTPORT, CT (Reuters Health)
Children with Medicaid insurance appear to make more
emergency room asthma visits than do children with
capitated or fee-for-service coverage, according to Denver,
Colorado, researchers.
Dr. Mary D. Klinnert of National Jewish Medical and
Research Center, and colleagues, set out to determine
whether the type of medical insurance a child had was asso-
ciated with disease severity, type of care and other factors.
The researchers examined available medical records of
101 children and adolescents with severe asthma. Parents
also completed a series of questionnaires. Of the 93 sub-
jects who had complete records and insurance coverage, 47
had fee-for-service, 24 had capitated and 22 had Medicaid
coverage.
There were no significant difference amongst groups in
the number of hospital visits, days spent in hospital, total
number of physician/clinic visits, quality of life or func-
tional severity.
However, despite these similarities, the researchers es-
tablished that patients in the Medicaid group used less spe-
cialist care but “ sought more costly emergency room care
than did those in the fee-for-service or capitated groups.”
Given these findings, the investigators conclude that en-
couraging specialist rather than emergency care in such fami-
lies “ may or may not reduce functional severity or in-
crease quality of life, but it may reduce the overall costs.”
J Asthma 1999;36:271-279.