BÀI báo NHÓM 5 Môn tính toán ứng dụng nè
Bạn đang xem bản rút gọn của tài liệu. Xem và tải ngay bản đầy đủ của tài liệu tại đây (1.32 MB, 18 trang )
See discussions, stats, and author profiles for this publication at: />
Low‑field NMR investigation on interaction of ZnO nanoparticles with
reservoir fluids and sandstone rocks for enhanced oil recovery
Article in Journal of Petroleum Exploration and Production Technology · July 2022
DOI: 10.1007/s13202-022-01547-5
CITATIONS
READS
0
64
4 authors:
Osamah Alomair
Adel M. Elsharkawy
Kuwait University
Kuwait University
39 PUBLICATIONS 503 CITATIONS
80 PUBLICATIONS 2,141 CITATIONS
SEE PROFILE
SEE PROFILE
Waleed Al-Bazzaz
Salim Ok
Kuwait Institute for Scientific Research
Kuwait Institute for Scientific Research
88 PUBLICATIONS 246 CITATIONS
96 PUBLICATIONS 778 CITATIONS
SEE PROFILE
SEE PROFILE
Some of the authors of this publication are also working on these related projects:
Elastic Wave Velocity View project
Novel Fracture Characterization Technique and Its Application on Middle Marrat Tight Carbonate Formation View project
All content following this page was uploaded by Waleed Al-Bazzaz on 21 July 2022.
The user has requested enhancement of the downloaded file.
Journal of Petroleum Exploration and Production Technology
/>
ORIGINAL PAPER-PRODUCTION ENGINEERING
Low‑field NMR investigation on interaction of ZnO nanoparticles
with reservoir fluids and sandstone rocks for enhanced oil recovery
Osamah Alomair1 · Adel Elsharkawy1 · Waleed Al‑Bazzaz2 · Salim Ok2
Received: 19 October 2021 / Accepted: 4 July 2022
© The Author(s) 2022
Abstract
The use of nanoparticles (NPs) can considerably benefit enhanced oil recovery (EOR) by changing the wettability of the
rock, improving the mobility of the oil drop, and decreasing the interfacial tension (IFT) between oil and water. Prior to
the application of nanoparticles in oil fields, it is essential to conduct measurements at the laboratory scale. However, the
estimation of reservoir wettability is difficult in most laboratory experiments. Practicably, ZnO NPs were used to modify the
rock surface wettability, lower the IFT at the oil/water interface, and reduce the interaction of chemical adsorption, such as
(surfactant) onto reservoir rock surface to solve various challenges in oil production and EOR operations. Upon confining
both ZnO-based nanofluid and the crude oil into sandstone, deviations from the corresponding pure bulk dynamical behaviors
were observed with low-field nuclear magnetic resonance (LF-NMR) relaxometry. The expected deviations from the pure
bulk behaviors were attributed to the well-known confinement effect. The wettability test results before and after surface
variations of formation water (FW) with the addition of three different NP concentrations (0.05, 0.075, and 0.1) wt% ZnO
reflected significant changes to its wettability. Among the treatments of Berea sandstone cores with ZnO NPs, the percentage
of clay-bound H2O/free fluid index was maximum in 1.0 pore volume (PV) NP treatment. The ratio of NMR relaxations,
which determines the affinity of fluids toward solids, by the 1.0 PV NP treatment is reported to have the most potential with
higher affinity for FW and less affinity for crude oil toward the pore walls. Hence, LF-NMR allows monitoring of nanofluid
and crude oil characteristics in the pores of rock samples and may potentially be applied in further EOR studies.
Keywords Enhanced oil recovery · ZnO nanoparticles · Low-field NMR · Wettability alteration · Nanofluid treatment
Introduction
In the enhanced oil recovery (EOR) method, it is widely
known that at least 60–70% of crude oil remains trapped
as oil drops in pores in the discrete phase after primary
and secondary recovery because of capillary forces (Brea
et al. 2016). Since the demand for energy is increasing, the
petroleum industry is investigating new methods to recover
trapped crude oil where nanotechnology has shown promising results. The application of nanotechnology has been
* Osamah Alomair
1
Petroleum Engineering Department, College of Engineering
and Petroleum, Kuwait University, P.O. Box 5969,
13060 Safat, Kuwait
Petroleum Research Center, Kuwait Institute for Scientific
Research, P.O. Box 24885, 13109 Safat, Kuwait
2
successful in some cases, including reservoir characterization (Rahmani et al. 2015) and drilling (Hoelscher et al.
2012).
For the oil and gas industry, different nanotechnology applications have been proposed based on laboratory
experiments (Suleimanov et al. 2011; Zhang et al. 2014;
Onyekonwu et al. 2010; Cheraghian et al. 2020; Udoh et al.
2021). Most of the reported results in the literature showed
the potential of nanoparticles in improving oil recovery.
Nevertheless, to the best of our knowledge, few field trials have been reported. The first reported attempt to utilize
nanoparticles in a reservoir occurred in 2010, when Saudi
Aramco performed a push–pull test using A-Dots (carbonbased fluorescent nanoparticles) in the Arab D formation
of the Ghawar field. The results showed a high recovery
percentage, up to 86%, suggesting their high stability (Kanj
et al. 2011). Another trial was conducted in the same field
and confirmed their high stability (Kosynkin and Alaskar
2016). In the Columbia oilfield, aluminum oxide and silica
13
Vol.:(0123456789)
NPs were used for the inhibition and remediation of formation damage. After 8 months of injecting aluminum oxide,
the oil rate has increased by 300 bbl/d. Another trial using
silica resulted in an oil and gas rate increase of 134 bbl/d
and 1 MMSCF/d, respectively (Franco et al. 2017). Also in
the Columbia oilfield, an unnamed nanofluid was used to
enhancing the mobility ratio of heavy oils, and an immediate
increase in the oil production rate was observed along with a
reduction of 11% in the basic sediment and water production
(Zabala et al. 2016) In Brazil, stabilizing a shale formation
was achieved using a water-based drilling fluid containing
nanoparticles. The results showed good performance in
terms of shale hydration inhibition and wellbore stability.
The same fluid was stored and used to drill another section
in a different well after approximately 3 months and resulted
in a 15% reduction in the well’s cost (Barroso et al. 2018).
Due to their sizes ranging between 1 and 100 nm, the
physical and chemical properties of NPs differ from their
bulk behaviors (Suryanarayana et al. 1992 and Alsaba et al.
2020), and their unique properties allow them to have multiple impacts on the recovery of oil. NPs such as aluminum,
iron, titanium dioxide, and silica were found to act as nanocatalysts which are highly beneficial to catalytic reactions
during steam injection into heavy oil reservoirs due to their
large surface-to-volume ratio, small size, and varied shapes
(Hashemi et al. 2014). These nano-catalysts can be used to
conduct upgrading in heavy oil reservoirs, converting bitumen to lighter products (Yoosuk et al. 2008; Almao 2012).
These catalytic reactions fall under aqua-thermolysis which
also include the breaking of carbon–sulfur bonds within
asphaltenes, increasing saturates and aromatics in the heavy
oil, which also has an impact on oil recovery (Hyne 1986).
Another path through which NPs affect oil recovery is
their adsorption, which is a surface interaction that leads to
the transfer of a molecule from a fluid bulk to a solid surface.
This interaction mainly takes place between nano particles
and rock surfaces. The major forces that can contribute to the
adsorption process include electrostatic (Coulombic) interactions, charge transfer interactions, van der Waals interactions, repulsion or steric interactions, and hydrogen bonding
(Cheraghian and Hendraningrat 2016; Olayiwol and Dejam
2019; Murgich 2002; Kokal et al. 1995). The main functions
of NPs adsorption are to alter the rock wettability, lower
the oil–water interfacial tension (IFT), and reduce chemical
adsorption on the reservoir rock surfaces (Al-Anssari et al.
2016; Bera and Belhaj 2016; Hendraningrat et al. 2012; Ju
et al. 2006; Kazemzadeh et al. 2019; Nowrouzi et al. 2019;
Olayiwola and Dejam 2019; Saien et al. 2017; Zaid et al.
2013).
Wettability is a property of a fluid to cover a surface in the
presence of other immiscible fluids (Van and Chon 2016).
When oil and water are the immiscible fluids in oil reservoirs, the NPs strongly affect the rock surfaces wettability
13
Journal of Petroleum Exploration and Production Technology
to reduce the oil–water IFT (Ali et al. 2018), which systematically influences the capillary pressure, permeability, and
flow behaviors of fluids in the rock pores (Khalil et al. 2017).
During their injection into rock pore spaces, NPs have been
shown to arrange themselves in the oil–water–rock system
as a well-structured wedge film between the surface of the
rock and the oil, exerting a disjoining pressure on the film
and separating oil from the surfaces of the rock (Azizr et al.
2018; Khalilnezhad et al. 2019; Kondiparty et al. 2011).
One of the most favorable NPs is zinc oxide (ZnO), which
has a high surface charge and can function as a surfaceactive agent to replace surfactants (Soleimani et al. 2016).
The small size of the NPs allows penetration of smaller pores
to mobilize the capillary-trapped oil (Yahya et al. 2014).
The adsorption of NPs on rock surfaces in oil reservoirs can
modify the wettability condition from oil wet to water wet
(Gurgel et al. 2008; Lianga et al. 2019) with the formation
of an interface between the oil and water surfaces. Rezk and
Allam (2019) reported an increase of about 8% of oil-recovery efficiency when both ZnO NPs and a surfactant mixture
were employed when compared to a surfactant-based oilrecovery process in the case of sandstone.
However, NPs also have their limitations. For example,
their release into the aquatic ecosystems through industrial
wastewaters can induce pernicious effects on fish and other
organisms, increasing concerns of environmental hazards.
Several characteristics of ZnO NPs (e.g., size, shape, surface charge and agglomeration state) play a central role in
biological effects such as genotoxic, mutagenic, or cytotoxic
effects. Further, ZnO NPs may interact with the bacterial
surface and/or with the bacterial core, exhibiting different
bactericidal mechanisms (Jiang et al. 2009). Furthermore,
economic feasibility is the major drawbacks when employing nanoparticles (NPs) in the petroleum industry (Bera
and Belhaj 2016). Consequently, it has become necessary
to investigate applications of nanotechnology within a laboratory environment, especially before applying NPs in the
field.
Low-field nuclear magnetic resonance (LF-NMR) relaxometry techniques were developed in the laboratory to
enhance and support comparable NMR logging tools that are
currently used downhole. LF-NMR relaxometry has shown
that discrimination of water and oil saturation in core and
raw material can be easily determined. In such cases, the
NMR can detect the total water weight fraction and the total
oil weight fraction, the viscosity of the oil, the amount of
bound or mobile water and the amount of mobile or bound
oil (Mirotchnik et al. 1998; Mirotchnik and Kantzas 1999).
Additionally, LF-NMR has been applied in the crude oil
industry because of its high potential to determine fluid and
rock properties (Barbosa et al. 2015; Hou et al. 2020; Ok
and Mal 2019) using both in situ and ex situ methods. LFNMR has several advantages such as being non-destructive,
Journal of Petroleum Exploration and Production Technology
fast, reliable, and easy-to-operate (Barbosa et al. 2013; Jiang
et al. 2021). LF-NMR provides time-domain relaxation data.
In a typical NMR relaxation measurement, the relaxation
processes reinstate the equilibrium magnetization after excitation of the spin ensemble (Ridwan et al. 2020). Longitudinal (T1) and transverse (T2) NMR relaxation times explain
magnetization vector components that are parallel and perpendicular to the external magnetic field (B0), respectively.
The T1 and T2 values of molecules depend on fluctuations of
the NMR interactions due to molecular motions. Hence, T1
and T2 measurements have become conventional techniques
to explore molecular reorientations both in pure bulk state
and in confined geometries (Abragam 1961; Gautam et al.
2017; Vogel 2010). LF-NMR measurements of fluids confined into rocks can be utilized to predict several petrophysical properties including porosity, pore size distribution, and
free fluid index (Connolly et al. 2019).
In wettability measurements, nuclear magnetic resonance
(NMR) interrogates the character of water molecules which
changes based on whether the water molecules are in contact
with rock or in the liquid phase. Borysenko et al. (2009)
demonstrated that NMR determination of wettability showed
a good correspondence with contact angle measurements.
Odusina et al. (2011) used NMR to examine shale wettability, and Sulucarnain et al. (2012) studied shale wettability
and effective surface relaxivity. NMR offers advantages such
as being less expensive and faster than the USBM or Amott
methods for single measurements. NMR can also monitor
wettability changes, and the results can also be compared
with normal geophysical logs that directly interrogate the
reservoir in a continuous manner.
The goal of this study is to assess the potential of ZnO
NPs in EOR processes with the aid of LF-NMR, to reduce
IFT and alter wettability in the confined geometries and
nanopores of sandstone rock samples, where oil and water
molecules show strong deviations from their bulk behaviors.
To achieve this goal, ZnO NPs were first thoroughly characterized by elemental composition analysis and surface area
determination. Then, blends of formation water (FW) and
crude oil were studied in bulk using various approaches,
including IFT tests and water contact angle measurements.
Finally, the non-destructive and reliable LF-NMR technique
was applied to evaluate sandstone samples saturated with oil
and nanofluid.
From a practical viewpoint, this study will be valuable
in EOR for developing a new high-precision LF-NMR
approach, which is faster and more reliable in measuring
or estimating rock wettability through different chemical
conditions present in the oil fields. This method will be an
alternative to methods of Amott-Harvey, USBM (US Bureau
of Mines test), (sessile drop) methods used in the laboratory
and reservoir, Anderson (1986), and Abdallah et al. (2007).
The novelty of the work lies in the fact that the wettability
of the rock surface affects the distribution of fluids within
the pore space, and the oil and water distribution can be
obtained by comparing the NMR relaxation data at different
saturations (Al Harbi et al. 2017). Also, accessible advance
integrated petrophysical evaluation for in situ wettability
to support the field development and improve the reservoir
characterization.
Experimental details
Materials and properties
Core samples
Synthetic Berea Sandstone core plugs were purchased from
Kocurek Industries Inc. (Houston, TX, USA). The core
samples were cleaned using distillation–extraction Soxhlet apparatus with a 50/50 mixture of toluene/methanol
and subsequently dried in a vacuum oven at 80 °C (1CE,
Thermo-Fisher Scientific with Hydraulic Thermostat Controller, UK). The porosity and permeability of the core test
samples were measured using Helium PHI-220 Porosimeter
and KA-210 Gas Permeameter, respectively. Both instruments were supplied by Coretest Systems, Inc., USA. The
porosities at pressure and temperature (400 psia, 25 °C) and
for permeabilities (250 psia, 25 °C) were measured at a confinement pressure 500 psia as recommended by the manufactures. The core properties are shown in Table 1. The average
element analysis using (EDXRF, Epsilon-1 Malvern analytical Ltd UK) are presented in Table 2, and X-ray diffractometer (XRD) analysis, using D8 Advance Bruker GmbH, was
performed to reveal the amount of different crystals existing
in the Berea Sandstone specimens as shown in Fig. 1. Formation water (FW)
FW of low salinity and low conductivity was employed
in this study. The conductivity, total dissolved solids (TDS),
and salinity of the FW (30,000 ppm) were measured using
a VWR traceable hand-held meter (Chemicals and Laboratory Scientific Company), while the turbidity was measured
using a HACH model 2100P portable turbidimeter (GmbH,
Germany). The detailed physicochemical properties of the
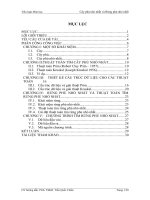
FW are summarized in Table 3. Besides, the distribution of
the solid particles in the FW was determined using dynamic
light scattering (DLS) by a Zetasizer Nano ZS-ZEN3600,
DLS, USA. The average particle diameter was 1760 nm after
filtration with sterile poly-ether sulfone (PES) syringe filters
with four layers, followed by a membrane filter, resulting in
average particle size of 380 nm.
The particle size distribution of FW averaged at 1250 nm,
obtained by DLS (Fig. 2). In addition, the rock heterogeneity was qualitatively observed from the frequency graph
of the pore throat diameter (Fig. 3). The fraction of pores
13
Journal of Petroleum Exploration and Production Technology
Table 1 Dimensions and petrophysical properties of the core samples
Serial
Length (cm)
Diameter (cm)
Bulk volume (cm3)
Pore volume,
PV (cm3)
Lithology
Porosity (%)
Air permeability
(md)
S0
S1
S2
S3
S4
S5
S6
7.42
7.65
7.36
7.38
7.57
7.49
7.51
3.78
3.78
3.78
3.78
3.78
3.78
3.78
83.226
85.805
82.553
82.777
84.908
84.011
84.235
15.724
15.985
15.206
15.501
15.529
15.235
15.735
Sandstone
18.9
18.6
18.4
18.7
18.3
18.1
18.7
125
124
138
120
120
138
144
Table 2 Elemental analysis of Berea sandstone
Chemical Formula
Quantity (wt%)
SiO2
Al2O3
Fe2O3
K 2O
Na2O
SO3
CaO
Mn3O4
ZrO2
P2O5
SrO
ZnO
PbO
SrO
88.44
4.55
1.31
1.112
0.341
0.202
0.311
0.037
0.036
0.018
0.005
0.002
0.003
0.004
(y-axis) was calculated as the volume of injected mercury
divided by the pore volume of the core sample. The pore
size distribution of Berea sandstone is normal with a relatively narrow peak less than those suggested by Gong et al.
(2020). Thus, the FW is considered suitable for the present
study because the particle size distribution is less than the
pore size distribution. The rock heterogeneity might be also
qualitatively observed from the frequency graph of the pore
size distribution.
Crude oil
Samples of crude oil were collected from a Kuwaiti oilfield;
the field produces medium to light crude oil with an API
gravity of 28–36°. The samples were stored in specially
designed screw-cap bottles under dry conditions in a thermostatic fume hood at 25 °C. The basic sediments and water
(BS&W) were determined using the ASTM D4007-11. The
density was measured at 25 °C using a precision digital
Anton Paar oscillating U-tube densitometer, DMA4500,
13
with a reproducibility of 10–2 kg m3. The dynamic viscosities were also measured as a function of temperature (20,
25, 30, and 40 °C) using an SVM 3000 Stabinger Anton
Paar viscometer. SARA Analysis (saturates, aromatics, resins, and asphaltenes) was done using IATROSCAN MK-6s
(Mitsubishi Chemical Medience, Japan). The physical properties of the crude oil are tabulated in Table 4.
Zinc oxide (ZnO) nanoparticle (NP)
ZnO NP was purchased from Skyspring Nanomaterials Inc,
USA, without any additional treatment. The properties of
ZnO NP shown in Table 5 were investigated experimentally
using an automatic absorptiometry surface area analyzer
(ASAP-2010, Micrometrics USA).
Methodology
Stability, dispersion, and adsorption of the ZnO NP
Particle stabilization is important for preventing particle
agglomeration and formation damage. To represent real
operating conditions, known masses of all the NPs of ZnO
at three concentrations of (0.05, 0.075, 0.1) wt% were mixed
with FW (30,000 ppm) and stirred continuously for 3 h using
a digital stirring plate (Thermo Scientific, USA) at 500 rpm,
with overnight storage in an oven at 30 °C. A cloudy solution was observed in all samples. To avoid high dispersion
of NPs in the solution and reduce or prevent the possibility of particle agglomeration, each prepared solution was
subjected to ultrasonication for 60 min using a Hielscher
ultrasonic mixer (model UP200s, GmbH), as proposed by
Chung et al. (2009) and Graves et al. (2019). Moreover,
to evaluate the dispersion stability of nanofluids, the zeta
potential (ξ-potential) was measured and calculated using
the Helmholtz–Smoluchowski equation (Wilson et al. 2001;
Munson et. al. 1998).
In the Brunauer–Emmett–Teller (BET) method of surface area analysis (Brunauer et al. 1938), liquid nitrogen is
Journal of Petroleum Exploration and Production Technology
Fig. 1 XRD of the dry Berea
sandstone core
Table 3 Properties of the FW
8000
Concentration
Units
7000
Salinity
Total suspended solid (TSS)
Turbidity
pH
Conductivity
Strontium
Boron
Barium
Lithium
Silicon
Nitrate (as NO3)
MgCl2·6H2O
CaCl2·2H2O
BaCl2·2H2O
SrCl2·6H2O
Na2SO4
30,000
2.400
0.430
6.030
46.000
75.150
48.066
3.792
7.634
14.893
0.000
55.790
143.816
0.014
3.302
0.887
mg l−1
mg l−1
NTU
@ 25 °C
(mS cm−1) @ 25 °C
mg l−1
mg l−1
mg l−1
mg l−1
mg l−1
mg l−1
mg l−1
mg l−1
mg l−1
mg l−1
mg l−1
6000
usually used at partial vacuum conditions to cool surfaces
and detect adsorption since the interaction between gaseous and solid phases is generally weak. N2 (− 195 °C) gas
used was a 99.999% pure product of Kuwait Oxygen and
Acetylene Company KOAC (Kuwait). The specific surface
areas (SBET) were calculated from the BET equation in its
linear form (Brunauer et al. 1938) with the nitrogen molecule cross-sectional area taken to be 16.2 × 10⁻²⁰ m2 (linearity region between 0 and 0.35 p/p0). The total pore volume
Average particle size,
(nm)
Designation
Formation Water
Filtered with Sterile Polyethersulfone Syringe Filters PES syring
Filtred with 0.7 um membreane filter
5000
4000
low salinity formation water after filtration
with average size 1350 nm
3000
2000
1000
0
0
200
400
600
800
1000
Time, min
Fig. 2 DLS results of FW
was estimated from a single point on adsorption isotherm at
p/p0/0.975 (Badalyan et al. 2003 and Brundle et al. 1992).
The pore size distributions were calculated in the standard
manner using the Barrett–Joyner–Halenda (BJH) method
(Barrett et al. 1951), and the pore size analyses done as
stated by Siegbahn et al. (1967) are shown in Table 4.
IFT and contact angle measurements
The main purpose of these measurements is to evaluate the
effect of ZnO NP on IFT and contact angle and to subsequently determine the optimum concentration of NP using
NMR. The IFT for the oil/FW and oil/nanofluid systems was
characterized, using a drop shape analyzer (DSA 100, Kruss,
13
Journal of Petroleum Exploration and Production Technology
Fig. 3 Pore throat diameter distribution of Berea sandstone
45
Average of sand stone throat diamter
40
35
Frection of pores,
(%)
30
25
20
15
10
5
0
35
25
10
2.75
2.12
2.05
1.84
1.75
1.6
1.5
0.15
Pore Throat Dimeter,
Table 4 Physical properties of dry crude oil samples
Sample
Units
Water content at 2500 rpm
Sediment
Crude oil assay
Dynamic viscosity @ 20 °C
Dynamic viscosity @ 25 °C
Dynamic viscosity @ 30 °C
Dynamic viscosity @ 40 °C
Density @ 25 °C
SARA test
Saturate (S)
Aromatic (A)
Resin (R)
Asphaltene (As)
5 mL
0.025 mL
41.7 mPa s
30.0 mPa s
21.7 mPa s
10.6 mPa s
0.8915 g cm−3
9.10%
68.93%
13.17%
8.80%
GmbH), based on the pendant drop method (Ayatollahi and
Zerafat 2012). The contact angles between the fluids under
study and the selected Berea Sandstone were determined,
and the wettability was identified according to the criteria
(Teklu et al. 2015).
The apparatus was calibrated according to manufacturer recommendations with the standards provided; these
standards consist of glass slides with modeled drop shapes,
which are accurately calculated. Glass slides were used to
calibrate the apparatus using the Young–Laplace method.
Shapes with contact angles of 30°, 60°, and 120° each for
standard and microscope optics deviated by less than 0.1°
from their nominal values. The sessile drop was used for
preferential determination of wettability test used in core
flooding tests for measuring the contact angle directly. The
flooded cores were cut in slices and prepared following the
13
same method proposed by Ayatollahi and Zerafat (2012),
and the drop of the nanofluid was introduced at the surface. The DSA-100 apparatus equipped with a high-resolution camera and digital processing software was used
to perform contact angle measurements, and the results
of measurements were checked for repeatability at least
three times for each experiment. Finally, the results were
averaged.
Fluid displacement experiments
Fluid displacement experiments were carried out in the
core flooding system shown in Fig. 4. The system was
mainly used to prepare the core plugs needed to conduct
the NMR experiments based on the optimum results originated from IFT and contact angle. Besides the dry core
sample (S0), which was used as reference for NMR, the
following six samples were prepared: (S1) 100% saturation with FW; three pore volumes of FW were injected in
the clean dry rock sample followed by soaking the core
in FW at a rate of 0.5 cm−3 min−1 for about 1 h to ensure
complete saturation. (S2): 100% saturation with crude oil;
three pore volumes of crude oil were injected in the clean
dry rock sample; then the core was infused with the crude
oil at the rate of 0.5 cm−3 min−1 for about 1 h to ensure
complete saturation. (S3–S6): rock restoration and nanofluid injection; the remaining rock samples were restored
to represent reservoir saturation profile; initially flooded
with FW until reaching 100%; in the next step, oil sample
was injected at a rate of 0.5 c m −3 m in −1 until no more
water was removed; then nanofluid was injected with a
specified concentration and required pore volumes.
Journal of Petroleum Exploration and Production Technology
Table 5 Physicochemical
properties of ZnO NPs
Designation
Units
Purity
Average particle size, (APS)
Thermal conductivity
Surface area
Single point surface area at P/Po = 0.236288865
BET surface area
t-plot external surface area
Barrett–Joyner–Halenda (BJH) adsorption cumulative surface area of pores between
1.7 and 300 nm width
Pore volume
BJH adsorption cumulative volume of pores between 1.70 and 300.0 nm width
Single point adsorption total pore volume of pores less than 459.0618 nm width at
P/Po = 0.995788234
Pore size
Adsorption average pore width (4 V/A by BET)
BJH adsorption average pore width (4 V/A)
Horvath–Kawazoe maximum pore volume at P/Po = 0.844589971
Median pore width
99.80%
10–50 nm
21 W m−1 K−1
22.5774 m2 g−1
22.9994 m2 g−1
21.7274 m2 g−1
23.9910 m2 g−1
0.098833 cm3 g−1
0.098679 cm3 g−1
17.16205 nm
16.4779 nm
0.025370 cm3 g−1
3.7483 nm
Fig. 4 Flow diagram of core
saturation and flooding equipment
LF‑NMR relaxometry details
y(x) =
The LF-NMR relaxometry data of the rock core samples
were obtained on a 2.35 MHz Oxford GeoSpec2 Instrument,
UK, with a 43-mm-diameter probe using the software Lithometrix 8.5.0. In flooded sandstone rock cores, the duration
of the 90° pulse was 9.5 μs. To obtain T2 data, the Carr–Purcell–Meiboom–Gill (CPMG) pulse sequence was used with
a recycle delay time of 1125 ms, while an inversion recovery
pulse sequence with a 3000 ms recycle delay time was used
for the T1 data. The number of detected points (spin echoes)
in the T2-pulse sequence was varied within the range from
32,401 to 4630 depending on the sample, and 12,963 was for
oil and 115,741 for water. Three-exponential fitting analysis
of T1 relaxation data was performed according to the following equation:
3
∑
i=1
)
(
x
Ai exp
T1(i)
(1)
where x stands for the signal detection time and T1(i) is the
longitudinal relaxation time of the i-th component with
respective amplitude Ai. A three-exponential fitting analysis
of the T2 relaxation data was then performed according to
the following equation:
y(x) =
3
∑
i=1
(
Ai exp −
x
T2(i)
)
(2)
where x stands for the signal detection time and T2(i) is the
transverse relaxation time of the i-th component with respective amplitude Ai (Aursand et al. 2008; D’Agostino et al.
2012). The three-component fitting gives the freedom of
13
Journal of Petroleum Exploration and Production Technology
)4 (
(
)
𝜙
FFI 2
∗
k = 𝜙4 ∗ T12 k =
C
BVI
NP distibution after Sonication
225
200
175
150
125
100
StabilzaƟon of NF
75
50
Start AgglomeraƟon
25
0
0
100 200
300 400
500 600 700 800
Time, minutes
900 1000 1100
Fig. 5 Average particle size distribution of ZnO in FW after sonication
(3)
where k is the permeability (millidarcy: md), T1 is the longitudinal relaxation time (s), ϕ is the fractional porosity
(m3 m−3), C is an empirical coefficient ( md–0.25), BVI is the
bound water volume index, and FFI is the free fluid index.
For processing the T1 distribution data of sandstone cores
using Eq. 3, the default value of 10 was employed for C
(Coates coefficient: p.u./md1/4) (Trevizan et al. 2015). T1 distributions were utilized in the present study to estimate both
the volume of producible fluid (Straley et al. 1991) and to
show potential wettability alterations in sandstone rocks with
certain porosities because T1 distributions are reflections of
porous media saturated with different fluids: low viscous FW
versus highly viscous crude oil (Giraldo et al. 2013; Dang
et al. 2013). The NMR estimate of a product is most often
considered as the free fluid index (Straley et al. 1994).
Results and discussion
Stability, dispersion, and adsorption of ZnO NP
It was concluded that the stability of nanofluid depends on
the pH, NP size, NP type (hydrophilic, hydrophobic, and
amphiphilic), dispersion fluid, and ultrasonication time. The
stability of dispersions is their long-term integrity and ability to remain in their initially formulated state by remaining
as close as possible to their initial physical state. Because
complex formulations are unstable by nature, the apparent
dispersion stability can only be evaluated when the dispersed
phase remains suspended, as stated by Tso et al (2010). The
particle size distribution of ZnO nanofluid is shown in Fig. 5.
13
250
Average. particle size,
dimeter,(nm)
determination of differing fractions, either heavy or light,
of the crude oil in bulk and assigns the confined fluids inside
such pores with different porosities.
Considering bulk crude oil, we suggest that the shortest
T2 value (T2(1)) is attributed to the heaviest components,
asphaltenes and resins, while the longest T2 value (T2(3))
to saturated aliphatic chains, where T2(2) values belong to
aromatics; referring to A1, A2, and A3 values, it is possible
to suggest the percentages of crude oil fractions. In the confined fluids, three-component fitting is preferred to describe
how the two fluids are distributed in the pores with various
sizes.
The continuous distributions of T1 were obtained from
T1-inversion recovery relaxation using the CONTIN algorithm (Provencher 1982). The permeability and porosity
were determined using the following equation for T1 distributions (Alvarado et al. 2003; Kenyon and Kolleeny 1995;
Aghda et al. 2018):
Fig. 6 Non-negative least square method shows the dispersion of
ZnO NP in formation water at 60 and 1000 min
The zeta potential is a key indicator of the stability of
a colloidal dispersion. The measured ξ-potential values of
the ZnO nanofluid of concentration (0.05, 0.075, and 0.1)
wt% were − 28.8, − 29.8, and − 29.1, respectively, with
an average value of − 29.23, indicating a certain degree of
electrostatic repulsion between adjacent similarly charged
particles. Colloids with high zeta potentials (negative or
positive) are electrically stabilized. A value of ± 25 mV
can thus be taken as the arbitrary threshold that differentiates low-charge surfaces from highly charged surfaces
(Dukhin and Goetz 2010).
The dispersion of ZnO NP in FW was measured using
DLS based on the non-negative least-square algorithm
method (Lawson and Hanson 1974). This suggested that
using the ultrasonic processor during nanofluid preparation might break down the agglomeration of NPs and
improve their dispersion. Figure 6 shows the normal distributions using the algorithm method to reconstruct particle
Journal of Petroleum Exploration and Production Technology
size distribution (PSD) from DLS data at 60 and 1000 min
indicating the stability of the dispersion with time.
The ability of ZnO for adsorption built on BET isotherm model was investigated by plotting the amount of
gas adsorbed as a function of the relative pressure (GomezSerrano et al. 2001; Maa et al. 2019). The adsorption type
is (Type II). This is most frequently found when adsorption
occurs on nonporous powders or powders with diameters
exceeding micropores and the Inflection point occurs near
the completion of the first adsorbed monolayer. Figure 7
shows the relationship between relative pressure (P/Po) and
ZnO adsorption capacity measured by quantity adsorbed
(Q) = 62.79 cm3 g−1 STP. Indeed, the conventional methods
such as BET and BJH models cannot distinguish between
different pore structure morphologies to account for the
effects of microporosity and predict the pore sizes that could
be independently determined using XRD and transmission
electron microscopy (TEM) with the precision unavailable
earlier. Density functional theory (DFT) methods have been
first suggested by Lastoskie et al (1993) for calculating the
pore size distribution of carbons from nitrogen adsorption
data. The main advantages of the DFT methods are related
to its rigorous theoretical basis that covers the whole region
of micro- and mesopores and provides an opportunity of
customization to different adsorbates (nitrogen, argon, and
carbon dioxide), materials (silicas and carbons), and pore
morphologies (slit-like, cylindrical, and spherical); the
hybrid models that include different groups of pores were
designed for hierarchical materials. Furthermore, the computational quantum mechanical modeling method, used in
materials science, aids the investigation of adsorption structures and mechanisms of water adsorption on a high-index
polar surface of ZnO. It provides explanations of not only
the water adsorption behaviors of high index polar surfaces
of ZnO but also guidance to all the adsorption behaviors of
nanomaterial surfaces.
Effect of ZnO NP on IFT and contact angle
×
Fig. 7 Relation between relative pressure (P/Po) and measured quantity adsorbed (Q) calculated by BET methods for ZnO nanoparticles
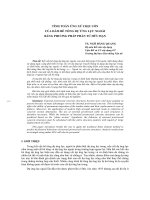
Fig. 8 Measured IFT between
crude oil samples and different
concentrations of ZnO NPs
Different nanofluids were prepared by mixing ZnO NP at
various concentrations (0.05, 0.075, 0.1) wt% with FW of
different salinities. Figure 8 shows the IFT between the
crude oil sample and the prepared nanofluids. It was found
that as the concentration of NP increased the IFT of crude
oil, and that of nanofluid decreased, where the minimum
IFT value was obtained when using the nanofluid with the
highest ZnO NP (0.1 wt%); these results agree with other
reported results (Hendraningrat et al. 2013, 2012).
On the contrary, wettability measurements were obtained
before and after surface modifications with different concentrations of NPs (0.05, 0.075, and 0.1 wt% ZnO) in FW
20
18
16
IFT, mN/m
14
12
10
8
IFT of water of different salinity with oil 27.2 API
6
IFT of 0.05 % ZnO in different salinity with oil 27.2 API
4
IFT of 0.075% ZnO in different salinity with oil 27.2 API
2
0
IFT of 0.1 % ZnO in different salinity with oil 27.2 API
0
10000
20000
30000
40000
50000
60000
70000
80000
90000
100000
Salinity, ppm
13
Journal of Petroleum Exploration and Production Technology
Fig. 9 Contact angles of rockFW (30,000 ppm) and NP-oil
systems
Table 6 Mass of rock core
samples before and after
LF-NMR measurements
Sample no
Experiment
Mass before (gm)
Mass after (gm)
Δ Mass (gm)
S0
S1
S2
S3
S4
S5
S6
Blank rock
Rock + FW
Rock + oil
Rock + oil + 0.5 PV nanofluid
Rock + oil + 1.0 PV nanofluid
Rock + oil + 1.5 PV nanofluid
Rock + oil + 2.0 PV nanofluid
27.9931
26.8585
27.7621
28.8715
28.0212
27.4100
26.7043
27.9758
26.5114
27.7276
28.5500
27.8348
27.2314
26.4966
0.0173
0.3471
0.0345
0.3215
0.1864
0.1786
0.2077
(30,000 ppm). The calculated values were obtained by analyzing the complete shape of the oil droplet using a precise
video system and analysis software. Figure 9 shows that the
surface immersed plates with and without nanoparticles.
It could be seen that the value of dynamic contact angles
for FW with no NP decrease at range (70.46–56.90°), with
the drop value near to 19% of the original value, but for
FW with NP at concentration range (0.05, 0.075, and 0.1)
%, were (59.26–21.00°), (51.64–15.39°), and (47.92–12.3)
respectively, indicating altered wettability in the water-wet
condition. A stronger shift in wettability was achieved by
increasing the NP concentration in the FW up to 0.075 wt%
but small effect reaches the concentration 0.1 wt% (Fig. 9).
Fig. 10 Comparison of T1 relaxation curves of bulk and confined
crude oil (S2)
LF‑NMR relaxometry
Dynamics of confined fluids
As stated earlier, the LF-NMR experiments were designed
based on the results obtained through the IFT and contact
angle measurements. Accordingly, 0.1 wt% ZnO nanofluid
and 30,000 ppm of FW were used. Table 6 summarizes the
details of the LF-NMR experiments conducted.
Figure 10 shows a representative comparison of the T1 relaxation curves of bulk crude oil and confined crude oil (S2).
As expected, the T1 relaxation time of the confined crude
oil (S2) shifted to lower values compared with that of the
bulk crude oil. A similar, even stronger deviation in the T1
13
normalized intensity
( a.u )
1.0
Bulk crude oil
0.8
Confined crude oil in rock
0.6
0.4
0.2
0.0
0
150
300
450
600
750
900
1050
1200
time (ms)
Journal of Petroleum Exploration and Production Technology
Table 7 T1 values of fluids in
bulk and confined states
Case
T1(1) (ms)
T1(2) (ms)
T1(3) (ms)
A2(1) %
A2(2) %
A2(3) %
Bulk crude oil
Bulk FW
S0
S1
S2
S3
S4
S5
S6
202.7
2649.0
–
105.3
68.7
66.4
64.0
68.7
62.0
49.9
–
–
16.6
19.5
18.7
14.7
16.3
16.9
7.6
–
–
3.3
3.8
4.0
3.3
3.3
4.3
50.3
100.0
–
20.0
43.0
36.4
43.4
38.0
42.4
35.7
–
–
58.9
41.0
39.4
34.3
41.0
30.3
14.0
–
–
21.1
16.0
24.2
22.2
21.0
27.3
1.0
Bulk crude oil
Confined crude oil in rock
normalized intensity
(a.u)
0.8
0.6
0.4
0.2
0.0
0
150
300
450
600
750
900
1050 1200 1350 1500
time (ms)
Fig. 11 Comparison of T2 relaxation curves of bulk and confined
crude oil (S2)
relaxation curve toward shorter times was observed in the
case of FW (S1), as seen from Table 7. The T1 values were
determined using Eq. 1, based on three-component exponential growth fitting.
Figure 11 compares the T2 relaxation curves of the bulk
and confined crude oil (S2). As demonstrated in Table 7,
the T2 relaxation values of the confined crude oil (S2) are
lower than those of the bulk crude oil. Additionally, compared with that of bulk FW, a stronger deviation in the T2
Table 8 T2 values of fluids in
bulk and confined states
relaxation curve with a shift toward shorter relaxation times
was observed in confined FW (S1). This stronger deviation
in FW is explained by the strong interaction between the
water molecules and pore walls. The former preferably fill
the smallest pores, and the surface relaxivity controls and
reduces the T2 value. Thus, the T2 values of confined fluids
are even lower than the corresponding T1 values. Similarly,
significant reductions in the relaxation times of the crude
oil confined in rock samples compared with the bulk relaxation times offer evidence of surface relaxation (Freedman
et al. 2003). A possible explanation is that when oil fills
the larger pores, the ZnO NPs form an interphase (Myint
et al. 2013; Soleimani et al. 2016), forming different types of
environments: water in the smallest pores with the shortest
relaxation, oil molecules in the larger pores, and mixed wettability, with water molecules wetting the pore walls, ZnO
NPs between oil and water, and oil molecules not interacting directly with the pore walls. Table 8 summarizes the T2
results, confirming that the deviations in the dynamic behaviors of the confined fluids from those of the bulk fluids are
independent of NP treatment. The T2 values are determined
using Eq. 2, according to a three-component exponential
decay fitting.
The first critical issue concerns the confinement effect
on the dynamics of the fluids. Confinement in this case
refers to “molecular confinement” where the crude oil and/
or water molecules have spatial restrictions and different
Case
T2(1) (ms)
T2(2) (ms)
T2(3) (ms)
A2(1) %
A2(2) %
A2(3) %
Bulk crude oil
Bulk FW
S0
S1
S2
S3
S4
S5
S6
160.5
2173.0
–
89.4
64.4
53.1
47.8
55.1
56.2
47.8
–
–
15.8
17.9
14.0
13.1
14.7
15.1
7.1
–
–
1.9
2.9
2.9
2.2
2.7
2.9
44.1
100.0
–
15.8
33.9
27.7
30.5
27.6
26.9
36.6
–
–
44.7
41.3
42.2
37.5
39.2
40.0
19.4
–
–
39.5
24.7
30.1
32.0
33.1
33.1
13
Journal of Petroleum Exploration and Production Technology
local chemical environment in the rock sample pores compared to that of bulk. In the confined geometry and environment, different properties such as dynamics of the molecules
could differ from those in bulk. Independent of the chemistry, when the fluids (water or crude oil) were confined to
sandstone, both T1 and T2 decreased. This shows that the
confinement effect influences the wettability of the fluids
with the grain walls. The second critical issue is the percentage of fluids in the bulk and confined states. Bulk FW has
only a single value for both T1 and T2. However, the SARA
(saturates, aromatics, resins, and asphaltenes) components
of crude oil are considered with three different T1 and T2 values: longer, medium, and shorter. For the bulk crude oil, the
lower T2(3) value of 7.1 ms constitutes 19.4% (A2(3)), which
corresponds to the heavy components (asphaltene + resins)
of the crude oil. The larger T2(1) value of 160.5 ms constitutes 44.1% (A2(1)) and is attributed to the lighter fractions
(saturates) of the crude oil, as is also suggested in the literature (Volkov et al. 2021). The lighter fractions of the crude
oil should thus have greater T1 and T2 values. Following
the same approach, it is observed that in the confined state,
crude oil has similar percentages of the different fractions
under the different NP treatments.
T1/T2 ratios: affinity of fluids toward pore walls
To determine the affinity of the fluids toward the grain walls,
the T1/T2 ratios were evaluated (Table 9) because the interactions between fluids and rock pores are reflected in the
T1/T2 ratio. Moreover, being independent of pore geometry,
these interactions are mainly influenced by the variations in
surface relaxivity (Katika et al. 2017). Thus, the T1/T2 ratio
is reliable for measuring the surface and bulk relaxations of
fluids inside pores when the relaxations due to diffusion are
negligible.
The most important result was observed in treatment with
0.1% ZnO NPs, which yielded a higher water wetting in
the larger pores (Tinker 1983). Oil fractions interact weakly
with the pore walls; hence, the oil-recovery efficiency is
Table 9 T1/T2 values of fluids in bulk and confined states
Case
T1(1)/T2(1)
T1(2)/T2(2)
T1(3)/T2(3)
Bulk crude oil
Bulk FW
S0
S1
S2
S3
S4
S5
S6
1.26
1.22
–
1.18
1.07
1.25
1.34
1.25
1.10
1.04
–
–
1.05
1.09
1.34
1.12
1.11
1.12
1.07
–
–
1.74
1.31
1.31
1.82
1.22
1.14
13
enhanced. For molecules such as simple liquids with fast
anisotropic motion, T1 and T2 are equal, and hence, the ratio
T1/T2 = 1 (Valori and Nicot 2018). For a molecule with slow
dynamics, T1 and T2 differ and keep diverging further as the
motion is hindered more. Second, the T1/T2 ratio for the oil
may deviate from unity because of intrinsic bulk oil properties such as viscosity. Interpreting this deviation as the
result of wettability might result in incorrect conclusions. A
more reliable interpretation would be obtained by assessing
the deviation from the unity of the water phase, which is
expected to always have T1/T2 = 1 for the ideal non-wetting
condition (Valori and Nicot 2018). As shown in Table 8, the
T1(3)/T2(3) values are similar in only FW-saturated and S4
(1.0 PV) samples. This shows that the treatment in S4 facilitates the pushing of the water molecules to the pore walls.
In S3 (0.5 PV), the distribution of the fluids in the pores
is mixed wetting. In other words, both FW and crude oil
molecules could be found within the same porous regions.
Wettability alteration
In this study, only T1 distributions were used to analyze the
wettability alteration potential by determining the porosity
and permeability based on Eq. 3. Table 10 shows the NMR
porosity, clay-bound water, and effective porosity (free fluid
index) determined by analyzing the T1 distributions obtained
via inverse Laplace transform (ILT) of the T1 relaxation data.
Figure 12 shows the representative T1 distributions of crude
oil in the bulk and confined states for Berea sandstone (S2).
The total NMR porosity was 12.5% based on T1, considering only the oil-flooded sample (S2). This value ensures
suitable liquid characteristics before any NP treatment. The
smaller pores resemble the clay-bound water porosity, which
is approximately 0.20% based on the T1 distribution analysis.
The first saturation of the rock cores was with water, then
with crude oil only, and finally with oil and nanofluid. The
first saturation shows how water molecules behave in the
smallest pores, while the second saturation (oil only) exhibits which pores the oil molecules wet. Based on these, we
assign the shortest T1, to water wet regions in the third wetting case. We use Eq. 3 to process the T1 distribution data,
and this helped obtain clay-bound water vs. free fluid index.
Equation 3 does not require the use of T1 cutoff value. In
addition, processing T1 distribution of S1 (only water wet
sample) yields 0.2% for the smallest pores.
The completely water-wet pore size is best described as
approximately 2.3% (0.29%/12.5%) of the total pore network. The effective porosity decreases when both FW and
crude oil are used for flooding. Therefore, the effective
porosity interphase should be a mixture of the oil + water
region (between the clay-bound water and the free-oil
region) and the free-oil zone. The effective porosity region
is divided into two types: (1) bulk porosity-irreducible and
Journal of Petroleum Exploration and Production Technology
Table 10 Parameters
determined by processing T
1
distribution data
Case
Total NMR porosity Clay bound H
2O
(p.u.)
(p.u.)
Free fluid index (p.u.)
Clay bound H2O/
free fluid index
(%)
S0
S1
S2
S3
S4
S5
S6
No signal
0.76
12.5
11.1
10.0
10.1
10.3
No signal
0.45
5.80
4.40
4.10
4.10
4.20
–
44.4
5.0
9.8
14.4
11.0
11.0
No signal
0.20
0.29
0.43
0.59
0.45
0.46
4.5
bulk crude oil
4.0
confined crude oil in rock
incremnetal porosity
( p.u )
3.5
3.0
2.5
2.0
1.5
1.0
0.5
0.0
0
150
300
450
600
750
900
time (ms)
Fig. 12 Representative T1 distributions of crude oil in bulk and confined states in Berea sandstone (S2)
(2) free fluid index. The first region is water dominant and
has a transitional mixed zone of oil and water, while the
second zone contains free crude oil. Water molecules wet
the pore walls and simultaneously form an interphase with
crude oil molecules. These observations pertain to two different wetting regimes: pore wall wetting and water–oil
interphase wetting. In NP treated samples, the percentage
of clay-bound H2O/free fluid index was maximum in S4 with
1.0 PV NP treatment. This treatment should allow maximal
crude oil recovery because the inner region of the sandstone
with FW + NPs has the highest fraction and the affinity of
crude oil molecules to interact with the pore walls of the
sandstone was the lowest. Figure 13 demonstrates both T1
and T2 distribution comparison of the samples from S2 to
S6. As expected, the time scale for T1 distribution is longer
than T2 distribution. There was a shift, in both T1 and T2
distributions, to shorter times when ZnO NPs were utilized.
The longer times in the distribution curves arise from larger
pores with crude oil. T1 and T2 distribution curves of both
S5 (1.5 PV) and S6 (2.0 PV) overlap each other, and longer
times in their distributions resemble S2, oil only sample.
In S3 (0.5 PV) and S4 (1.0 PV), the distribution curves differ from S2 (oil only), S5, and S6. Among the samples, S4
seem to be in between completely oil wet and completely
mixed wetting. Therefore, S4 treatment with 1.0 PV, as also
discussed above, will provide better wetting alteration and
hence higher crude oil recovery.
ZnO NPs demonstrate a hydrophobic/hydrophilic switching ability depending on the treatment (Myint et al. 2013)
as well as super-oleophilic properties (Jianlin et al. 2018).
These NPs can be useful for establishing the interphase
between water and crude oil molecules. Hence, crude oil
molecules are segregated and do not wet the pore walls.
The possible decrease in the surface energy of the water/
ZnO NPs upon confinement in sandstone pores and upon
interactions with the pore walls could lead to segregation
of the crude oils.
Conclusion
This study was conducted to exhibit the potential of hydrophilic ZnO nanoparticles in enhance oil recovery by improving fluids–rock interaction properties such as wettability alteration. The nanoparticles are active on wettability
alteration due to their ability to adsorption on or interact
with the surface of the rock and altering the wettability
from oil wet toward water wet. Interfacial tension measurements showed that ZnO NPs were able to reduce the FWoil IFT from 18 to 9.52 mN/m depending on the ZnO NP
concentration and FW salinity. The minimum IFT values
were obtained at an optimal salinity of 30,000 ppm of FW
with 0.1 wt% nanofluid. The effects of various concentrations of ZnO NP on wettability alterations, determined via
contact angle measurements, indicated that depending on
their concentration, the ZnO NPs were able to alter the wettability by changing the water–oil contact angle from 71°
to 13°. When FW or crude oil was confined in the rock,
deviations from their corresponding bulk dynamic behaviors
were seen. This is attributed to the well-known confinement
effect and is important because the NMR relaxation curves
presented herein were acquired under confinement, where
molecules have restricted motion. The percentage of claybound H2O/free fluid index was the highest in S4 with 1.0
13
(a)
0.5
S2_oil only
0.45
Incremental porosity
( p.u)
Fig. 13 T2 (a) and T1 (b) distributions of crude oils in confined
states in Berea sandstone with
and without utilization of ZnO
NPs
Journal of Petroleum Exploration and Production Technology
S3 _0.5 pv nanofluid
0.4
S4_1 pv nanofluid
0.35
S5_1.5 pv nanofluid
S6_2 pv nanofluid
0.3
T2 distribution
0.25
0.2
0.15
0.1
0.05
0
0
40
80
120
160
200
240
280
320
360
400
440
480
Relaxation time (ms)
(b)
0.5
S2_oil only
S3_0.5 pv nanofluid
S4_1 pv nanofluid
S5_1.5 pv nanofluid
S6_2 pv nanofluid
0.45
Incremental porosity
( p.u)
0.4
0.35
T1 distribution
0.3
0.25
0.2
0.15
0.1
0.05
0
0
40
80
120
160
200
240
280
320
360
400
440
480
520
Relaxation time (ms)
PV NP treatment (for treated samples). The S4 treatment
thus has a higher potential for wettability alteration under
the confined state in porous rocks. A comparison of the
T1/T2 ratio, an important parameter quantifying the affinity between the minerals and wetting fluid, also proved that
the S4 treatment enables enhanced oil recovery because the
T1(3)/T2(3) values are similar in only FW-saturated and S4
(1.0 PV) NP-treated samples. Based on these results, it is
possible to alter wettability using ZnO NPs under a confined
geometry in rock samples for EOR studies. Furthermore, the
LF-NMR method would be optimal for assessing the conditions for NP treatment in EOR. The potential of LF-NMR
relaxometry was also demonstrated in water–oil interaction
investigations with NP treatment at the subsurface of the
rock matrix under a confined geometry. LF-NMR is therefore a promising technique for rock core analysis, petroleum
chemistry, and behavioral studies of inorganic NPs in rock
cores. Finally, the theories of porous-media relaxation support the applications of LF-NMR technologies.
13
Funding The authors are grateful for the help and support received
from the Kuwait Foundation for the Advancement of Sciences (KFAS)
(Research Grant PN1735EP01) and Kuwait University General Facility
Research (GE 01/17–GS 01/01–GS 03/08–GS 01/05) for conducting
the necessary experimental work. We are also grateful for the financial support by the Kuwait Institute for Scientific Research (KISR) in
performing the LF-NMR measurements with Project Number PP066K.
Declaration
Conflict of interest The authors have no relevant financial or non-financial interests to disclose.
Open Access This article is licensed under a Creative Commons Attribution 4.0 International License, which permits use, sharing, adaptation, distribution and reproduction in any medium or format, as long
as you give appropriate credit to the original author(s) and the source,
provide a link to the Creative Commons licence, and indicate if changes
were made. The images or other third party material in this article are
included in the article’s Creative Commons licence, unless indicated
Journal of Petroleum Exploration and Production Technology
otherwise in a credit line to the material. If material is not included in
the article’s Creative Commons licence and your intended use is not
permitted by statutory regulation or exceeds the permitted use, you will
need to obtain permission directly from the copyright holder. To view a
copy of this licence, visit />
References
Abdallah W, Buckley JS, Carnegie A, Edwards J, Herod B, Fordham E,
Graue A, Habashy T, Seleznev N, Signer C, Hussain H, Montaron
B, Ziauddin M (2007) Fundamentals of wettability. Oil Field Rev
50:44–61
Abragam A (1961) Principles of nuclear magnetism. Clarendon Press,
Oxford
Aghda SMF, Taslimi M, Fahimifar A (2018) Adjusting porosity
and permeability estimation by nuclear magnetic resonance:
a case study from a carbonate reservoir of south of Iran. J Petrol Explor Prod Technol 8:1113–1127. https://doi.org/10.1007/
s13202-018-0474-z
Al Harbi AM, Gao J, Kwak HT, Abdel-Fattah AI (2017) The study of
nanosurfactant EOR in carbonates by advanced NMR technique.
SPE-188710-MS
Al-Anssari S, Barifcani A, Wang S, Maxim L, Iglauer S (2016) Wettability alteration of oil-wet carbonate by silica nanofluid. J Colloid
Interface Sci 461:435–442
Ali JA, Kolo K, Manshad AK, Mohammadi AH (2018) Recent
advances in application of nanotechnology in chemical enhanced
oil recovery: effects of nanoparticles on wettability alteration, interfacial tension reduction, and flooding. Egypt J Pet
27:1371–1383
Almao PP (2012) In situ upgrading of bitumen and heavy oils via
nanocatalysis. Can J Chem Eng 90:320–329
Alsaba MT, Al Dushaishi MF, Abbas AK (2020) A comprehensive
review of nanoparticles applications in the oil and gas industry. J
Pet Explor Prod Technol 10:1389–1399. https://doi.org/10.1007/
s13202-019-00825-z
Alvarado RJ, Damgaard A, Hansen P, Raven M, Heidler R, Hoshun R,
Kovats J, Morriss C, Rose D, Wendt W (2003) Nuclear magnetic
resonance logging while drilling. Oil Field Rev 15(2):40–51
Anderson WG (1986) Wettability literature survey—part 2: wettability
measurement. J Pet Technol 38:1246–1262
Aursand IG, Gallart-Jornet L, Erikson U, Axelson DE, Rustad T (2008)
Water distribution in brine salted cod (Gadus morhua) and salmon
(Salmo salar): a low-field 1H NMR study. J Agric Food Chem
56:6252–6260
Ayatollahi S, Zerafat M (2012) Nanotechnology-assisted EOR techniques: new solutions to old challenges. Soc Pet Eng 157106094.
Azizr R, Joekar-Niasar V, Martinez-Ferrer P (2018) Pore-scale insights
into transport and mixing in steady-state two-phase flow in porous
media. Int J Multiphase Flow 109:51–62
Badalyan A, Pendleton P (2003) Analysis of uncertainties in manometric gas-adsorption measurements I: propagation of uncertainties
in BET analyses. Langmuir 19:7919–7928
Barbosa LL, Kock FVC, Silva RC, Freitas JCC, Lacerda V Jr, Castro
EVR (2013) Application of low-field NMR for the determination of physical properties of petroleum fractions. Energy Fuels
27:673–679
Barbosa LL, Kock FVC, Almeida VMDL, Menezes SMC, Castro EVR
(2015) Low-field nuclear magnetic resonance for petroleum distillate characterization. Fuel Proc Technol 138:202–209
Barrett EP, Joyner LG, Halenda PP (1951) The determination of pore
volume and area distributions in porous substances I computations
from nitrogen isotherms. J Am Chem Soc 73(1):373–380. https://
doi.org/10.1021/ja01145a126
Barroso AL, Marcelino CP, Leal AB, Odum DM, Lucena C, Masculo
M, Castro F (2018) New generation nano technology drilling
fluids application associated to geomechanic best practices: field
trial record in Bahia, Brazil. In: Offshore technology conference,
30 April–3 May, Houston, Texas, USA. https://doi.org/10.4043/
28731-MS
Bera A, Belhaj H (2016) Application of nanotechnology by means of
nanoparticles and Nano dispersions in oil recovery—a comprehensive review. J Nat Gas Sci Eng 34:1284–1309
Borysenko A, Clenell B, Sedev R, Burgar I, Ralston J, Raven M,
Dewhurst D, Lui K (2009) Application of low field and solid-state
NMR spectroscopy to study the liquid/liquid interface in porous
space of clay mineral and shales. Diffus Fund 10:21–24
Brunauer S, Emmett PH, Teller E (1938) Adsorption of gases in multi
molecular layers. J Am Chem Soc 60:309–319
Brundle CR, Evans CA, Wilson S (1992) Encyclopedia of materials
characterization: surfaces, interfaces, thin films. Gulf Professional
Publishing, Houston
Cheraghian G, Hendraningrat L (2016) A review on applications of
nanotechnology in the enhanced oil recovery part B: effects of
nanoparticles on flooding. Int Nano Lett 6:1–10. https://doi.org/
10.1007/s40089-015-0170-7
Cheraghian G, Rostami S, Afrand M (2020) Nanotechnology in
enhanced oil recovery. Processes 8:1073. https://doi.org/10.3390/
pr8091073
Chung SJ, Leonard JP, Nettleship I, Lee JK, Soong Y, Martello DV,
Chyu MK (2009) Characterization of ZnO nanoparticle suspension in water: effectiveness of ultrasonic dispersion. Powder Technol 194:75–86
Connolly PRJ, Yan W, Zhang D, Mahmoud M, Verrall M, Lebedev M,
Iglauer S, Metaxas PJ, May EF, Johns ML (2019) Simulation and
experimental measurements of internal magnetic field. J Pet Sci
Eng 175:985–997
D’Agostino C, Mitchell J, Gladden LF, Mantle MD (2012) Hydrogen bonding network disruption in mesoporous catalyst supports
probed by PFG-NMR diffusometry and NMR relaxometry. J Phys
Chem C 116:8975–8982
Dang CTQ, Nghiem LX, Chen ZJ, Nguyen QP (2013) Modeling low
salinity waterflooding: ion exchange, geochemistry and wettability alteration. Soc Pet Eng. https://doi.org/10.2118/166447-MS
Dukhin AS, Goetz PJ (2010) Characterization of liquids, nano- and
micro particulates and porous bodies using ultrasound, 2nd edn.
Elsevier, p 24
Franco CA, Zabala R, Cortés FB (2017) Nanotechnology applied to the
enhancement of oil and gas productivity and recovery of Colombian felds. J Pet Sci Eng 157:39–55. https://doi.org/10.1016/j.
petrol.2017.07.004
Freedman R, Heaton N, Flaum M, Hirasaki GJ, Flaum C, Hurlimann M
(2003) Wettability, saturation, and viscosity from NMR measurements. SPE J 87340:317–327
Gautam SS, Ok S, Cole DR (2017) Structure and dynamics of confined
C–O–H fluids relevant to the subsurface: application of magnetic
resonance, neutron scattering, and molecular dynamics simulations. Front Earth Sci 5:43-1-43–19
Giraldo J, Benjumea P, Lopera S, Cortes FB, Ruiz MA (2013) Wettability alteration of sandstone cores by alumina-based nanofluids.
Energy Fuels 27:3659–3665
Gomez-Serrano V, Gonzalez-Garcia C, Gonzalez-Martin M (2001)
Nitrogen adsorption isotherms on carbonaceous materials comparison of BET and Langmuir surface areas. Powder Technol
116:103–108
13
Gong L, Nie L, Xu Y (2020) Geometrical and topological analysis of
pore space in sandstones based on X-ray computed tomography.
Energies 13:3774. https://doi.org/10.3390/en13153774
Graves JE, Latvytė E, Greenwood A, Emekwuru NG (2019) Ultrasonic
preparation, stability and hermal conductivity of a capped coppermethanol nanofuid. Ultrason Sonochem 55:25–31. https://doi.
org/10.1016/j.ultsonch.2019.02.028
Gurgel A, Moura M, Dantas T, Neto EB, Neto AD (2008) A review
on chemical flooding methods applied in enhanced oil recovery.
Brazil J Pet Gas 2:83–95
Hashemi R, Nassar NN, Almao PP (2014) Nanoparticle technology for
heavy oil in-situ upgrading and recovery enhancement: opportunities and challenges. Appl Energy 133:374–387
Hendraningrat L, Engeset B, Suwarno S, Torsater O (2012) Improved
oil recovery by nanofluids flooding: an experimental study. In:
SPE Kuwait international petroleum conference and exhibition.
Soc Pet Eng. SPE-163335-1–SPE-163335-19
Hendraningrat L, Torsæter O, Li S (2013) Improved oil recovery by
hydrophilic silica nanoparticles suspension: 2-phase flow experimental studies. In: International petroleum technology conference,
Beijing, China, IPTC16707
Hoelscher KP, De Stefano G, Riley M, Young S (2012) Application
of nanotechnology in drilling fluids In: SPE international oilfield
nanotechnology conference exhibit, Noordwijk, The Netherlands,
12–14 June
Hou X, Zhu Y, Chen S, Wang Y, Liu Y (2020) Investigation on pore
structure and multifractal of tight sandstone reservoirs in coal
bearing strata using LF-NMR measurements. J Pet Sci Eng
187:106757
Hyne JB (1986) Aquathermolysis: a synopsis of work on the chemical reaction between water (steam) and heavy oil sands during
simulated steam stimulation. Alberta Oil Sands Technology &
Research Authority, Edmonton
Jiang J, Oberdörster G, Biswas P (2009) Characterization of size, surface charge, and agglomeration state of nanoparticle dispersions
for toxicological studies. J Nano Res 11:77–89. https://d oi.o rg/1 0.
1007/s11051-008-9446-4
Jiang Y, Xu G, Hi H, Shi Y, Gao Y, Han X, Zeng X (2021) A new
method to determine surface relaxivity of tight sandstone cores
based on LF-NMR and high-speed centrifugation measurements.
J Pet Sci Eng 196:108096-1-108096–9
Jianlin L, Xiaofei Z, Hongwei Z, Fuping W, Bigui W, Qing C (2018)
Superhydrophobic coating on quartz sand filter media for oily
wastewater filtration. Coll Surf A Physicochem Eng Aspects
553:509–514
Ju B, Fan T, Ma M (2006) Enhanced oil recovery by flooding with
hydrophilic nanoparticles. China Particuol 4:41–46
Kanj MY, Rashid MH, Giannelis E (2011) Industry first field trial of
reservoir nanoagents. In: SPE middle east oil and gas show and
conference, 25–28 September, Manama, Bahrain. https://doi.org/
10.2118/142592-MS
Katika K, Saidian M, Prasad M, Fabricius IL (2017) Low-field NMR
spectrometry of chalk and argillaceous sandstones: rock-fluid
affinity assessed from T1/T2 ratio. Petrophysics 58:126–140
Kazemzadeh Y, Shojaei S, Riazi M, Sharifi M (2019) Review on application of nanoparticles for EOR purposes: a critical review of
the opportunities and challenges. Chin J Chem Eng 27:237–246
Kenyon WE, Kolleeny JA (1995) NMR surface relaxivity of calcite
with adsorbed Mn2+. J Colloid Interface Sci 170:502–514
Khalil M, Jan BM, Tong CW, Berawi MA (2017) Advanced nanomaterials in oil and gas industry: design, application, and challenges.
Appl Energy 191:287–310
Khalilnezhad A, Rezvani H, Ganji P, Kazemzadeh Y (2019) A complete experimental study of oil/water interfacial properties in the
presence of TiO2 nanoparticles and different ions. Oil Gas Sci
Technol Rev IFP Energies Nouvelles 74:39-1-39–14
13
Journal of Petroleum Exploration and Production Technology
Kokal S, Tang T, Schramm L, Sayegh S (1995) Electrokinetic and
adsorption properties of asphaltenes. Colloids Surf A 94:253–265
Kondiparty K, Nikolov A, Wu S, Wasan D (2011) Wetting and spreading of nanofluids on solid surfaces driven by the structural disjoining pressure: statics analysis and experiments. Langmuir
27:3324–3335
Kosynkin D, Alaskar M (2016) Oil industry first inter-well trial of
reservoir nanoagent tracers. In: SPE annual technical conference
and exhibition, 26–28 September, Dubai, UAE. https://doi.org/
10.2118/181551-MS
Lastoskie C, Gubbins KE, Quirke N (1993) Pore size distribution analysis of microporous carbons: a density functional theory approach.
J Phys Chem 97(18):4786–4796
Lawson CL, Hanson RJ (1974) Solving least squares problems. Prentice-Hall Inc, Englewood Cliffs, p 158
Lianga C, Xiaoa L, Zhou C, Wang HC, Hu F, Lio G (2019) Wettability characterization of low-permeability reservoirs using
nuclear magnetic resonance: an experimental study. J Pet Sci
Eng 178:121–132
Maa C, Jin W, Ma X, Han H, Yu J, Wu Y (2019) Water adsorption
behaviors of high index polar surfaces in ZnO. Appl Surf Sci
498(31):143898. https://doi.org/10.1016/j.apsusc.2019
Mirotchnik K, Kubika P, Randall L, Starosud A, Allsopp K, Kantzas A (1998) Determination of mud invasion characteristics
of sandstone reservoirs using a combination of advanced core
analysis techniques. In: International Symposium of the society
of core analysts, Hague
Mirotchnik K, Kantzas A (1999) Methods and technology for the
characterization of the pore structure and fluid flow properties
of soils in reference to contaminant transport. J Can Pet Tech
38:41–47
Munson BR, Young DF, Okiishi TH (1998) Fundamentals of fluid
mechanics, 3rd edn. Wiley, Hoboken
Murgich J (2002) Intermolecular forces in aggregates of asphaltenes
and resins. Pet Sci Technol 20(9–10):983–997
Myint MTZ, Kumar NS, Hornyak GL, Dutta J (2013) Hydrophobic/
hydrophilic switching on zinc oxide micro-textured surface. Appl
Surf Sci 264:344–348
Nowrouzi I, Manshad AK, Mohammadi AH (2019) Effects of concentration and size of T
iO2 nanoparticles on the performance of smart
water in wettability alteration and oil production under spontaneous imbibition. J Pet Sci Eng 183:106357-1-106357–14
Odusina EO, Sondergeld CH, Rai CS (2011) NMR study of shale wettability. Soc Pet Eng. https://doi.org/10.2118/147371-MS
Ok S, Mal T (2019) NMR spectroscopy analysis of asphaltenes. Energy
Fuels 33:10391–10414. https://doi.org/10.1021/acs.energyfuels.
9b02240
Olayiwola SO, Dejam M (2019) A comprehensive review on interaction of nanoparticles with low salinity water and surfactant for
enhanced oil recovery in sandstone and carbonate reservoirs. Fuel
241:1045–1057
Onyekonwu MO, Ogolo NA (2010) Investigation the use of nanoparticles in enhancing oil recovery. Paper SPE 140744-Ms presented at
Nigeria annual conference and exhibition, Tinapa-Calabar
Provencher SW (1982) A constrained regularization method for inverting data represented by linear algebraic or integral equations.
Comput Phys Commun 27:213–227
Rahmani AR, Bryant S, Huh C, Athey A, Ahmadian M, Chen J, Wilt M
(2015) Cross well magnetic sensing of superparamagnetic nanoparticles for subsurface applications. SPE J 20:1067–1082
Rezk MY, Allam NK (2019) Unveiling the synergistic effect of ZnO
nanoparticles and surfactant colloids for enhanced oil recovery.
Colloid Interface Sci Commun 29:33–39
Ridwan MG, Kamil MI, Sanmurjana M, Dehgati AM, Permadi P,
Marhaendrajan T, Hakiki F (2020) Low salinity waterflooding:
Journal of Petroleum Exploration and Production Technology
Surface roughening and pore size alteration implications. J Pet
Sci Eng 195:107868. https://d oi.o rg/1 0.1 016/j.p etrol.2 020.1 07868
Saien J, Gorji AM (2017) Simultaneous adsorption of CTAB surfactant
and magnetite nanoparticles on the interfacial tension of n-hexane–water. J Molecule Liq 242:1027–1034
Siegbahn K, Nordling C, Fahlman A et al (1967) ESCA: atomic,
molecular and solid state structure studied by means of electron
spectroscopy. Almqvist & Wiksell International, Uppsala
Soleimani H, Yahya N, Baig MK, Khodapanah L, Sabet M, Bhat AH,
Ochsner A, Awang M (2016) Catalytic effect of zinc oxide nanoparticles on oil-water interfacial tension. Dig J Nanometer Biostruct 11:263–269
Straley C, Rossini D, Vinegar H, Tutunjian P, Morriss C (1994) Core
analysis by low field NMR. Soc Core Anal 4:43–56
Straley C, Morriss CE, Kenyon WE, Howard JJ (1991) NMR in partially saturated rocks: laboratory insights on free fluid index and
comparison with borehole logs. Society petrophysicists well-log
annual transactions SPWLA annual logging symposium, pp 1–25
Suleimanov BA, Ismailov FS, Veliyev EF (2011) Nanofluid for
enhanced oil recovery. J Pet Sci Eng 78:431–437
Sulucarnain ID, Sondergeld CH, Rai CS (2012) An NMR study of
shale wettability and effective surface relaxivity. In: SPE Canadian unconventional resources conference. society of petroleum
engineers. https://doi.org/10.2118/162236-MS
Suryanarayana C, Mukhopadhyay D, Patankar S, Froes F (1992)
Grain size effects in monocrystalline materials. J Mater Res
7:2114–2118
Teklu TW, Alameri W, Kazemi H, Graves RM (2015) Contact angle
measurements on conventional and unconventional reservoir cores
In: Proceedings of unconventional resources technology conference, San Antonio, USA
Tinker GE (1983) Design and operating factors that affect water flood
performance in Michigan. J Pet Technol 35:1884–1892
Trevizan W, Coutinho B, Netto P, Rios E, Ramos P, Salazar J, Bressan
M (2015) Magnetic resonance (NMR) approach for permeability
estimation in carbonate rocks. In: Offshore technology conference, pp 1–12
Tso Ch, Zhung Ch, Shih Y, Tseng YM, Wu S, Doong R (2010) Stability of metal oxide nanoparticles in aqueous solutions. Water Sci
Technol 61:127–133
Udoh TH (2021) Improved insight on the application of nanoparticles
in enhanced oil recovery process. Sci Afr 13:e00873
Valori A, Nicot B (2018) A review of 60 years of NMR wettability.
Soc Core Anal 17:1–13
Van SL, Chon BH (2016) Chemical flooding in heavy-oil reservoirs:
from technical investigation to optimization using response surface methodology. Energies 9:711-1-711–19
Vogel M (2010) NMR studies on simple liquids in confinement. Eur
Phys J Spec Top 189:47–64
Volkov VY, Al-Muntaser AA, Varfolomeev MA, Khasanova NM,
Sakharov BV, Suwaid MA, Djimasbe R, Galeev RI, Nurgaliev DK
(2021) Low-field NMR-relaxometry as fast and simple technique
for in-situ determination of SARA-composition of crude oils. J
Pet Sci Eng 196:107990
Wilson WW, Wade MM, Holman SC, Champlin FR (2001) Status
of methods for assessing bacterial cell surface charge properties based on zeta potential measurements. J Microbiol Methods
43(3):153–164
Yahya N, Kashif M, Shafie A, Soleimani H, Zaid HM, Latiff NRA
(2014) Improved oil recovery by high magnetic flux density subjected to iron oxide nanofluid. J Nano Res 26:89–99
Yoosuk B, Kim JH, Song C, Ngamcharussrivichai C, Prasassarakich P
(2008) Highly active MoS2, CoMoS2 and NiMoS2 unsupported
catalysts prepared by hydrothermal synthesis for hydrodesulfurization of 4,6-dimethyldibenzothiophene. Catal Today 130:14–23
Zabala R, Franco CA, Cortés FB (2016) Application of nanofluids for
improving oil mobility in heavy oil and extra-heavy oil: a field
test. In: SPE improved oil recovery conference, 11–13 April,
Tulsa. https://doi.org/10.2118/179677-MS
Zaid HM, Yahya N, Latiff NRA (2013) The effect of nanoparticles
crystallite size on the recovery efficiency in dielectric nanofluid
flooding. J Nano Res 21:103–108
Zhang H, Nikolov A, Wasan D (2014) Enhanced oil recovery (EOR)
using nanoparticle dispersions: underlying mechanism and imbibition experiments. Energy Fuels 28:3002–3009
Publisher's Note Springer Nature remains neutral with regard to
jurisdictional claims in published maps and institutional affiliations.
13
View publication stats