Báo cáo khoa học: Refined solution structure and backbone dynamics of the archaeal MC1 protein ppt
Bạn đang xem bản rút gọn của tài liệu. Xem và tải ngay bản đầy đủ của tài liệu tại đây (2.51 MB, 13 trang )
Refined solution structure and backbone dynamics of the
archaeal MC1 protein
Franc¸oise Paquet, Karine Loth, Herve
´
Meudal, Franc¸oise Culard, Daniel Genest and
Ge
´
rard Lancelot
Centre de Biophysique Mole
´
culaire, CNRS UPR 4301, Orle
´
ans, France
Introduction
DNA-binding proteins play a central role in all aspects
of genetic activity within an organism, such as tran-
scription, packaging, rearrangement, replication, and
repair. Archaeons have a variety of abundant,
sequence-independent nucleoid proteins, some of which
are able to compact DNA. Among the numerous chro-
matin proteins identified in archaeons, only two –
histones and Alba homologs – are present in almost all
archaeal phyla [1].
Archaeal histones (e.g. HMfa and HMfb) are char-
acterized by an a-helical histone fold. Their monomers
are not stable, and must form homodimers. In the
presence of DNA, dimers assemble into tetramers and,
sometimes, hexamers [2]. These archaeal histone tetra-
mers wrap $ 90 bp in less than one circle, resulting in
a horseshoe-shape assembly. Histones are replaced by
other chromatin proteins in archaeons that lack them,
namely the hyperthermophilic Crenarchaea and euryar-
chaeal Thermoplasma. Sulfolobus species (Crenarchaea)
have small monomeric proteins with an SH3-like fold,
such as Sac7d and Cren7 [3,4], whereas members of
the Thermoplasma genus have the dimeric protein
Keywords
arm; bulges; DNA-binding protein; molecular
dynamics (MD) simulation; NMR relaxation
Correspondence
F. Paquet, Centre de Biophysique
Mole
´
culaire, CNRS UPR 4301, Rue
Charles-Sadron, F-45071 Orle
´
ans Cedex 2,
France
Fax: +33 2 38631517
Tel: +33 2 38257692
E-mail:
Database
Structural data are available in the Protein
Data Bank database under the accession
number 2KHL
(Received 26 July 2010, revised 15
September 2010, accepted 20 October
2010)
doi:10.1111/j.1742-4658.2010.07927.x
The 3D structure of methanogen chromosomal protein 1 (MC1), deter-
mined with heteronuclear NMR methods, agrees with its function in terms
of the shape and nature of the binding surface, whereas the 3D structure
determined with homonuclear NMR does not. The structure features five
loops, which show a large distribution in the ensemble of 3D structures.
Evidence for the fact that this distribution signifies internal mobility on the
nanosecond time scale was provided by using
15
N-relaxation and molecular
dynamics simulations. Structural variations of the arm (11 residues)
induced large shape anisotropy variations on the nanosecond time scale
that ruled out the use of the model-free formalism to analyze the relaxation
data. The backbone dynamics analysis of MC1 was achieved by compari-
son with 20 ns molecular dynamics trajectories. Two b-bulges showed that
hydrogen bond formation correlated with u and w dihedral angle transi-
tions. These jumps were observed on the nanosecond time scale, in agree-
ment with a large decrease in
15
N-NOE for Gly17 and Ile89. One water
molecule bridging NH(Glu87) and CO(Val57) through hydrogen bonding
contributed to these dynamics. Nanosecond slow motions observed in
loops LP3 (35–42) and LP5 (67–77) reflected the lack of stable hydrogen
bonds, whereas the other loops, LP1 (10–14), LP2 (22–24), and
LP4 (50–53), were stabilized by several hydrogen bonds. Dynamics are
often directly related to function. Our data strongly suggest that residues
belonging to the flexible regions of MC1 could be involved in the interac-
tion with DNA.
Abbreviations
CSP, chemical shift perturbation; MC1, methanogen chromosomal protein 1; MD, molecular dynamics; RDC, residual dipolar coupling.
FEBS Journal 277 (2010) 5133–5145 ª 2010 The Authors Journal compilation ª 2010 FEBS 5133
HTa, a member of the HU family [5,6]. Sac7d and
Cren7 have a small b-barrel with or without an amphi-
philic C-terminal a-helix, and HUs have a largely
a-helical body capped by b-sheets that extend into two
b-ribbon arms.
Alba homologs, which were first identified in differ-
ent species of Sulfolobus (e.g. Sac10b and Sso10b),
bind to both DNA and RNA. The Alba dimer has
two extended b-hairpins flanking a central body, sug-
gesting three main points of contact with the DNA [7].
They are present in all archaeons except Halobacteria
and Methanomicrobia (Euryarchaea). For instance,
Methanosarcina sequenced genomes contain one gene
coding for a true archaeal histone, HMm, as well as
genes coding for structural proteins of the methanogen
chromosomal protein 1 (MC1) family [8].
In laboratory growth conditions, MC1 is the most
abundant structural protein present in Methanosarcina
thermophila CHTI55 [9]. A large number of charged
residues (24 basic and 12 acidic amino acids) are dis-
tributed all along the protein sequence. This small pro-
tein of 93 residues is able to bind and to bend any
dsDNA as a monomer. Related to its capacity to
introduce strong DNA conformational changes, MC1
is able to discriminate between different deformations
of the DNA double helix. Thus, MC1 recognizes and
strongly binds to four-way junctions [10] and to mini-
circles [11,12]. In addition, MC1 is easily able to recog-
nize flexible DNA sequences [13]. Visualization of the
linear DNA molecules by electron microscopy reveals
that the binding of MC1 induces sharp kinks with an
angle value of 116° [14]. We have previously solved the
three-dimensional structure of this architectural protein
extracted from the M. thermophila strain CHTI55 by
using
1
H-NMR spectroscopy only [15]. The overall
fold of MC1, characterized by its b–b–a–b–b–b link-
ing, is different from those of other known DNA-bind-
ing proteins. Site-directed mutagenesis showed that
two residues belonging to the loop b4–b5 (Trp74 and
Met75) are involved in DNA binding [16]. Further-
more, hydroxyl radical footprinting, together with a
dystamycin competition experiment, suggested that the
monomeric MC1 binds to DNA through the minor
groove, and that the binding site, covering at least
15 bp, is composed of two areas of contact separated
by nearly 10 bp [13]. The static structure, previously
described, could not explain this particular behavior
[15]. We therefore decided to continue the structural
study of MC1 with a recombinant
13
C,
15
N-labeled pro-
tein expressed in Escherichia coli. In this article, we
report heteronuclear NMR experiments that have
enabled us to assign all side chains and to introduce
dihedral angle restraints (u and w angles). Residual
dipolar couplings (RDCs) were also measured in a par-
tially aligned sample with radially compressed poly-
acrylamide gel to add constraints, particularly in the
arm. In addition to the structural study, a qualitative
analysis of the NMR relaxation and molecular dynam-
ics (MD) simulation data was carried out.
Results and Discussion
Refined NMR structures of MC1
Chemical shift assignments for MC1 were obtained for
97% of N, H
N
,H
a
,C
a
,C
b
and C¢ nuclei (Table S1).
The refined structures of MC1 were determined by
using NOE distances, dihedral angles, hydrogen bonds,
and
1
D
NH
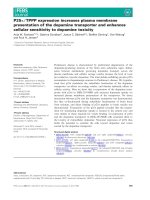
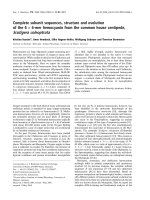
RDC restraints (Table 1). The global fold
consists of a pseudobarrel with an extension of the
b-sheet (b4–b5) forming an arm (Fig. 1A,B). The sec-
ondary structure elements, namely an a-helix, a1 (25–
32), and five b-strands, b1 (4–9), b2 (15–21), b3 (43–
48), b4 (55–65), and b5 (79–90), are all antiparallel and
packed with each other as previously described [15].
An antiparallel b-bulge (B1), composed of Leu8,
His16, and Gly17, is present in seven structures, and
another antiparallel b-bulge (B2), composed of Val57,
Glu87, and Arg88, is observed for all the structures.
The secondary structure elements are connected
by loops LP1 (10–14), LP2 (22–24), LP3 (35–42),
LP4 (50–53), and LP5 (67–77), referred to as ‘arm’ in
the text. The latter now appears to be remote from the
protein core, whereas it was previously described as
pulled down on the a-helix. Superimposition of the 15
best structures of MC1 clearly shows that the regions
with the largest degree of structural variations include
the N-terminus, C-terminus, and loops LP1, LP3, LP4,
and, especially, LP5 (Fig. 1A). Its rmsd value is large
(11 A
˚
), in agreement with the extensive conformational
space swept by its residues (Table 1), whereas the rmsd
values of the other loops fall between 2 and 2.7 A
˚
.
MC1 can no longer be considered as a spherical pro-
tein, but rather as an anisotropic structure defined by
the ratio of the principal components of the inertia
tensor. This ratio differs within the 15 models of MC1,
1.00 : (0.85–0.94) : (0.34–0.43), according to the posi-
tion of the arm.
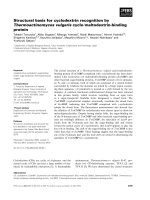
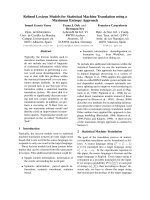
Although this new fold is completely different from
those of other known proteins, it has similarities to the
small architectural proteins Sac7d and Cren7 belonging
to the Sulfolobus strains of the Crenarchaeota subdo-
main (Fig. 2) [3,4]. All possess a triple-stranded b-sheet
(b3–b4–b5). Sac7d and Cren7 cause a single-step sharp
kink in DNA ($ 60° and $ 53°, respectively) through
the intercalation of hydrophobic side chains. Despite
NMR structure and backbone dynamics of MC1 F. Paquet et al.
5134 FEBS Journal 277 (2010) 5133–5145 ª 2010 The Authors Journal compilation ª 2010 FEBS
their similarity in overall structure, these two SH3-like
proteins differ in the DNA-binding surface. Cren7
shows a substantially larger binding site ($ 8 bp) than
Sac7d (4 bp), as it possesses a long loop of seven resi-
dues between b3 and b4 in the DNA binding surface
[17]. Loop b3–b4 of Cren7 undergoes a significant con-
formational change upon binding of the protein to
DNA, suggesting its critical role in the stabilization of
the proteinÆDNA complex. The arm of MC1 can also
be compared with the DNA-binding b-hairpin arms of
HUs, which showed high mobility relative to the core
(Fig. 2). The b-ribbon arms wrap around the minor
groove of the DNA and, at the tip of each arm, the
conserved Pro intercalates between base pairs, creating
and ⁄ or stabilizing two kinks in the DNA (global cur-
vature between 105° and 140°) [18]. This variability is
reflected by extensive DNA contacts between 9 bp of
DNA and the b-ribbon arms, and variable contacts
between additional DNA and the body of the protein
[19]. In the case of MC1ÆDNA complexes, we know
that the protein covers at least 15 bp and that the
binding site is composed of two areas of contact sepa-
rated by nearly 10 bp [13]. The arm (loop LP5) seems
to be essential to cover such a long sequence. In fact,
the arm of MC1 has many hydrophobic residues
(Pro68, Pro72, Trp74, Met75, and Pro76), which are
conserved in different species of Methanosarcina and
Halobacteria. Site-directed mutagenesis showed that
two residues belonging to the loop (Trp74 and Met75)
are involved in DNA binding [16]. It is clear that the
arm of MC1 is essential for DNA binding and bend-
ing. The interaction mode of MC1 is probably com-
pletely different from those of Sac7d and Cren7, which
bind and bend DNA by placing their triple-stranded
b-sheet (b3–b4–b5) across the DNA minor groove.
Indeed, the electrostatic potential surface of MC1
reveals that one side of the protein has a considerable
number of positively charged residues: Arg4, Lys22,
Arg25, Lys53, Lys54, His56, Lys69, Arg71, Lys81,
Lys85, Lys86, and Lys91 (Fig. 1C). This side, the
reverse of the one used by Sac7d and Cren7 of Sulfolo-
bus, is a good candidate to interact with the phosphate
group of nucleotides.
15
N-NMR Relaxation for MC1
The
15
N-HSQC spectrum of MC1 recorded at
600 MHz showed good dispersion of the crosspeaks
(Fig. S1). Relaxation data were obtained for 84 back-
bone N–H pairs (93 residues minus Pro24, Pro42,
Pro68, Pro72, Pro76, Pro82, Gly51, and the two N-ter-
minal residues Ser1 and Asn2) at 600 MHz (R
1
, R
2
,
15
N-NOE) and 800 MHz (R
1
, R
2
), and, owing to spec-
tral overlap, for 79 residues at 500 MHz (
15
N-NOE).
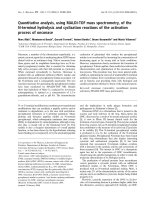
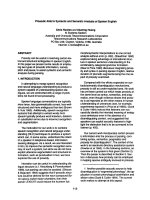
The experimental relaxation data at 600 and 800 MHz
are shown in Figs 3 and S2 respectively. The patterns
seen for the individual relaxation rate constants at the
different field strengths are similar. The average value
of R
1
is 1.6 s
)1
at 600 MHz and 1.1 s
)1
at 800 MHz.
R
2
values showed large deviations up to 60% from the
mean value (11.5 s
)1
at 600 MHz and 13.8 s
)1
at
800 MHz). Such variations in R
2
values can result
from relatively large-amplitude motions, efficient
exchange processes, or shape anisotropy effects. In our
experimental conditions, no significant increase in R
2
values was observed for MC1 between 600 and
800 MHz, indicating the absence of efficient exchange
processes. We observed that R
2
values decreased sub-
stantially for Gly17, Asp66, Lys69, Asn70, Arg71, and
Ile89, whereas R
1
values increased, reflecting local
Table 1. NMR constraints and structural statistics.
NMR constraints
Distance restraints
Total NOE 1873
Unambiguous 1089
Ambiguous 784
Hydrogen bonds 37
Total dihedral angles
F 69
W 69
RDC constraints 57
Structural statistics for the ensemble of the 15 lowest-energy
structures
Average violations per structure
NOEs ‡ 0.5 A
˚
0
Hydrogen bonds ‡ 0.5 A
˚
0
Dihedrals ‡ 10° 0
RDC constraints rmsd (Hz) 0.75
Average pairwise rmsd (A
˚
) Backbone atoms Heavy atoms
a1, b1–5 (50 residues) 1.22 ± 0.26 1.85 ± 0.26
LP1 (10–14) 0.44 ± 0.17 1.15 ± 0.43
LP2 (22–24) 0.13 ± 0.05 1.14 ± 0.29
LP3 (35–42) 1.04 ± 0.32 1.51 ± 0.37
LP4 (50–53) 0.49 ± 0.22 1.45 ± 0.44
LP5 (67–77) 1.44 ± 0.57 2.48 ± 0.80
Average rmsd (A
˚
) after fitting the secondary structure elements
(a1, b1–5) as in Fig. 1
LP1 2.65 ± 1.02 3.37 ± 1.30
LP2 1.11 ± 0.46 1.92 ± 0.52
LP3 2.05 ± 0.69 2.46 ± 0.70
LP4 2.32 ± 0.96 2.72 ± 0.75
LP5 10.96 ± 5.00 11.21 ± 4.73
Ramachandran analysis
Most favored region (%) 79.4
Allowed region (%) 19.6
Generously allowed (%) 0.7
Disallowed (%) 0.3
F. Paquet et al. NMR structure and backbone dynamics of MC1
FEBS Journal 277 (2010) 5133–5145 ª 2010 The Authors Journal compilation ª 2010 FEBS 5135
motions. Large variations of
15
N-NOE were observed
along the sequence at 600 MHz, particularly for Thr3,
Arg4, Gly17, Asp66–Ile79, Ile89, and Glu93, for which
15
N-NOE < 0.65; these residues clearly possess con-
siderable internal motions on the nanosecond time
scale. It is interesting to locate these residues in the
structure: they belong to bulges B1 (Gly17) and B2
(Ile89), loop LP5 (Asp66, Ala67, Lys69, Asn70, Arg71,
Ala73, Trp74, Met75, Glu77, Lys78, and Ile79), and
the termini (Thr3, Arg4, and Glu93).
Although the structure of the MC1ÆDNA complex
has not yet been solved, relaxation measurements on
the complex have been conducted (Fig. S3). Besides six
Pro residues, resonance overlap precluded the interpre-
tation of relaxation data for seven residues (Phe19,
Arg25, Gly51, Asp66, Lys86, Ile89, and Glu90).
LP1
LP3
C
LP4
LP5
N
LP2
β3
β5
180°
β1
β2
β4
180°
A
B
C
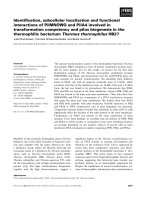
Fig. 1. (A) Superimposition of the 15 low-
est-energy structures fitted on the second-
ary structure elements. (B) Ribbon diagram
of the lowest-energy solution structure of
MC1. (C) Solvent-accessible surface area of
MC1 color-coded by surface charge (blue
and red correspond to basic and acidic
regions, respectively).
AB C D
C
C
N
N
N
N
C
C
C
Fig. 2. Structures of some archaeal chroma-
tin proteins other than the histones and Alba
homologs. (A) Sac7d (Protein Data Bank ID
code: 1AZP) and (B) Cren7 (Protein Data
Bank ID code: 3LWI) specific to Sulfolobus
(Crenarchaea). (C) MC1 (Protein Data Bank
ID code: 2KHL) specific to Methanosarcina
(Euryarchaea) and (D) HU monomer (Protein
Data Bank ID code: 1P71) specific to
Thermoplasma (Euryarchaea).
NMR structure and backbone dynamics of MC1 F. Paquet et al.
5136 FEBS Journal 277 (2010) 5133–5145 ª 2010 The Authors Journal compilation ª 2010 FEBS
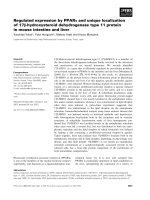
Several residues belonging to arm LP5 (Ala67, Lys69,
Asn70, Ala73, Met75, and Glu77) exhibit an increase
in
15
N-NOE. If we compare the sites that exhibit back-
bone chemical shift perturbations (CSPs) upon DNA
binding with those that exhibit an increase in NOE
upon DNA binding, we can conclude that the arm
becomes much less mobile after binding with DNA
(Fig. 4). This is reminiscent of the structure and
dynamics of the highly mobile b-arms in the free pro-
tein HU, which become much less mobile after binding
with DNA. In the model proposed by Tanaka, the
DNA-binding arms can move as rigid arms, creating
sufficient room for accepting DNA [20]. The tips of
the arms are highly flexible, and once the DNA has
moved inwards, the arms close and the tips of the
arms wrap around the DNA.
The amplitudes and time scales of the intramolecular
motions experienced by the protein backbone are com-
monly determined from the
15
N-NMR relaxation data,
by using the model-free approach suggested by Lipari
and Szabo [21,22] and extended by Clore et al. [23].
This approach is applicable for the case of statistically
independent overall tumbling and internal motions. In
the case of MC1, large-amplitude internal motions on
the same scale as global rotation are detected for at
least 16 N–H vectors, ruling out use of the model-free
formalism.
MD analysis
Consistent with experimental observations, the protein
core was stable at 300 K during the MD simulation.
The average backbone rmsd calculated with the sec-
ondary structure atoms of the 2000 snapshots was
2.2 ± 0.1 A
˚
. Such deviations are characteristic of pro-
tein simulations carried out in the presence of solvent
[24,25]. The backbone rmsd calculated with all of the
residue atoms starts at 5.8 A
˚
and increases up to 15 A
˚
during the 20 ns trajectory time, showing large
motions of the loops and the arm (Fig. S4).
Rotational diffusion
Knowing the rotational diffusion tensor is essential
for a detailed analysis of intramolecular motions in
nonspherical proteins. When the shape of a molecule
changes over time, its associated rotational diffusion
tensor varies. The eigenvalues of the diffusion tensor
2.5
A
B
C
β1 β2 β3α1 β4 β5
0.5
1.0
1.5
2.0
R
1
(s
–1
)R
2
(s
–1
)15
N-NOE
0.0
10
15
20
0
5
1
0
0.2
0.4
0.6
0.8
3 8 13 18 23 28 33 38 43 48 53 58 63 68 73 78 83 88 93
Sequence
Fig. 3. Backbone
15
N-relaxation data for
1.6 m
M free MC1 at 600 MHz. (A) Longitudi-
nal relaxation rate. (B) Transverse relaxation
rate. (C) Heteronuclear NOE.
F. Paquet et al. NMR structure and backbone dynamics of MC1
FEBS Journal 277 (2010) 5133–5145 ª 2010 The Authors Journal compilation ª 2010 FEBS 5137
show variations of 25% on the nanosecond time scale
during the 20 ns trajectory (Fig. 5). These variations,
resulting from the position of the arm, are correlated
with internal motions of the overall protein, as can be
observed for the C
a
–C
a
or H
N
–H
N
distances between
Arg71 and Leu92 (Fig. 6). The length of the arm
Ala67–Glu77 showed high variation (10.4–16.8 A
˚
), as
indicated by the distance C
a
–C
a
between Val65 at the
end of strand b4 and Arg71 at the extremity of
arm LP5. This stretch was made up of complex motions
in the arm, as shown by the variations in C
a
–C
a
dis-
tances between Ala67–Arg71, Ala67–Lys78, Arg71–
Val65, and Arg71–Ile79. The motion of the arm is cen-
tered on a hinge composed of Ala67 and Glu77. More-
over, loops LP1 and LP3 exhibited substantial
conformational changes during the trajectory, as
shown by variations in the C
a
–C
a
distances between
Glu11–Asp43, Gly13–Leu92, and Gly35–Lys62. Dur-
ing the trajectory, the location of loop LP1 changed in
relation to strands b3 and b5, as indicated by varia-
tions in the Glu11–Asp43 and Gly13–Leu92 distances.
Internal correlation functions
The internal autocorrelation functions are calculated
within the molecular reference frame of the superposed
structures. Figure 7A shows the time-correlation func-
tions for three representative residues in different parts
of MC1. The upper N–H vector (Gln26 in the helix)
shows a rapid (< 10 ps) decay of C(t) from 1.0 to
$ 0.9, arising from vibrational motion. This correla-
tion function is typical for residues in relatively rigid
parts of MC1, such as the a-helix and the b-strands,
excluding bulges. The correlation functions for two
residues, Val18 in a bulge and Asn70 in the arm, are
also shown. The fast decay of the Val18 N–H vector
(S
f
2
= 0.85) is followed by a slow motion on a nano-
second time scale with an order parameter, S
2
, of 0.55.
The third C(t) of Asn70 is composed of three decays.
The fast decay (< 10 ps) is followed by an intermedi-
ate decay (100–500 ps) that primarily arises from libra-
tional motion. This intermediate motion is common to
residues belonging to loops LP1, LP3, LP4, and LP5,
180°
180°
A
B
Fig. 4. (A) Residues that exhibit a significant
increase in
15
N-NOE upon DNA binding are
in blue, and those with an intermediate
increase are in marine. (B) Residues that
exhibit significant CSP upon DNA binding
are in red, and those with intermediate
changes are in orange.
1.9
1.3
1.5
1.7
D
x
(10
7
s
–1
)
D
y
(10
7
s
–1
)
D
z
(10
7
s
–1
)
Time (ns)
1.6
1.8
1.2
1.4
2.8
3.0
3.2
2.4
2.6
0 2 8 10121416182046
Time (ns)
0 2 8 10121416182046
Time (ns)
0 2 8 10121416182046
Fig. 5. Fluctuations in the anisotropic rotational diffusion eigen-
values D
x
, D
y
and D
z
along the 20 ns trajectory.
NMR structure and backbone dynamics of MC1 F. Paquet et al.
5138 FEBS Journal 277 (2010) 5133–5145 ª 2010 The Authors Journal compilation ª 2010 FEBS
in the last case with larger amplitude. Finally, a slower
decay reaches a plateau value S
2
of 0.10 after 8.3 ns.
This time value is close to the average harmonic mean
correlation time of 8.6 ± 0.3 ns calculated using
hydronmr during the trajectory.
The MD-derived order parameters S
2
values for the
b-strands and the a-helix are consistent with the exper-
imental relaxation data (Fig. 7B). Slow motions were
detected for Ser1, Asn2, Leu92, Glu93 (terminal resi-
dues), Gly17 to Phe19 (bulge B1), Arg34 to Gly37
(loop LP3), Gly51 and Thr52 (loop LP4), Ala67 to
Lys78 (loop LP5), and Glu87 to Ile89 (bulge B2). The
largest amplitudes were observed for Ser36 (S
2
= 0.13)
and from Ala67 to Asn70 (0.1 < S
2
< 0.16). The resi-
dues involved in the two bulges have S
2
values around
0.6, which is consistent with the
15
N-NOE values. The
calculated S
2
values in the loops are lower than
expected, particularly in loops LP3 and LP4. A recent
study provides evidence for a specific link between
force field deficiencies and disagreement between
experimental and MD order parameters [26]. MD sim-
ulations using three MD force fields (comprising
amber ff03) overestimate the flexibility of backbone
N)H vectors at the borders of secondary structure and
in loops. Specific inaccuracies in the treatment of
hydrogen bonding could be responsible for increased
flexibility in silico. In the case of MC1, the conforma-
tional changes observed during the trajectory are
consistent with the crosspeaks observed on the
NOESY spectra. Low values of S
2
computed with the
correlation functions indicated slow motions with large
amplitude. However, these values can only be obtained
with large uncertainties, as a trajectory of 20 ns
allowed us to calculate a correlation function only over
10 ns. Achieving reliable correlation functions requires
several repetitions of occurrences on the time scale of
the trajectory. An isolated occurrence generates waves
on the correlation function that have little significance,
as seen for Val18.
Correlated motions on the nanosecond time
scale
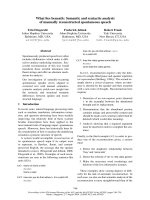
The trajectories of some dihedral angles and distances
were examined in the two b-bulges and in the loops.
For bulge B1, a hydrogen bond was alternately present
12
14
16
13–92
14
16
71–65
6
8
10
12
8
10
35–62
10
12
14
9
11
71–67
Distance (
Å
)
Distance (Å)
4
6
8
12
14
11–43
5
7
12
14
71–79
Distance (
Å
)
Distance (Å)
6
8
10
9
11
67–78
8
10
12
48
52
71–92
Distance (
Å
)
Distance (Å)
3
5
7
40
44
0 5 10 15 20 0 5 10 15 20
Time (ns)Time (ns)
Distance (
Å
)
Distance (Å)
92
13
11
43
35
62
79
78
65
67
71
92
13
11
43
35
62
79
78
65
67
71
A
B
Fig. 6. (A) Some C
a
–C
a
distances (A
˚
)
along the 20 ns simulation trajectory.
(B) Snapshots of MC1 after the equilibrium
period at 0 and 17.5 ns. Black lines indicate
distances between specific residues that
show shape variations during the trajectory.
F. Paquet et al. NMR structure and backbone dynamics of MC1
FEBS Journal 277 (2010) 5133–5145 ª 2010 The Authors Journal compilation ª 2010 FEBS 5139
between NH(Leu8) and CO(His16) for 9 ns, and
between NH(Leu8) and CO(Val17) for 9.5 ns
(Fig. 8A,C). Thus, at least one of the two hydrogen
bonds was present for 18.5 ns on the 20 ns trajectory
time. The transitions occurred at 1, 2, 10, 14, 15 and
19 ns, and are correlated with the motions of the dihe-
dral angles w(His16), u(Gly17), and w(Val18). This
flip-flop leads to slow internal motions with large
amplitude, as seen for C(t) of NH(Gly17) and
NH(Val18) (S
2
= 0.55). For bulge B2, a unique
hydrogen bond between NH(Val57) and CO(Arg88)
was present for 13 ns in periods of 2–4 ns (Fig. 8B,C).
At the same time and for 7.5 ns, a water-
mediated hydrogen bond between NH(Val57) and
CO(Glu87) was formed when the distance was
$ 6.4 A
˚
. The two strands were thus completely sepa-
rated for 7 ns of the trajectory time, which could
explain the greater flexibility of this bulge and the slow
internal motions of Glu87, Arg88 and Ile89 with very
large amplitude. These motions were correlated with
the dihedral angle transitions of w(Glu87), u(Arg88),
and u(Ile89). The presence of these hydrogen bonds
was consistent with the homonuclear NOEs found in
this region [15].
Loop LP1 was stabilized with two hydrogen bonds,
NH(Asp10)–CO(Asn14) and NH(Gly13)–CO(Asp10),
throughout the trajectory time. Similarly, the hydrogen
bond NH(Gln26)–CO(Gln23) stabilized the short loop
LP2 for 19 ns.
The lack of stable hydrogen bonds in loop LP3 (35–
42) corresponds with large motions of the N)H
vectors for Gly35, Ser36, and Gly37. However, this
nonstructured loop is probably not important in the
DNA binding, because the number of residues between
Gly35 and Ile45 (MC1-CHTI55 numbering) varies
from 3 to 14 in different species of Halobacteria and
Methanomicrobia [15].
Loop LP4 (50–53) was stabilized by two hydrogen
bonds, NH(Thr52)–CO(Glu49) and NH(Leu92)–
CO(Lys53), binding the loop to strand b5 for 11 ns.
Supplementary hydrogen bonds involving the side
chains NH
2
(Arg48)–CO(Thr52) and OH(Thr52)–
CO(Glu49) contribute to the stiffness of the structure
for a short time. Moreover, two NOE crosspeaks,
OH(Thr52)–NH(Thr52) and OH(Thr52)–NH(Glu49),
were observed on the free protein MC1 NOESY spec-
tra, owing to a slower exchange process with water.
This could be explained by hydrogen bonds involving
the hydroxyl proton of Thr52.
In arm LP5 (67–77), Ala67, Lys69 and Asn70 have
global S
2
values of $ 0.1, whereas the other resi-
dues have S
2
values in the range 0.26–0.46. This
A
1.0
Q26
0.4
0.6
0.8
C (t)
V18
0.0
0.2
Time (ns)
N70
0.6
0.8
1
B
β1 β2 β3α1 β4
β5
0
0.2
0.4
0123
45
678910
1 6 11 16 21 26 31 36 41 46 51 56 61 66 71 76 81 86 91
S
2
Sequence
Fig. 7. (A) Three representative internal cor-
relation functions computed on a trajectory
of 20 ns for Gln26 in the a-helix, Val18 in a
bulge, and Asn70 in the arm. (B) Residue
profile of the MD-derived S
2
.
NMR structure and backbone dynamics of MC1 F. Paquet et al.
5140 FEBS Journal 277 (2010) 5133–5145 ª 2010 The Authors Journal compilation ª 2010 FEBS
corresponds to a combination of slow motions of
large amplitude. In accordance with this, only four
hydrogen bonds were observed: NH(Lys71)–CO
(Pro68), NH
2
(Lys71)–CO(Pro76), NH(Met75)–CO
(Pro72), and NH(Trp74)–CO(Pro72) for 6.5, 11, 16
and 0.3 ns respectively.
Summary
In summary, the structure of MC1, consisting of a
pseudobarrel with an extension of the b-sheet (b4–b5)
forming an arm of 11 residues, has been refined. The
global fold is now compatible with the biochemical
data and a DNA-binding site covering at least 15 bp.
The structure features five loops that show a large
distribution in the ensemble of 3D structures. Evidence
for the fact that this distribution signifies internal
mobility on the nanosecond time scale is provided by
using
15
N-relaxation and MD simulations. These local
conformational changes in MC1 could facilitate DNA
binding, with two areas of contact separated by nearly
10 bp. Moreover, the flexibility of MC1 builds up con-
formations with large positively charged areas that are
highly favorable for binding with the phosphate
groups of nucleotides. Some residues belonging to
arm LP5 (Ala67, Lys69, Asn70, Ala73, and Met75)
and to bulge B2 (Ile89) are involved in motions on the
nanosecond time scale, and could be related to the
interaction with DNA. A study of a DNAÆ MC1 com-
plex is currently underway.
200
300
400
Psi angle (deg)
Psi angle (deg)
H16
50
150
E87
B
A
100
–50
0
100
200
300
Phi angle (deg)
Phi angle (deg)Phi angle (deg)
G17
50
150
250
R88
100
200
300
Psi angle (deg)
V18
50
100
150
200
I89
7.0
NH8 - CO16
8.0
NH57 - CO87
1.0
3.0
5.0
Distance
(Å)
Distance
(Å)
Distance
(Å)
Distance
(Å)
5.0
7.0
NH8 - CO17
2.0
4.0
6.0
5.0
NH57 - CO88
1.0
3.0
1.0
3.0
0 2 4 6 8 101214161820
0 2 4 6 8 10 12 14 16 18 20
Time (ns)
Time (ns)
C
Fig. 8. Dihedral angle and distance transi-
tions as a function of time of the two
bulges. (A) Bulge Leu8, His16 and Gly17. (B)
Bulge Val57, Glu87 and Arg88. (C) Schemes
of the bulges. The dotted lines and the time
characterized the presence of hydrogen
bonding during the trajectory.
F. Paquet et al. NMR structure and backbone dynamics of MC1
FEBS Journal 277 (2010) 5133–5145 ª 2010 The Authors Journal compilation ª 2010 FEBS 5141
Experimental procedures
Preparation of
13
C,
15
N-labeled MC1
The proteins were expressed in BL-21(DE3) cells trans-
formed with the pET24a–mc1 plasmid. Protein doubly
labeled with
15
N and
13
C was obtained by using an iso-
tope-enriched Celtone-rich medium (Martek Biosciences,
Columbia, MD, USA). To obtain
15
N-labeled protein,
cells were first grown in LB medium, and then, at a
D
600 nm
of 0.7, they were collected and resuspended in
M9 medium containing
15
NH
4
Cl [27]. In both cases,
expression of the protein was performed for 2 h after
addition of 0.1 mm isopropyl thio-b-d-galactoside. Purifi-
cation of the proteins was performed by SP-Sepharose
(GE Healthcare Europe GmbH, Orsay, France) chroma-
tography followed by Ultrogel AcA 54 chromatography.
The concentration of protein was determined by absorp-
tion spectrophotometry, with a molecular absorbance
coefficient of 11 000 m
)1
Æcm
)1
at 280 nm.
The NMR protein sample was prepared by concentrating
MC1 to 1.6 mm (100 mm acetate buffer, pH 5.1, 800 mm
NaCl, 1 mm EDTA, 10% D
2
O). In order to check the pos-
sible presence of MC1 oligomers,
15
N-HSQC spectra were
obtained with different concentrations of MC1 in the same
buffer conditions. Decreasing the protein concentration by
a factor of 20 (1.6 mm to 0.08 mm) showed no significant
variation in the
1
H and
15
N chemical shifts.
The DNA oligonucleotides used for NMR were purchased
from Eurogentec (Lie
`
ge, Belgium) (OliGold oligonucleotides
quality). The single-stranded 15 bp oligodeoxynucleotides
were characterized by NMR and annealed at a 1 : 1 ratio.
The MC1ÆDNA complex was prepared by slowly adding
the 7.5 mm DNA duplex solution (10 mm phosphate buffer,
pH 6, 100 mm NaCl, 1 mm EDTA, 10% D
2
O) to the
1.6 mm protein solution (10 mm phosphate buffer, pH 6,
100 mm NaCl, 1 mm EDTA, 10% D
2
O) to give a final
complex concentration of $ 1mm.
NMR spectroscopy and structure calculations
Two-dimensional and three-dimensional NMR experiments
were performed on a 600 MHz Varian
UNITY
INOVA spec-
trometer at 299 K. Spectra were processed with nmrpipe
[28], and analyzed with nmrview [29]. Backbone and side
chain resonance assignments were obtained from the stan-
dard triple resonance experiments [30]. 4,4-dimethyl-4-sila-
pentane-1-sulfonic acid was used as a
13
C chemical shift
reference. Interproton distances were derived from NOESY
datasets obtained at mixing times of 100, 150 and 200 ms.
Backbone dihedral angle restraints were determined with
the talos program [31].
1
D
NH
RDCs were measured by
using 2D InPhase AntiPhase
1
H–
15
N-HSQC experiments in
radially compressed 7% polyacrylamide gel (6.0–4.2 mm)
[32,33].
Structures were calculated with NOE distance, hydrogen
bond, u and W angle and RDC constraints, using aria2
(version 2.2) [34]. The aria2 protocol (cns 1.1) used simu-
lated annealing with torsion angle and Cartesian space
dynamics with the default parameters. RDC restraints
within the aria2 protocol were incorporated at the last iter-
ation with the correct parameters (D
a
= 15.21 and
R = D
r
⁄ D
a
= 0.19). RDC restraints were fitted and ana-
lyzed with the module program [35]. Fifteen structures
from six independent runs were selected on the basis of
total energies and restraint violation statistics, to represent
the structure of MC1 in solution. The electrostatic potential
was calculated by using the pdb2pqr server (version 1.6)
[36] and apbs software [37]. The figures were prepared with
pymol [38] or molmol [39].
Determination and analysis of
15
N-relaxation
parameters (R
1
, R
2
, and NOE) for MC1
NMR relaxation experiments were measured at 299 K on
a Varian 500 MHz (NOE), Varian INOVA 600 MHz
(NOE, R
1
and R
2
) and Varian INOVA 800 MHz (R
1
and
R
2
) equipped with a cryogenic triple resonance probe spec-
trometer. On each instrument,
15
N R
1
and R
2
spectra were
acquired with 32 scans per t1 point, with a recycle delay
of 3.0 s. R
1
relaxation delays of 10, 100, 200, 380, 500,
750, 1000 and 1300 ms were used for data collection. R
2
relaxation delays of 10, 20, 30, 50, 70, 90, 150, 210 and
310 ms were used for data collection at 600 MHz, and R
2
relaxation delays of 10, 20, 30, 50, 70, 90, 110 and 150 ms
were used for data collection at 800 MHz. The errors in
R
1
and R
2
were determined by generating random distri-
butions of the measured volume V within the V ± DV
range and by repeating the fit with this procedure 1000
times. The
15
N-NOE spectra were collected at 500 and
600 MHz with a 3 s presaturation period and a 2 s relaxa-
tion delay; the reference experiment had an equivalent 5 s
delay. The
1
H–
15
N heteronuclear NOE was calculated
from the equation NOE = I
sat
⁄ I
eq
, where I
sat
and I
eq
were
the volumes of a crosspeak in the spectra collected with
and without proton saturation. Both were acquired with
64 scans. All experiments were run twice in the same con-
ditions. Volumes for the amide
15
N–
1
H crosspeaks were
measured by using nmrview software [29]. Uncertainties
in the volumes were measured from the duplicate spectra.
After obtaining volumes of crosspeaks and their errors,
the above time series were fitted from a single exponential
decay function.
Relaxation experiments for the MC1ÆDNA complex were
performed at 600 MHz as described above, with R
1
relaxa-
tion delays of 10, 100, 200, 300, 500, 800, 1000 and
1300 ms and R
2
relaxation delays of 10, 30, 50, 70, 90, 110,
130 and 150 ms at 299 K.
Backbone CSPs and
15
N-NOE changes upon DNA bind-
ing were analyzed with samplex [40].
NMR structure and backbone dynamics of MC1 F. Paquet et al.
5142 FEBS Journal 277 (2010) 5133–5145 ª 2010 The Authors Journal compilation ª 2010 FEBS
MD simulation
An NMR structure (Protein Data Bank ID: 2KHL-1) was
used to initiate a 20 ns simulation. Twelve Cl
)
counterions
were first added, and the resulting system was centered in a
truncated octahedron box containing 9013 water molecules.
Ten thousand steps of energy minimization were applied in
order to remove bad contacts. This was followed by a
100 ps MD simulation in the NVT ensemble (constant
number of atoms, volume, and temperature), during which
the temperature was progressively increased from 0 to
300 K, the positions of protein atoms and of counterions
being restrained. Then, over a period of 200 ps at 300 K,
the restraints were progressively removed. Equilibration of
the system in the NPT ensemble (constant number of
atoms, pressure, and temperature) was then performed for
1500 ps to ensure a reliable density. Finally a 20 ns free
MD simulation was run, and conformations were stored
every 10 ps. The following conditions were applied: 2 fs
steps for solving Newton’s equation with the SHAKE algo-
rithm, NPT ensemble during the free simulation, periodic
boundary conditions, and particle mesh ewald treatment of
electrostatic interactions. The amber package with the ff03
force field was used for preparing the system, energy mini-
mization, and MD simulation [41].
A total of 2000 snapshots with a time increment of 10 ps
were analyzed from the final 20 ns of the MD simulation.
Prior to this, overall translational and reorientational
motions were removed by a least squares superposition of
the secondary structure backbone atoms of each snapshot
on those of the mean snapshot. The mean structure is taken
as the most central structure among the simulated ones,
and corresponds to the one at 12.01 ns in the present work.
During the analysis, the rmsd between two structures was
evaluated as:
rmsd ¼
1
N
X
ðr
1
À r
2
Þ
2
1
2
where N is the number of atoms taken into consideration,
r
1
and r
2
are the position vectors of an atom in both struc-
tures, respectively, and the summation is performed over
N atoms.
Rotational diffusion
Each MD snapshot is considered as a rigid body. By apply-
ing hydrodynamic theory, the program hydronmr [42]
computes the eigenvalues of the anisotropic rotational dif-
fusion tensor. The harmonic mean correlation time is calcu-
lated from the five rotational relaxation times.
Internal correlation function
To gain insights into the nature of the dynamics, the auto-
correlation functions C(t) were evaluated during the first
10 ns, using the 20 ns trajectory time for the 93 NH vec-
tors. The autocorrelation function, C(t), of the overall
dynamic process is the product of the global, C
0
(t), and the
internal, C
i
(t), correlation functions [21–23]. For MD simu-
lations where the global motion is eliminated, the autocor-
relation function, C(t), is equal to the internal correlation
function, C
i
(t).
Internal correlation functions were then calculated
according to the equation:
CðtÞ¼ P
2
½lð0ÞhÁlðtÞi
where P
2
[x] is the second Legendre polynomial, and l is the
N–H bond vector scaled to unit magnitude.
When the internal correlation function is made up of
three decreasing exponentials, the expression of the internal
correlation function is:
CðtÞ¼S
2
þ A
f
e
ðÀt=s
f
Þ
þ A
m
e
ðÀt=s
m
Þ
þ A
s
e
ðÀt=s
s
Þ
with A
f
, A
m
and A
s
are the amplitudes, and s
f
, s
m
ands
s
are
the correlation times of the fast, medium and slow motions
respectively.
CðtÞ¼S
2
þð1 À S
2
f
Þ e
ðÀt=s
f
Þ
þð1 À S
2
m
ÞS
2
f
e
ðÀt=s
m
Þ
þð1 À S
2
s
ÞS
2
f
S
2
m
e
ðÀt=s
s
Þ
where S
2
f
¼ 1 À A
f
; S
2
m
¼ð1 À A
f
À A
m
Þ=ð1 À A
f
Þ; S
2
s
¼ð1 À A
f
ÀA
m
À A
s
Þ=ð1 À A
f
À A
m
Þ and; S
2
¼ S
2
f
S
2
m
S
2
s
:
The correlation function drops rapidly to a plateau (S
f
2
),
and then more slowly to a second plateau (S
m
2
), and finally
to a third plateau (S
2
).
Hydrogen bonding
A hydrogen bond was considered to be present when the
distance between the donor (D) and the acceptor (A) was
smaller than 3.5 A
˚
and the D–H–A angle was larger than
135°.
Acknowledgements
The authors would like to thank S. Goffinont (CBM,
Orle
´
ans, France) for his participation in preparing the
labeled MC1. Financial support from the TGE RMN
THC Fr3050 for conducting the research is gratefully
acknowledged.
References
1 Sandman K & Reeve JN (2005) Archaeal chromatin
proteins: different structures but common function?
Curr Opin Microbiol 8, 656–661.
2 Sandman K & Reeve JN (2001) Chromosome packag-
ing by archaeal histones. Adv Appl Microbiol 50, 75–99.
F. Paquet et al. NMR structure and backbone dynamics of MC1
FEBS Journal 277 (2010) 5133–5145 ª 2010 The Authors Journal compilation ª 2010 FEBS 5143
3 Guo L, Feng Y, Zhang Z, Yao H, Luo Y, Wang J &
Huang L (2008) Biochemical and structural character-
ization of Cren7, a novel chromatin protein conserved
among Crenarchaea. Nucleic Acids Res 36, 1129–1137.
4 Su S, Gao YG, Robinson H, Liaw YC, Edmondson
SP, Shriver JW & Wang AH (2000) Crystal structures
of the chromosomal proteins Sso7d ⁄ Sac7d bound to
DNA containing T-G mismatched base-pairs. J Mol
Biol 303, 395–403.
5 DeLange RJ, Green GR & Searcy DG (1981)
A histone-like protein (HTa) from Thermoplasma
acidophilum. I. Purification and properties. J Biol Chem
256, 900–904.
6 Durney MA, Wechselberger RW, Kalodimos CG,
Kaptein R, Vorgias CE & Boelens R (2004) An alter-
nate conformation of the hyperthermostable HU
protein from Thermotoga maritima has unexpectedly
high flexibility. FEBS Lett 563, 49–54.
7 Wardleworth BN, Russell RJ, Bell SD, Taylor GL &
White MF (2002) Structure of Alba: an archaeal chro-
matin protein modulated by acetylation. EMBO J 21,
4654–4662.
8 Weidenbach K, Gloer J, Ehlers C, Sandman K,
Reeve JN & Schmitz RA (2008) Deletion of the archa-
eal histone in Methanosarcina mazei Go1 results in
reduced growth and genomic transcription. Mol Micro-
biol 67, 662–671.
9 Chartier F, Laine B & Sautiere P (1988) Characteriza-
tion of the chromosomal protein MC1 from the thermo-
philic archaebacterium Methanosarcina sp. CHTI 55
and its effect on the thermal stability of DNA. Biochim
Biophys Acta 951, 149–156.
10 Paradinas C, Gervais A, Maurizot JC & Culard F (1998)
Structure-specific binding recognition of a methanogen
chromosomal protein. Eur J Biochem 257, 372–379.
11 Toulme F, Le Cam E, Teyssier C, Delain E, Sautiere P,
Maurizot JC & Culard F (1995) Conformational
changes of DNA minicircles upon the binding of the
archaebacterial histone-like protein MC1. J Biol Chem
270, 6286–6291.
12 Teyssier C, Toulme F, Touzel JP, Gervais A,
Maurizot JC & Culard F (1996) Preferential binding of
the archaebacterial histone-like MC1 protein to nega-
tively supercoiled DNA minicircles. Biochemistry 35,
7954–7958.
13 De Vuyst G, Aci S, Genest D & Culard F (2005)
Atypical recognition of particular DNA sequences by
the archaeal chromosomal MC1 protein. Biochemistry
44, 10369–10377.
14 Le Cam E, Culard F, Larquet E, Delain E & Cognet
JA (1999) DNA bending induced by the archaebacterial
histone-like protein MC1. J Mol Biol 285, 1011–1021.
15 Paquet F, Culard F, Barbault F, Maurizot JC & Lance-
lot G (2004) NMR solution structure of the archaebac-
terial chromosomal protein MC1 reveals a new protein
fold. Biochemistry 43, 14971–14978.
16 Bure C, Goffinont S, Delmas AF, Cadene M & Culard
F (2008) Oxidation-sensitive residues mediate the DNA
bending abilities of the architectural MC1 protein.
J Mol Biol 376, 120–130.
17 Zhang Z, Gong Y, Guo L, Jiang T & Huang L (2010)
Structural insights into the interaction of the crenarcha-
eal chromatin protein Cren7 with DNA. Mol Microbiol
76, 749–759.
18 Vis H, Mariani M, Vorgias CE, Wilson KS, Kaptein R
& Boelens R (1995) Solution structure of the HU pro-
tein from Bacillus stearothermophilus. J Mol Biol 254,
692–703.
19 Swinger KK, Lemberg KM, Zhang Y & Rice PA
(2003) Flexible DNA bending in HU–DNA cocrystal
structures.
EMBO J 22, 3749–3760.
20 Tanaka I, Appelt K, Dijk J, White SW & Wilson KS
(1984) 3-A resolution structure of a protein with
histone-like properties in prokaryotes. Nature 310, 376–
381.
21 Lipari G & Szabo A (1982) Model-free approach to the
interpretation of nuclear magnetic resonance relaxation
in macromolecules. 1. Theory and range of validity.
J Am Chem Soc 104, 4546–4559.
22 Lipari G & Szabo A (1982) Model-free approach to the
interpretation of nuclear magnetic resonance relaxation
in macromolecules. 2. Analysis of experimental results.
J Am Chem Soc 104, 4559–4570.
23 Clore GM, Szabo A, Bax A, Kay LE, Driscoll PC &
Gronenborn AM (1990) Deviations from the simple
two-parameter model-free approach to the interpreta-
tion of nitrogen-15 nuclear magnetic relaxation of
proteins. J Am Chem Soc 112, 4989–4991.
24 Loncharich RJ & Brooks BR (1990) Temperature
dependence of dynamics of hydrated myoglobin.
Comparison of force field calculations with neutron
scattering data. J Mol Biol 215, 439–455.
25 Chandrasekhar I, Clore GM, Szabo A, Gronenborn AM
& Brooks BR (1992) A 500 ps molecular dynamics
simulation study of interleukin-1 beta in water.
Correlation with nuclear magnetic resonance spectros-
copy and crystallography. J Mol Biol 226, 239–250.
26 Trbovic N, Kim B, Friesner RA & Palmer AG III
(2008) Structural analysis of protein dynamics by MD
simulations and NMR spin-relaxation. Proteins 71,
684–694.
27 Marley J, Lu M & Bracken C (2001) A method for effi-
cient isotopic labeling of recombinant proteins. J Bio-
mol NMR 20, 71–75.
28 Delaglio F, Grzesiek S, Vuister GW, Zhu G, Pfeifer J
& Bax A (1995) NMRPipe: a multidimensional spectral
processing system based on UNIX pipes. J Biomol
NMR 6, 277–293.
NMR structure and backbone dynamics of MC1 F. Paquet et al.
5144 FEBS Journal 277 (2010) 5133–5145 ª 2010 The Authors Journal compilation ª 2010 FEBS
29 Johnson BA & Blevins RA (1994) NMR View: a com-
puter program for the visualization and analysis of
NMR data. J Biomol NMR 4, 603–614.
30 Cavanagh J, Fairbrother WJ, Palmer AG III, Rance M
& Skelton NJ (2007) Protein NMR spectroscopy:
principles and practice, 2nd edn. Elsevier Academic
Press, London, UK.
31 Cornilescu G, Delaglio F & Bax A (1999) Protein back-
bone angle restraints from searching a database for
chemical shift and sequence homology. J Biomol NMR
13, 289–302.
32 Ishii Y, Markus MA & Tycko R (2001) Controlling
residual dipolar couplings in high-resolution NMR of
proteins by strain induced alignment in a gel. J Biomol
NMR 21, 141–151.
33 Chou JJ, Gaemers S, Howder B, Louis JM & Bax A
(2001) A simple apparatus for generating stretched
polyacrylamide gels, yielding uniform alignment of
proteins and detergent micelles. J Biomol NMR 21,
377–382.
34 Rieping W, Habeck M, Bardiaux B, Bernard A,
Malliavin TE & Nilges M (2007) ARIA2: auto-
mated NOE assignment and data integration in
NMR structure calculation. Bioinformatics 23, 381–
382.
35 Dosset P, Hus JC, Marion D & Blackledge M (2001)
A novel interactive tool for rigid-body modeling of
multi-domain macromolecules using residual dipolar
couplings. J Biomol NMR 20, 223–231.
36 Dolinsky TJ, Nielsen JE, McCammon JA & Baker NA
(2004) PDB2PQR: an automated pipeline for the setup
of Poisson–Boltzmann electrostatics calculations.
Nucleic Acids Res 32 , W665–667.
37 Baker NA, Sept D, Joseph S, Holst MJ & McCammon
JA (2001) Electrostatics of nanosystems: application to
microtubules and the ribosome. Proc Natl Acad Sci
USA 98, 10037–10041.
38 De Lano WL (2002) Pymol. De Lano Scientific, South
San Francisco, CA.
39 Koradi R, Billeter M & Wuthrich K (1996) MOLMOL:
a program for display and analysis of macromolecular
structures. J Mol Graph 14, 51–55.
40 Krzeminski M, Loth K, Boelens R & Bonvin AM
(2010) SAMPLEX: automatic mapping of perturbed
and unperturbed regions of proteins and complexes.
BMC Bioinformatics 11, 51–58.
41 Case DA, Darden TE, Cheatham TE III, Simmerling
CL, Wang J, Duke RE, Luo R, Merz KM, Pearlman
DA, Crowley M et al. (2006) AMBER 9. University of
California, San Francisco.
42 Garcia de la Torre J, Huertas ML & Carrasco B (2000)
HYDRONMR: prediction of NMR relaxation of glob-
ular proteins from atomic-level structures and hydrody-
namic calculations. J Magn Reson 147, 138–146.
Supporting information
The following supplementary material is available:
Fig. S1. Six hundred megahertz
1
H–
15
N-HSQC NMR
spectrum of MC1 (1.6 mm), 800 mm NaCl, and
100 mm acetate buffer (pH 5.1, 26 °C). Peaks corre-
sponding to the NH
2
groups of the side chain amides
of Asp and Gln residues are connected by thin lines.
Fig. S2. Backbone
15
N-relaxation data for 1.6 mm free
MC1 at 800 MHz: (A) Longitudinal relaxation rate.
(B) Transverse relaxation rate.
Fig. S3. Backbone
15
N-relaxation data for 1 mm
MC1ÆDNA complex at 600 MHz: (A) Longitudinal
relaxation rate. (B) Transverse relaxation rate. (C)
Heteronuclear NOE.
Fig. S4. (A) rmsd calculated with the secondary struc-
ture backbone. (B) rmsd calculated with all of the resi-
due atoms during the 20 ns trajectory time, showing
large motions of the loops and the arm. The structures
obtained during the trajectory were aligned by least
squares fitting of the secondary structure backbone
atoms before evaluation of the rmsd.
Table S1.
15
N,
1
H and
13
C chemical shifts (p.p.m.) for
MC1 (1.6 mm) in 800 mm NaCl and 100 mm acetate
buffer at pH 5.1 and 26 °C.
This supplementary material can be found in the
online version of this article.
Please note: As a service to our authors and readers,
this journal provides supporting information supplied
by the authors. Such materials are peer-reviewed and
may be re-organized for online delivery, but are not
copy-edited or typeset. Technical support issues arising
from supporting information (other than missing files)
should be addressed to the authors.
F. Paquet et al. NMR structure and backbone dynamics of MC1
FEBS Journal 277 (2010) 5133–5145 ª 2010 The Authors Journal compilation ª 2010 FEBS 5145