Effect of iron supplementation on mild to moderate anaemia in pulmonary tuberculosis pdf
Bạn đang xem bản rút gọn của tài liệu. Xem và tải ngay bản đầy đủ của tài liệu tại đây (128.59 KB, 10 trang )
Effect of iron supplementation on mild to moderate anaemia
in pulmonary tuberculosis
Uma Devi, C. Mohan Rao, Vinod K. Srivastava, Pramod K. Rath and Bhabani S. Das*
Departments of Chest and Tubercular Diseases, Pathology, and Biochemistry, Ispat General Hospital,
Rourkela - 769 005, Orissa, India
(Received 19 April 2002 – Revised 23 December 2002 – Accepted 10 May 2003)
Anaemia is a common complication of pulmonary tuberculosis. The precise mechanism of anaemia in pulmonary tuberculosis is not
clearly known, but anaemia of inflammation as well as of Fe deficiency has been implicated. Both are common in developing countries.
It is extremely difficult to distinguish anaemia of Fe deficiency from anaemia of inflammation with the haematological indices used rou-
tinely. Therefore, Fe preparations are usually prescribed for all anaemic patients irrespective of the aetiology. This approach has been
questioned. The present study aimed to assess the effect of Fe supplementation on anaemic patients with pulmonary tuberculosis.
Adult male patients 15 –60 years of age with pulmonary tuberculosis and a blood haemoglobin concentration 80 –110 g/l were included
in the study; healthy adult males matched for age and socio-economic status were taken as controls. Blood haemoglobin concentration,
total erythrocyte count (TEC), packed cell volume (PCV), mean corpuscular volume (MCV), mean corpuscular haemoglobin and
serum Fe, total Fe-binding capacity and ferritin were estimated before treatment and 1, 2 and 6 months after treatment. The patients
were divided randomly into three groups and during the initial 2 months of treatment were provided with one of three supplementary regi-
mens consisting of placebo, Fe alone or Fe with other haematinics. Significant improvements in haematological indices and Fe status were
noticed in all three groups. Blood haemoglobin concentration, MCV and PCV were significantly higher at 1 month in both Fe-sup-
plemented groups than the placebo group. This difference, however, disappeared at 2 and 6 months with similar values in all three
groups. The increase of other haematological indices was similar in all groups. Serum Fe and Fe saturation of transferrin were significantly
higher in both Fe-supplemented groups than the placebo group up to 2 months; this effect, however, disappeared at 6 months. There was a
consistent increase in TEC and decrease in ferritin values up to 6 months in all groups. Radiological and clinical improvement was similar
in all three groups. These observations suggest that Fe supplementation in mild to moderate anaemia associated with pulmonary tubercu-
losis accelerated the normal resumption of haematopoiesis in the initial phases by increasing Fe saturation of transferrin. However, con-
sistent improvement of haematological status was dependent only on the improvement of the disease process.
Anaemia: Iron: Pulmonary tuberculosis
Anaemia is a common complication of pulmonary tubercu-
losis, the reported prevalence ranging from 16 to 76 % in
different studies (Goldenberg, 1996). A lower blood hae-
moglobin concentration was found in children with tuber-
culosis than in non-tubercular children (Wessels et al.
1999). The precise mechanism of anaemia in pulmonary
tuberculosis is not known. Several hypotheses, including
blood loss because of haemoptysis (blood in the sputum),
bone marrow involvement with tubercular granuloma in
disseminated tuberculosis (Lombard & Mansvelt, 1993),
nutritional deficiency caused by fever and loss of appetite
etc., have been proposed. Anaemia in pulmonary tubercu-
losis may also occur as a consequence of chronic inflam-
mation, and without apparent loss of blood or bone
marrow suppression (Baynes et al. 1986a). Blunted
response of erythropoietin due to release of tumour
necrosis factor a or other cytokines have been observed
(Ebrahim et al. 1995). Tuberculosis is a chronic infectious
disease, so anaemia of inflammation may contribute
significantly.
Hypoferraemia induced by the shift of Fe from a trans-
ferrin-bound available state to a ferritin-incorporated
storage state is considered to be a major factor in the patho-
genesis of anaemia of chronic inflammation. The condition
may have evolved as a cytokine-mediated defence against
microbial pathogens, effectively withholding Fe from
microbes, which incidentally also deprives erythroid pre-
cursors of their Fe supply (Bullen et al. 1978; Weinberg,
1978; Jurado, 1997). Therefore, Fe-deficiency status may
be a protective response against invading microbes: mild
anaemia may be a small price to pay for the attenuation
of infection. The only effective treatment for anaemia
* Corresponding author: Dr B. S. Das, fax þ91 661 2642703/ þ 91 661 2510085, email
Abbreviations: MCH, mean corpuscular haemoglobin; MCV, mean corpuscular volume; PCV, packed cell volume; TEC, total erythrocyte count; TIBC,
total Fe-binding capacity.
British Journal of Nutrition (2003), 90, 541–550 DOI: 10.1079/BJN2003936
q The Authors 2003
of chronic inflammation is correction of the underlying
disorder (Andrews, 1999).
The widespread presence of Fe-deficiency anaemia has
been reported from many developing countries (Hercberg
et al. 1987; DeMaeyer, 1989; Taylor et al. 1993). In fact,
anaemia has become synonymous with Fe deficiency and
Fe supplementation is the usual practice in therapy for all
anaemic patients in most developing countries irrespective
of the aetiology. However, anaemia of inflammation is
considered a major contributor to anaemia observed in
developing countries (Abshire, 1996) and anaemia of
inflammation may even be associated with asymptomatic
and sub-clinical infections (Das et al. 1997; van den
Broek & Letsky, 2000). While Fe supplementation is the
only therapy for Fe-deficiency anaemia, its efficacy in
anaemia of inflammation is questionable. Several studies
have indicated deleterious effects associated with Fe sup-
plementation in tubercular infection (Dhople et al. 1996;
Gomes et al. 1999; Lounis et al. 2001).
Pulmonary tuberculosis is a chronic infective disease
occurring predominantly in socio-economically deprived
populations. Therefore, both anaemia of inflammation as
well as Fe deficiency may coexist in pulmonary tuberculo-
sis. Both pulmonary tuberculosis and anaemia are widely
prevalent in and around Rourkela, Orissa, India. We have
conducted a prospective double-blind placebo-controlled
study to assess the effect of Fe therapy and supplemen-
tation with other haematinics in mild to moderately
anaemic pulmonary tuberculosis patients.
Materials and methods
Study site
Ispat General Hospital, Rourkela, in Sundergarh district of
Orissa State, India, where the study was conducted, is a
well-equipped modern hospital with 700 beds. It provides
free health-care facilities to the employees of the local
Steel Plant and Fertiliser Plant and their family members.
The Department of Tuberculosis and Chest Diseases in
the hospital has seventy-five beds, two-thirds of which
are earmarked for pulmonary tuberculosis patients. The
department is managed by qualified chest physicians,
with the support of medical officers and paramedical
staff. Pulmonary tuberculosis patients are usually hospital-
ised for a minimum period of 2 months to provide an inten-
sive phase of chemotherapy, and those showing uneventful
recovery are advised to continue a maintenance phase of
chemotherapy for another 4 months as outpatients.
During their hospital stay, all tuberculosis patients are rou-
tinely provided with protein-rich (120 – 130 g/d) nutritious
diets free of charge from the hospital kitchen. After dis-
charge from the hospital, they go back to their usual diet,
which consists mainly of rice or wheat-based preparations,
cooked vegetables and grams, and occasional non-vege-
tarian preparations.
Patients
Adult male pulmonary tuberculosis patients, 15–60 years of
age, consecutively admitted to the chest department from
August 1998 to March 2000 and with a blood haemoglobin
concentration of 80–110 g/l, were considered for the present
study. Only those patients who were entitled to free medical
care and residing in the Steel Township were included for
the convenience of the follow-up. Female patients were
excluded from the present study to avoid the interference
of menstruation, pregnancy and childbirth. Children (, 15
years of age) and the elderly (. 60 years of age) were
excluded to avoid the altered Fe metabolism. Critically ill
patients and patients with extensive or disseminated tubercu-
losis were excluded because of the uncertainty of the course
of the disease; patients with massive haemoptysis and severe
anaemia were excluded because of their requirement for
blood transfusion and Fe supplementation. Those with
associated chronic diseases, such as chronic renal failure,
chronic liver disease, haemoglobinopathy, neoplastic dis-
ease and collagen vascular disease, and those who could
not complete the initial 2 months of hospitalisation or who
expired before the completion of the supplementation
therapy were also excluded from the study. Malaria is a
common cause of anaemia in Sundergarh district, but none
of our patients had malaria parasites in their peripheral
blood. Malaria transmission in Rourkela Steel Township is
very low, because of the excellent urban infrastructure and
effective malaria control programmes.
Fifty healthy adult males, matched for age and socio-
economic status, were taken as controls. The average age
of the control group was 40·8 (
SD 16·8) years. They were
selected from those attending the hospital for a pre-
employment check-up or from the employees and their
dependants attending the hospital for a routine medical
check-up. Socio-economic matching was done based on
income per month (by seeing the payslip of the employee)
and the community they belonged to. All the employees
and their dependants are entitled to subsidised housing in
the township and free primary education and health-care
facilities. Blood samples were collected from them for
assessment of haematological and Fe status.
The study was approved by the hospital ethical commit-
tee of Ispat General Hospital. Only those who consented
orally to participate after explanation of the objectives
and protocol were included in the study.
Methods
Diagnosis of clinically suspected cases of pulmonary tuber-
culosis was confirmed either bacteriologically by detection
of acid-fast bacilli in the sputum and/or radiological exam-
ination. Radiological classification of chest lesions was
made following the guidelines of the National Tuberculosis
Association of the USA (1961). All the chest radiological
assessments were done by one of the chest physicians
(C. M. R.). Briefly, the lesions were classified as follows:
(1) minimal lesion (slight to moderate density involving
small part of one or both lungs, the total extent of which
should not exceed the volume of one-third of the lung on
one side and that do not contain demonstrable cavities);
(2) moderately advanced lesions (the lesions may be pre-
sent in one or both lungs: (i) disseminated lesions of
slight to moderate density, total involvement limited to
volume of one lung; (ii) dense and confluent lesions that
U. Devi et al.542
are limited to one-third of the volume of one lung; (iii)
total diameter of cavities if present must be , 40 mm);
(3) far advanced lesions (lesions more extensive than mod-
erately advanced lesions).
Pre-treatment assessment of BMI, haematological inves-
tigations such as blood haemoglobin and erythrocyte sedi-
mentation rate, biochemical tests for assessment of
glycaemic status and tests for liver and renal functions
were done in all patients to exclude diabetes mellitus,
chronic renal failure and hepatic dysfunction. These inves-
tigations were repeated in the first, second and sixth month
in all patients. Sputum examination was repeated every
2 weeks until three consecutive samples were reported to
be negative; chest X-ray was repeated at the end of the
intensive (2 months) and maintenance (6 months) phases.
This protocol of investigations is practised routinely in
all patients of pulmonary tuberculosis admitted to the
chest ward.
Blood haemoglobin concentration, total erythrocyte
count (TEC), packed cell volume (PCV) and mean corpus-
cular volume (MCV) were estimated in a blood cell counter
(Coulter T-660; Coulter Electronics, Luton, Beds., UK) and
mean corpuscular haemoglobin (MCH) was calculated from
the haemoglobin and TEC. Erythrocyte sedimentation rate
was estimated by the Western Green method. Plasma glu-
cose, serum urea, creatinine, bilirubin, alanine aminotrans-
ferase, alkaline phosphatase, total protein, albumin, Fe and
total Fe-binding capacity (TIBC) were estimated on an
Olympus AU-400 Autoanalyser (Olympus, Tokyo, Japan)
using commercial test kits from Randox Laboratories
(Crumlin, Antrim, UK). The CV for Fe and TIBC using
Randox Assayed Multisera Normal containing 23·8 mmol
Fe and 36·6 mmol TIBC/l were 2·8 and 4·7 % respectively
(n 20). Ferritin was estimated by an ELISA two-step sand-
wich assay using Boehringer Mannheim test kits (Boehrin-
ger Mannheim, Mannheim, Germany). The CV for ferritin
were 4·8 and 4·3 % at ferritin concentration of 28 and
467 mg/l respectively. Fe saturation of transferrin was calcu-
lated from serum Fe and TIBC and was expressed as % sat-
uration. For estimation of Fe, TIBC and ferritin, serum was
stored at 48C and analysed within 7 d of collection.
All patients in the study group were commenced on a
short course of chemotherapy consisting of four drugs
per d. The patients were hospitalised for the initial
2 months for administration of intensive supervised treat-
ment, consisting of oral ethambutol (800 mg), isoniazide
(300 mg), rifampicin (450 mg) and pyrazinamide
(1500 mg) once per d, 30 min before breakfast. After
2 months of intensive therapy, the patients were discharged
from hospital and were advised to continue maintenance-
phase chemotherapy with rifampicin (450 mg) and isoni-
azide (300 mg) once per d. All the drugs for the intensive
and maintenance phases were supplied from the hospital
stores free of charge.
Each patient in the study group was supplemented with
one capsule twice per d (for details, see later), before
breakfast (together with the anti-tubercular drugs) and
before dinner. Each capsule consisted of one of the follow-
ing three preparations: (1) placebo containing 75 mg
sucrose; (2) ferrous fumarate containing 75 mg elemental
Fe; (3) ferrous fumarate containing 75 mg elemental Fe
with other haematinics (zinc sulfate 25 mg,
L-histidine
hydrochloride 2 mg, lysine hydrochloride 12·5 mg, glycine
hydrochloride 5 mg, thiamin 2·5 mg, riboflavin 1·5 mg,
pyridoxine 0·75 mg, cyanocobalamin 1·25 mg, ascorbic
acid 20 mg, folic acid 0·25 mg) (placebo and Fe prep-
arations were provided courtesy of Tablets India Ltd,
Chenai, India). The capsules were of similar size and
colour. The dosage of Fe supplementation was kept rela-
tively low, because of the added gastrointestinal adverse
reactions to anti-tubercular drugs. Accordingly, the
groups were designated as group 1 (placebo group),
group 2 (Fe-supplemented group) and group 3 (Fe þ other
haematinics-supplemented group). The patients, treating
physicians and the laboratory were blinded regarding the
contents of the capsules. The supplements were distributed
sequentially according to the code number of the packets.
Symptoms of gastrointestinal upset, such as loss of appe-
tite, nausea, diarrhoea, constipation, flatulence, etc., were
recorded from each patient every day during the period
of intervention. After discharge from the hospital, sup-
plementation was stopped and the patients were advised
to take their usual diet.
Statistical analysis
Data on age, BMI, haematological indices and TIBC were
normally distributed and the significance of difference
between groups was assessed by ANOVA followed by a
Newman–Keul test to estimate the significance of differ-
ence between each pair of groups. Data on erythrocyte
sedimentation rate, Fe, Fe saturation of transferrin (%)
and ferritin were not normally distributed and non-para-
metric tests were used for statistical analysis. The signifi-
cance of difference between the groups was assessed by
the one-way repeated measurements ANOVA on ranks fol-
lowed by Scheffe post hoc pairwise comparison to test the
difference between two groups. Differences in the severity
of disease measured by chest X-ray were assessed using the
x
2
test.
Results
There were 131 patients fulfilling the recruitment criteria
admitted during the period of study and included in the
study. Two patients died in the hospital during the initial
2-month intensive phase of chemotherapy, one from the
placebo group due to massive haemoptysis and the other
from the Fe-supplemented group due to a cerebrovascular
accident. The remaining 129 patients, forty-three in each
group, completed 2 months of intensive anti-tubercular
chemotherapy and Fe-placebo supplementation. Of these,
forty from group 1, thirty-eight from group 2 and thirty-
nine from group 3 were available for follow-up until com-
pletion of the 6-month short course of chemotherapy.
Improvement in clinical profile, weight gain and radiologi-
cal clearance of the lung shadow was noticed in all patients
at the end of 6 months. Minor adverse drug reactions in the
form of decreased appetite and flatulence were noticed in
four patients in the Fe-supplemented group, in five in the
placebo group and in a further five in the Fe þ other hae-
matinics-supplemented group. The gastrointestinal upsets
Anaemia in pulmonary tuberculosis 543
were very mild and did not warrant any intervention or dis-
continuation of therapy. Moreover, anti-tubercular drugs
are also known to cause gastrointestinal upset; therefore,
it was not possible to ascertain whether an observed gastro-
intestinal upset was due to Fe supplementation or anti-
tubercular drugs. All the 129 patients had uneventful
recoveries.
Pre-treatment (baseline) comparison of age, BMI, eryth-
rocyte sedimentation rate and radiological severity of the
disease did not reveal significant difference between the
groups (Table 1). The age of the control subjects was simi-
lar to that of the patient groups. The BMI increased con-
sistently from the baseline in all three groups, but a
significant difference (P, 0·01) from the pre-treatment
value was noticed only at 6 months. The BMI of the
groups at 1, 2 and 6 months did not differ significantly.
The erythrocyte sedimentation rate decreased significantly
and sequentially from pre-treatment to the values at 1, 2
and 6 months (P, 0·001), but the decrease was similar in
all groups. There was consistent radiological improvement
from baseline to 2 and 6 months as indicated by a decrease
in the number of patients with an advanced lesion and an
increase in the number of patients with a normal chest
radiograph (P, 0·01). However, the improvement was
similar in all three groups (Table 1).
Baseline haematological indices such as blood haemo-
globin, TEC, PCV and Fe nutrition indices such as serum
Fe, Fe saturation of transferrin and TIBC were lower in
all three supplemented groups than in healthy controls
(P, 0·01) as expected, since we selected only anaemic
patients. However, MCV and MCH did not differ between
the patients and the controls, and serum ferritin was signifi-
cantly higher in patient groups than the controls (P, 0·01).
Of 129 patients who completed 2 months of intensive
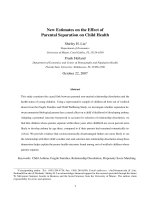
Table 1. Indicators of disease status in the placebo group (group 1), iron-supplemented group (group 2) and iron þ other haematinics-
supplemented group (group 3) at baseline and at 1 and 2 months, and 6 months of anti-tubercular therapy§
(Mean values and standard deviations)
Group 1 (n 40) Group 2 (n 38) Group 3 (n 39)
Indicators Mean
SD Mean SD Mean SD
Statistical significance
of effect (ANOVA, P)
Age 42·5 17·4 39·7 17·2 41·6 16·2 NS
BMI
Baseline 17·0 2·5 17·2 3·7 17·7 3·1 NS
1 month 17·9 2·5 18·7 2·9 18·6 3·0 NS
2 months 18·0 3·8 18·7 4·0 18·7 4·1 NS
6 months 19·9* 2·8 19·8* 3·0 20·2* 2·6 NS
Statistical significance of effect
(ANOVA, P)
, 0·01 , 0·01 , 0·01
ESRk
Baseline 86 2–130 83 12–145 80 8–144 NS{
1 month 47* 2–122 40* 3–123 35* 2–110 NS{
2 months 30*† 5–120 24*† 2–100 28*† 2–89 NS{
6 months 12*†‡ 2–40 10*†‡ 2–50 11*†‡ 2–36 NS{
Statistical significance of effect
(rank ANOVA, P)
, 0·001 , 0·001 , 0·001
Severity of disease based on X-ray of chest (n)
Baseline
Normal 0 0 0 NS**
Minimal lesion 12 14 16
Moderately advanced 17 15 15
Far advanced 14 14 12
2 months
Normal 4 5 6 NS**
Minimal 29 27 28
Moderately advanced 9 11 9
Far advanced 1 0 0
6 months
Normal 41 43 42 NS**
Minimal 2 0 1
Moderately advanced 0 0 0
Far advanced 0 0 0
Statistical significance of effect
(x
2
test, P)
, 0·01 , 0·01 , 0·01
ESR, erythrocyte sedimentation rate.
Mean or median values were significantly different from those at baseline: *P, 0·05.
Median values were significantly different from those at 1 month: †P, 0·05.
Median values were significantly different from those at 2 months: ‡P, 0·05.
§ For details of subjects and procedures, see p. 542.
k Median values and ranges.
{ Rank ANOVA.
** x
2
test.
U. Devi et al.544
chemotherapy, seventy-eight had microcytosis, ninety-two
had hypochromia and sixty-nine had both microcytosis
and hypochromia.
Baseline haematological indices did not differ signifi-
cantly between the three patient groups (Table 2). During
follow-up, haematological indices improved steadily and
sequentially in all groups, although the magnitude of
increase was different. The increase in blood haemoglobin
concentration from baseline to 1 month was significantly
higher in both Fe-supplemented groups (groups 2 and 3);
however, in the placebo group, although there was an
increase, it was not statistically significant. Thus, blood
haemoglobin concentration at 1 month was higher in
both the Fe-supplemented groups than in the placebo
group (P, 0·01). However, the increase in blood haemo-
globin from the first to the second month was not statisti-
cally significant in groups 2 and 3, but in group 1 the
increase was significant from values at baseline and at
1 month. The values at 6 months were significantly
higher than those at baseline and 1 month in groups 1 and
3, and from baseline values only in group 2 (Table 2).
Similarly, TEC and PCV increased significantly from the
baseline at 1 month in groups 2 and 3, but not in group
1, which showed significant increase from baseline only
at 2 months. At 6 months, while blood TEC showed signifi-
cant increase only from baseline values in all three groups,
blood PCV was significantly higher than values at baseline
and 1 month in groups 1 and 2, and from all the three pre-
vious values in group 3. The increases in MCV and MCH
were not statistically significant during the period of
follow-up, except for MCH values at 6 months in groups
1 and 2 (Table 2). Overall, there was a consistent increase
in haematological indices in all groups and the values at
different periods of follow-up were not statistically differ-
ent except for blood haemoglobin, PCV and MCV, which
were higher at 1 month in groups 2 and 3 in comparison
with group 1.
Fe nutrition status of the groups at baseline, 1, 2 and
6 months after treatment is shown in Table 3. The pre-
treatment serum Fe values were very low in all three
groups, and these increased sequentially and steadily
(P, 0·001). There was a significant increase from the
baseline values at 1 month in all three groups, and from
1 to 2 months in groups 1 and 3, but not in group 2.
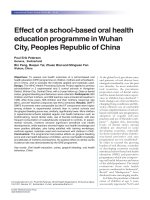
Table 2. Haematological indices in the placebo group (group 1), iron-supplemented group (group 2) and iron þ other haematinics-
supplemented group (group 3) at baseline and at 1 and 2 months after supplementation, and at 6 months of anti-tubercular therapyk
(Mean values and standard deviations)
Group 1 (n 40) Group 2 (n 38) Group 3 (n 39)
Haematological indices Mean
SD Mean SD Mean SD
Statistical significance
of effect (ANOVA, P)
Haemoglobin (g/l blood)
Baseline 95·2 11·9 95·8 10·1 93·8 11·8 NS
1 month 101·3 13·9 111·8*§ 14·4 109·9*§ 13·5 , 0·01
2 months 110·3*† 15·7 116·0* 13·6 116·1* 15·5 NS
6 months 117·4*† 17·0 119·4* 13·8 120·6*† 17·4 NS
Statistical significance of effect (ANOVA, P) , 0·001 , 0·001 , 0·001
TEC (cells/nl blood)
Baseline 3·84 0·48 3·83 0·43 3·77 0·63 NS
1 month 4·04 0·49 4·11* 0·48 4·15* 0·55 NS
2 months 4·24* 0·50 4·31* 0·47 4·34* 0·51 NS
6 months 4·24* 0·56 4·35* 0·34 4·47* 0·63 NS
Statistical significance of effect (ANOVA, P) , 0·002 , 0·001 , 0·001
PCV (%)
Baseline 29·4 3·6 29·8 3·3 29·4 3·6 NS
1 month 31·0 3·8 33·4*§ 4·4 34·0*§ 3·9 , 0·01
2 months 33·1* 5·3 34·3* 4·4 34·8* 4·0 NS
6 months 34·3*† 5·5 36·3*† 3·9 37·2*†‡ 4·9 NS
Statistical significance of effect (ANOVA, P) , 0·001 , 0·001 , 0·001
MCV (fl/erythrocyte)
Baseline 76·9 6·2 78·4 7·7 79·5 13·5 NS
1 month 76·9 7·6 81·6§ 9·6 82·6§ 10·8 , 0·05
2 months 78·3 10·2 80·1 10·1 81·0 10·3 NS
6 months 81·0 8·5 83·7 9·3 84·0 11·7 NS
Statistical significance of effect (ANOVA, P)NSNSNS
MCH (pg/erythrocyte)
Baseline 24·9 2·6 25·3 3·0 25·3 4·1 NS
1 month 25·2 2·9 27·4 3·7 26·8 3·9 NS
2 months 26·2 3·5 27·2 3·3 27·0 3·9 NS
6 months 27·4*† 3·7 27·6* 3·3 27·2 4·0 NS
Statistical significance of effect (ANOVA, P) , 0·02 , 0·02 NS
TEC, total erythrocyte count; PCV, packed cell volume; MCV, mean corpuscular volume; MCH, mean corpuscular haemoglobin.
Mean values were significantly different from those at baseline: *P, 0·05.
Mean values were significantly different from those at 1 month: †P, 0·05.
Mean value was significantly different from that at 2 months: ‡P, 0·05.
Mean values were significantly different from those of the placebo group: §P,0·05.
k For details of subjects and procedures, see p. 542.
Anaemia in pulmonary tuberculosis 545
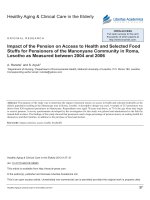
Table 3. Indicators of iron nutrition status in the placebo group (group 1), iron-supplemented group (group 2), and iron þ other haematinics-supplemented group (group 3) at baseline and at
1 and 2 months after supplementation, and at 6 months of anti-tubercular therapyk
(Median values and ranges)
Group 1 (n 40) Group 2 (n 38) Group 3 (n 39)
Indicators Mean Range Mean Range Mean Range Statistical significance of effect (ANOVA, P)
Serum Fe (mmol/l)
Baseline 5·3 2·0–14·1 5·9 1·8– 16·1 6·3 2·1–14·8 NS
1 month 7·9* 1·8–18·0 14·5*§ 6·1 –25·7 12·2*§ 5·5–26·2
ax
, 0·001
2 months 12·3*† 2·1–20·9 16·4*§ 9·3–26·9 15·5*†§ 9·3– 26·2 , 0·001
6 months 15·0*† 3·4–25·1 14·7* 8·9– 22·5 15·3*† 10·2 –25·7 NS
Statistical significance of effect (rank ANOVA, P) , 0·001 , 0·001 , 0·001
Fe saturation of transferrin (%)
Baseline 13·3 6·3 –49·4 14·2 5·1–37·1 13·4 5·9–38·0 NS
1 month 15·9* 8·0–49·7 26·4*§ 12·6–55·5 29·9*§ 14·6–48·8 ,0·001
2 months 21·3* 6·6 –52·7 28·6*§ 15·6–57·0 30·9*§ 18·6–59·6 ,0·001
6 months 23·7*† 9·1–36·3 22·5*‡ 17·3–38·3 22·4*‡ 12·9–30·3 NS
Statistical significance of effect (rank ANOVA, P) , 0·001 , 0·001 , 0·001
TIBC (mmol/l){
Baseline 40·4 9·4 44·4 8·4 41·7 8·5 NS
1 month 45·6 9·4 47·1 7·7 46·6 8·7 NS
2 months 51·8* 11·4 52·2* 10·2 52·4* 10·8 NS
6 months 63·2*†‡ 12·6 65·6*†‡ 7·7 66·6*†‡ 8·0 NS
Statistical significance of effect (ANOVA, P) , 0·001 , 0·001 , 0·001
Serum ferritin (mg/l)
Baseline 312 24–950 300 25–1085 265 25 –1125 NS
1 month 230* 30–775 217* 65 –877 217* 35 –800 NS
2 months 140*† 20–250 167*† 18–685 162*† 50–605 NS
6 months 59*† 20 –215 52*† 20–195 86*† 18–245 NS
Statistical significance of effect (rank ANOVA, P) , 0·001 , 0·001 , 0·001
TIBC, total Fe-binding capacity.
Mean or median values were significantly different from those at baseline: *P, 0·05.
Mean or median values were significantly different from those at 1 month: †P, 0·05.
Mean or median values were significantly different from those at 2 months: ‡P, 0·05.
Values were significantly different from those of the placebo group: §P, 0·05.
k For details of subjects and procedures, see p. 542.
{ Mean values and standard deviations.
U. Devi et al.546
The increase was significantly higher in both the Fe-sup-
plemented groups than in the placebo group, and this is
reflected in the significantly higher serum Fe concen-
trations at 1 and 2 months in Fe-supplemented groups
than the placebo group (P, 001). The increase continued
up to 6 months in the placebo group but not in the Fe-sup-
plemented groups. The difference in the serum Fe concen-
tration noticed between the Fe-supplemented groups and
the placebo group at 1 and 2 months disappeared at
6 months (Table 3).
Fe saturation of transferrin increased simultaneously
with the increase in serum Fe concentrations, and a statisti-
cally significant increase from the baseline value was
noticed at 1 and 2 months in all groups. However, the
increase continued up to 6 months only in the placebo
group, while the Fe-supplemented groups had significantly
lower Fe saturation of transferrin at 6 months compared
with values at 2 months. Similar to serum Fe, Fe saturation
of transferrin was significantly higher in Fe supplemented
groups than the placebo group at 1 and 2 months
(P, 0·001), but this effect disappeared at 6 months
(Table 3).
Pre-treatment TIBC values were low in all groups, and
these showed a steady and consistent increase during the
period of study. The increase was almost similar in all
the groups and unlike serum Fe and Fe saturation of trans-
ferrin, TIBC values at 1, 2 and 6 months were not signifi-
cantly different between the supplemented and placebo
groups (Table 3).
Baseline serum ferritin concentration was high in all three
groups. This decreased sequentially up to 6 months
(P, 0·001). Although the decrease continued up to
6 months, it was statistically significant only up to
2 months. The decrease was almost similar in all the three
groups, as indicated by an insignificant difference between
the different groups both at baseline and after supplemen-
tation. However, high ferritin values persisted even after
6 months of effective anti-tubercular therapy (Table 3).
After 2 months of supplementation, blood haemoglobin
concentration and PCV were still significantly lower than
that of matched controls, but TEC, MCV and MCH were
not significantly different. Among the Fe nutrition indices,
TIBC was significantly low and ferritin was significantly
high in all three supplemented groups in comparison with
control values. Serum Fe was higher in group 2 than in
the placebo group and in group 3 than in the control as
well as placebo groups. Fe saturation of transferrin was sig-
nificantly higher in groups 2 and 3 than both control and
placebo group (Table 4). These differences disappeared
at 6 months except for serum ferritin, which remained per-
sistently high in all the three groups in comparison with
control values (Table 4).
Discussion
Both Fe deficiency and anaemia of chronic inflammation
may coexist in patients with pulmonary tuberculosis,
especially in developing countries. Anaemia of chronic
inflammation has several features in common with
Fe-deficiency anaemia, thus confusing the aetiological
diagnosis. Raised erythrocyte volume distribution width,
a hallmark of Fe-deficiency anaemia, is also observed in
anaemic tuberculosis patients (Baynes et al. 1986b).
Other characteristic laboratory findings of Fe-deficiency
anaemia, such as low Fe and transferrin saturation in
blood and hypochromic and microcytic erythrocytes, are
all seen in anaemia of inflammation (Das et al. 1997,
1999). It is, therefore, difficult to establish the exact mech-
anism of associated anaemia in pulmonary tuberculosis
patients with the routine investigations undertaken for
diagnosis of anaemia.
In the present study, low MCV and MCH values were
observed in a significant proportion of patients. Although
it is quite reasonable to think that such widespread micro-
cytosis and hypochromia would not be expected in anae-
mia of inflammation alone, there is a growing body of
opinion that Fe deficiency is a far less important cause of
anaemia in developing countries than previously believed.
Both symptomatic and asymptomatic infections are con-
sidered to be major contributory factors to anaemia seen
in developing countries (Das et al. 1997). A recent study
conducted to analyse the mechanism of anaemia in preg-
nant women found that more than half of anaemic
women had markers of inflammation (Nynke et al. 2000).
The mechanisms causing low serum Fe and Fe saturation
of transferrin seen in our present patients could be due to
either Fe deficiency or anaemia of inflammation (Jurado,
1997), or both.
Transferrin and TIBC values are usually high in
Fe-deficiency anaemia and low in anaemia of inflammation
(Fleck & Myers, 1985; Punnonen et al. 1994). The low
TIBC concentrations seen in our present patients might
have been the result of an acute-phase response. Pre-
treatment serum ferritin concentration was high in all
three groups. Ferritin concentration in blood is considered
to be a specific indicator of body Fe stores (Lipschitz et al.
1974); however, the concentrations can rise following an
inflammatory response, irrespective of Fe status (Dallman
et al. 1981; Harju et al. 1984; Henderson, 1984; Fitzsimons
& Govostis, 1986; Taylor et al. 1993). Recent reports
indicate that ferritin synthesis is stimulated in pulmonary
tuberculosis as a consequence of the inflammatory process
(Wessels et al. 1999). Raised ferritin and low TIBC values
in the face of extensive microcytosis and hypochromia
seen in our present patients point more towards the
possibility of anaemia of inflammation, although associ-
ation of Fe-deficiency anaemia cannot be completely
ruled out.
The result of Fe supplementation in the present study
was a persistent and sequential increase in blood haemo-
globin, TEC and PCV in all groups. The increase in
blood haemoglobin, PCV and MCV was significantly
higher in the Fe-supplemented groups than in the placebo
group at 1 month. The differential increase may indicate
that there could be some degree of associated Fe
deficiency, which improved more rapidly on Fe sup-
plementation, or that Fe supplementation accelerated the
normal resumption of haematopoiesis in the initial phases
by increasing Fe saturation of transferrin. The difference
noticed between the placebo and Fe-supplemented groups
at 1 month disappeared at 2 months despite continuation
of Fe supplementation up to 2 months (Table 2)
Anaemia in pulmonary tuberculosis 547
Table 4. Haematological indices and markers of iron nutrition status in control and supplemented groups after 2 and 6 months‡
(Mean values and standard deviations)
Control group Group 1 (n 40) Group 2 (n 38) Group 3 (n 39)
Haematological and Fe nutrition indices Mean
SD Mean SD Mean SD Mean SD Statistical significance of effect (ANOVA, P)
Haemoglobin (g/l blood) 126·6 19·3
2 months 110·3* 15·7 116·0* 13·6 116·1* 15·5 , 0·05
6 months 117·4 17·0 119·4 13·8 120·6 17·4
TEC (cells/nl blood) 4·61 0·91
2 months 4·24 0·50 4·31 0·47 4·34 0·51 NS
6 months 4·24 0·56 4·35 0·34 4·47 0·63
PCV (%) 37·7 6·5
2 months 33·1* 5·3 34·3* 4·4 34·8* 4·0 , 0·05
6 months 34·3 5·5 36·3 3·9 37·2 4·9
MCV (fl/erythrocyte) 80·0 6·3
2 months 78·3 10·2 80·1 10·1 81·0 10·3 NS
6 months 81·0 8·5 83·7 9·3 84·0 11·7
MCH (pg/erythrocyte) 26·9 3·2
2 months 26·2 3·5 27·2 3·3 27·0 3·9 NS
6 months 27·4 3·7 27·6 3·3 27·2 4·0
Fe (mmol/l) 13·3 5·2
2 months 11·6 4·9 14·7† 4·3 16·1*† 4·5 , 0·05
6 months 14·9 6·0 15·0 3·6 16·2 3·9
TIBC (mmol/l) 69·0 12·4
2 months 51·8* 11·4 52·2* 10·2 52·4* 10·8 , 0·01
6 months 63·2 12·6 65·6 7·7 66·6 8·0
Fe saturation of transferrin (%) 23·3 4·6
2 months 22·1 9·1 32·9*† 10·2 32·1*† 12·7 , 0·01
6 months 23·0 7·5 23·1 6·2 24·5 6·0
Serum ferritin (mg/l)§ 27 5–67
2 months 140* 20–250 167* 18–685 162* 50–605 ,0·01
6 months 59* 20–215 52* 20– 195 56* 18–245
TEC, total erythrocyte count; PCV, packed cell volume; MCV, mean corpuscular volume; MCH, mean cell haemoglobin; TIBC, total Fe-binding capacity.
Mean or median values were significantly different from those of the control group: *P, 0·05.
Mean values were significantly different from those of group 1 at the same time point: †P, 0·05.
‡ For details of subjects and procedures, see p. 542.
§ Median values and ranges.
U. Devi et al.548
and persistence of anaemia (Table 4). After initial faster
improvement in haematological indices in the Fe-sup-
plemented groups, the increase slowed, possibly because
inflammation contributed significantly towards anaemia
and further improvement was dependent more on the cor-
rection of the inflammatory process and not Fe
supplementation.
It is believed that in anaemia of inflammation, Fe depos-
ited in the monocyte – macrophage system is not mobilised
enough for adequate transferrin saturation. Macrophage Fe
becomes available for erythropoiesis through two mobilis-
ation pathways: a rapid pathway associated with immediate
return of Fe retrieved from senescent erythrocytes and a
slower pathway consisting of Fe mobilised from storage
sites. In the anaemia of chronic disorders, the slower
pathway may predominate (Robert & Means, 1999).
Non-availability of Fe for erythropoiesis is partly
responsible for inadequate marrow response, leading to
microcytosis and hypochromia (Abshire, 1996). However,
ferrokinetic studies have yielded conflicting results: while
erythroid-Fe turnover correlated with serum Fe level in
one study (Douglas & Adamson, 1975), indicating that
the marrow proliferation was limited by non-availability
of Fe, another found no correlation (Cavill & Bentley,
1982). Based on the presumption that hypoferraemia was
the main cause of anaemia of inflammation, intravenous
Fe supplementation was tested (Bentley & Williams,
1982). Although some improvement was noticed,
acceptance of the therapeutic regimen was poor, because
the adverse reactions to the intravenous route of
supplementation far exceeded the low likelihood of
benefit. It has been reported that oral Fe-replacement
therapy in the anaemia of chronic disease gives benefit
only if concurrent Fe deficiency exists and corrects
that component of anaemia caused by Fe deficiency
(Baer et al. 1990).
There was a significant improvement in serum Fe, TIBC
and Fe saturation of transferrin in all three groups. It
appears that TIBC returned towards normal with the
decrease in the acute-phase response during the recovery
from the disease process. The increase in TIBC was similar
in the Fe-supplemented and placebo groups. Thus, increase
in TIBC values appeared to be dependent on recovery from
the inflammatory process and independent of Fe sup-
plementation. Serum Fe and Fe saturation of transferrin
were higher in the supplemented groups than in the placebo
group during the period of supplementation (P, 0·001).
After withdrawal of Fe supplementation, Fe saturation of
transferrin decreased in the supplemented groups and
values at 6 months were lower than those at 2 months,
while in the placebo group there was an increase at
6 months from the 2 months value (Table 3).
We next wanted to examine if Fe supplementation in
pulmonary tuberculosis is harmful. Fe functions as a co-
enzyme for several important enzymes, particularly those
involved in electron transport. Hence, it is essential for sur-
vival of most living organisms. During infection, the
human host withholds Fe as a defence mechanism against
micro-organisms, depriving them of this critical nutrient
(Bullen et al. 1978; Weinberg, 1978). Fe supplementation
resulted in increased bacterial load in liver, spleen and
lungs in mice inoculated with Mycobacterium avium
(Dhople et al. 1996). Fe loading also significantly
enhanced growth of a virulent strain of M. tuberculosis
in the spleen and lungs of female Balb/C mice. It was con-
cluded that an excess of Fe might enhance the growth of
M. tuberculosis and worsen the outcome of human tubercu-
losis (Lounis et al. 2001). An Fe-poor diet led to reduced
M. avium proliferation in mice and Fe-chelating
compounds were suggested as useful adjunct therapy
(Gomes et al. 1999). However, we did not notice any
difference in the clinical and radiological improvement
between the Fe-supplemented groups and placebo group
(Table 1). Gastrointestinal upset was noticed in four
patients in the Fe-supplemented group, in five in the Fe þ
other haematinics-supplemented group and in five in the
placebo group. However, the symptoms were mild and
did not warrant discontinuation of supplementation. Like
most bacteria, M. tuberculosis is able to acquire Fe from
the host for its survival. Mycobacteria respond to Fe star-
vation by inducing the synthesis and secretion of sidero-
phores, which solubilise Fe and allow it to be transported
across the cell envelope via specific receptors (Gobin
et al. 1995). Simultaneously, all mycobacteria also contain
an Fe-dependent regulator, which negatively regulates
siderophore production under Fe-sufficient conditions
(Dussurget et al. 1996; Rodriguez et al. 1999). Therefore,
it is possible that M. tuberculosis possesses regulatory
mechanisms for Fe extraction from the host to take care
of fluctuations in in vivo Fe content. Thus, Fe supplemen-
tation to correct anaemia in pulmonary tuberculosis
may not influence growth and multiplication of mycobac-
teria significantly and hence severity of the disease process.
Pulmonary tuberculosis patients in our hospital are
routinely provided with a high-energy, protein-rich diet
during their hospital stay; the patients in the present
study also received this diet. We have no knowledge of
the Fe content of these diets and their contribution to
correction of anaemia. A very large proportion of tubercu-
losis patients does not have access to such good diets and
therefore, results of the present study cannot be
extrapolated to all tuberculosis patients. The contribution
of a protein-rich nutritious diet in correcting anaemia of
tuberculosis, and the influence of Fe supplementation in
correcting anaemia in patients receiving their natural
diets, needs to be evaluated.
In conclusion, inflammation appears to be a major
contributor to anaemia associated with pulmonary
tuberculosis. Fe and other haematinic supplements can
initiate an initial improvement in some haematological
indices, but ultimate recovery from anaemia occurs only
with recovery from the pulmonary tuberculosis.
Acknowledgements
The authors acknowledge the Director, Medical and Health
Services, Ispat General Hospital for permission to conduct
the study. We also thank Drs G. Tripathy, S. Rath, R. Rath,
G. Behera and B. Biswas, Department of Respiratory
Medicine, Ispat General Hospital, Rourkela, for their
cooperation.
Anaemia in pulmonary tuberculosis 549
References
Abshire TC (1996) The anaemia of inflammation: a common
cause of childhood anaemia. Pediatr Clinics North America
43, 623 –638.
Andrews NC (1999) Disorders of iron metabolism. New Eng
J Med 341, 1986 –1995.
Baynes RD, Flax H, Bothwell TH, et al. (1986a) Haematological
and iron related measurements in active pulmonary tuberculo-
sis. Scand J Haematol 36, 280–287.
Baynes RD, Flax H, Bothwell TH, Bezwoda WR, Atkinson P &
Mendelow B (1986b) Red blood cell distribution width in the
anaemia secondary to tuberculosis. Am J Clin Pathol 85,
226–229.
Baer AN, Dessypris EN & Krantz SB (1990) The pathogenesis of
anaemia in rheumatoid arthritis, a clinical and laboratory
analysis. Semin Arthritis Rheum 14, 209–223.
Bentley DP & Williams P (1982) Parenteral iron therapy in
the anaemia of rheumatoid arthritis. Rheumatol Rehabil 21,
88–92.
Bullen JJ, Rogers HJ & Griffiths E (1978) Role of iron in
bacterial infection. Curr Top Microbiol Immunol 80, 1–35.
Cavill I & Bentley DP (1982) Erythropoiesis in the anaemia of
rheumatoid arthritis. Br J Haematol 50, 583 – 590.
Dallman PR, Reeves JD, Driggers DA & Lo EYT (1981)
Diagnosis of iron deficiency: the limitations of laboratory
tests in predicting response to iron treatment in 1-year-old
infants. J Pediatr 98, 376–381.
Das BS, Nanda NK, Rath PK, Satapathy RN & Das DB
(1999) Anaemia in acute, Plasmodium falciparum malaria in
children from Orissa state, India. Ann Trop Med Parasitol 93,
109–118.
Das BS, Thurnham DI & Das DB (1997) Influence of malaria on
markers of iron status in children: implications for interpreting
iron status in malaria-endemic communities. Br J Nutr 78,
751–760.
DeMaeyer EM (1989) Preventing and Controlling Iron
Deficiency Anaemia through Primary Health Care: A Guide
for Health Administrators and Programme Managers.
Geneva: WHO.
Dhople AM, Ibanez MA & Poirier TC (1996) Role of iron in the
pathogenesis of Mycobacterium avium infection in mice.
Microbiology 87, 77–87.
Douglas SW & Adamson JW (1975) The anaemia of chronic
disorders: Studies of marrow regulation and iron metabolism.
Blood 45, 55–65.
Dussurget O, Rodriguez GM & Smith I (1996) An ideR mutant
of Mycobacterium smegmatis has a depressed siderophore
production and an altered oxidative stress response. Mol
Microbiol 22, 535–544.
Ebrahim O, Folb PI, Robson SC & Jacobs P (1995) Blunted
erythropoietin response to anaemia in tuberculosis. Eur
J Haematol 55, 251–254.
Fitzsimons E & Govostis M (1986) Changes in serum iron and
ferritin concentrations associated with surgery. Clin Chem 32,
201.
Fleck A & Myers MA (1985) Diagnostic and prognostic signifi-
cance of acute phase proteins. In The Acute Phase Response to
Injury and Infection, pp. 249–271 [AH Gordon and A Koj,
editors]. Amsterdam: Elsevier Science Publishers.
Gobin J, Moore CH, Reeve JR, Wong DK, Gibson BW &
Horwitz MA (1995) Iron acquisition by Mycobacterium
tuberculosis: Isolation and characterization of a family of
iron-binding exochelins. Proc Natl Acad Sci USA 92,
5189–5193.
Goldenberg AS (1996) Haematological abnormalities and
mycobacterial infections. In Tuberculosis, pp. 645 –652
[WN Rome and S Garay, editors]. Boston, MA: Little Brown
and Company.
Gomes MS, Dom G, Pedrosa J, Boelaert JR & Appelberg R
(1999) Effect of iron deprivation on Mycobacterium avium
growth. Tuber Lung Dis 79, 321–328.
Harju E, Pakarinen A & Larmi T (1984) A comparison between
serum ferritin concentration and the amount of bone marrow
stainable iron. Scand J Clin Lab Invest 44, 555 –556.
Henderson A (1984) Ferritin levels in patients with microcytic
anaemia complicating pulmonary tuberculosis. Tubercle 65,
185–189.
Hercberg S, Galan P & Dupin H (1987) Iron deficiency in Africa.
World Review Nut Diet 54, 201 –236.
Jurado RI (1997) Iron, infection, and anaemia of inflammation.
Clin Infect Dis 25, 888–895.
Lipschitz DA, Cook JD & Finch CA (1974) A clinical evaluation
of serum ferritin as an index of iron status. New Eng J Med
290, 1213 –1216.
Lombard EH & Mansvelt EP (1993) Haematological changes
associated with milliary tuberculosis of bone marrow. Tuber
Lung Dis 74, 131 –135.
Lounis N, Truffot-Pernot C, Grosset J, Gordeuk VR & Boelaert JR
(2001) Iron and mycobacterium tuberculosis infection. J Clin
Virol 20, 123–126.
National Tuberculosis Association of USA (1961) Diagnostic
Standards and Classification of Tuberculosis. New York:
National Tuberculosis Association.
Punnonen K, Irjala K & Rajamaki A (1994) Iron deficiency
anaemia is associated with high concentrations of transferrin
receptor in serum. Clin Chem 40, 774– 776.
Rafael LJ (1997) Iron, infection and anaemia of inflammation.
Clin Infect Dis 25, 888–895.
Robert T & Means JR (1999) The Anaemia of Chronic Disorders.
In Wintrobe’s Clinical Haematology, pp. 979 –1010 [R Lee and
J Foerster, editors]. Baltimore, OH: Willams and Wilkins.
Rodriguez GM, Gold B, Gomez M, Dussurget O & Smith I
(1999) Identification and characterization of two divergently
transcribed iron regulated genes. Tuber Lung Dis 79,
287–298.
Taylor PG, Martinez-Torres C & Mendez-Castellano H, et al.
(1993) The relationship between iron deficiency and anaemia
in Venezuelan children. Am J Clin Nutr 58, 215 –218.
van den Broek NR & Letsky EA (2000) Etiology of anaemia in
pregnancy in south Malawi. Am J Clin Nutr 72, Suppl.,
47s–56s.
Weinberg E (1978) Iron and infection. Microbiol Rev 42,
45–66.
Wessels G, Schaaf HS, Beyers N, Gie RP, Nel E & Donald PR
(1999) Haematological abnormalities in children with
tuberculosis. J Trop Pediatr 45, 307–310.
U. Devi et al.550