Interferon-c Release Assays for Active Pulmonary Tuberculosis Diagnosis in Adults in Low- and Middle-Income Countries: Systematic Review and Meta-analysis pdf
Bạn đang xem bản rút gọn của tài liệu. Xem và tải ngay bản đầy đủ của tài liệu tại đây (511.25 KB, 10 trang )
SUPPLEMENT ARTICLE
Interferon-c Release Assays for Active Pulmonary
Tuberculosis Diagnosis in Adults in Low- and
Middle-Income Countries: Systematic Review
and Meta-analysis
John Z. Metcalfe,
1,2
Charles K. Everett,
1
Karen R. Steingart,
2
Adithya Cattamanchi,
1,2
Laurence Huang,
1,3
Philip C. Hopewell,
1,2
and Madhukar Pai
4
1
Division of Pulmonary and Critical Care Medicine, San Francisco General Hospital,
2
Department of Health Services, University of Washington School of
Public Health, Seattle,
3
HIV/AIDS Division, San Francisco General Hospital, University of California; and
4
Department of Epidemiology, Biostatistics and
Occupational Health, McGill University, Montreal, Canada
Background. The diagnostic value of interferon-c release assays (IGRAs) for active tuberculosis in low- and
middle-income countries is unclear.
Methods. We searched multiple databases for studies published through May 2010 that evaluated the diagnostic
performance of QuantiFERON-TB Gold In-Tube (QFT-GIT) and T-SPOT.TB (T-SPOT) among adults with
suspected active pulmonary tuberculosis or patients with confirmed cases in low- and middle-income countries. We
summarized test performance characteristics with use of forest plots, hierarchical summary receiver operating
characteristic (HSROC) curves, and bivariate random effects models.
Results. Our search identified 789 citations, of which 27 observational studies (17 QFT-GIT and 10 T-SPOT)
evaluating 590 human immunodeficiency virus (HIV)–uninfected and 844 HIV-infected individuals met inclusion
criteria. Among HIV-infected patients, HSROC/bivariate pooled sensitivity estimates (highest quality data) were
76% (95% confidence interval [CI], 45%–92%) for T-SPOT and 60% (95% CI, 34%–82%) for QFT-GIT. HSROC/
bivariate pooled specificity estimates were low for both IGRA platforms among all participants (T-SPOT, 61% [95%
CI, 40%–79%]; QFT-GIT, 52% [95% CI, 41%–62%]) and among HIV-infected persons (T-SPOT, 52% [95% CI,
40%–63%]; QFT-GIT, 50% [95% CI, 35%–65%]). There was no consistent evidence that either IGRA was more
sensitive than the tuberculin skin test for active tuberculosis diagnosis.
Conclusions. In low- and middle-income countries, neither the tuberculin skin test nor IGRAs have value for
active tuberculosis diagnosis in adults, especially in the context of HIV coinfection.
Interferon-c release assays (IGRAs) are the first new
diagnostic test for latent tuberculosis (LTBI) in .100
years. Newest generation IGRAs measure interferon
(IFN)–c secretion after exposure of whole blood
(QuantiFERON-TB Gold In-Tube [QFT-GIT], Celles-
tis) or peripheral blood mononuclear cells (T-SPOT.TB
[T-SPOT], Oxford Immunotec) to antigens encoded in
the region of difference–1 (RD1), a portion of the
Mycobacterium tuberculosis genome absent among all
bacille Calmette-Gue
´
rin (BCG) strains and most non-
tuberculous mycobacteria [1]. We have shown in
previous systematic reviews that compared with the
tuberculin skin test (TST), IGRAs have higher specificity
for LTBI in settings with low tuberculosis incidence,
better correlation with surrogate measures of M. tuber-
culosis exposure, and less cross-reactivity with the BCG
vaccine [2–4]. Thus, in recent years, IGRAs have become
widely endorsed in high-income countries for diagnosis
of LTBI [5–7].
However, IGRAs were explicitly designed to replace
the TST in diagnosis of LTBI and were not intended for
active tuberculosis, which is a microbiological diagnosis.
Furthermore, diagnosis and treatment of LTBI remains
Correspondence: Madhukar Pai, MD, PhD, Department of Epidemiology and
Biostatistics, McGill University, 1020 Pine Ave West, Montreal, QC H3A 1A2,
Canada ().
The Journal of Infectious Diseases 2011;204:S1120–29
Ó The Author 2011. Published by Oxford University Press on behalf of the Infectious
Diseases Society of America. All rights reserved. For Permissions, please e-mail:
0022-1899 (print)/1537-6613 (online)/2011/204S4-0004$14.00
DOI: 10.1093/infdis/jir410
S1120
d
JID 2011:204 (Suppl 4)
d
Metcalfe et al
at McGill University Libraries on October 13, 2011jid.oxfordjournals.orgDownloaded from
limited in scope in most low- and middle-income countries,
where detection and management of active tuberculosis is of
highest priority for national tuberculosis programs. Because
IGRAs, like the TST, cannot distinguish LTBI from active tu-
berculosis [8–10], these tests can be expected to have poor
specificity for active tuberculosis in all high-burden settings
because of a high background prevalence of LTBI [11]. Addi-
tional differences in patient spectrum, such as anergy due to
advanced disease, malnutrition, and human immunodeficiency
virus (HIV)–associated immune suppression, or characteristics
of the setting, such as laboratory procedures and infrastructure,
may also contribute to a lower performance of IGRAs observed in
these s ettings [12]. Ho wever, private sector laboratories in high-
burden countries increasingly use IGRAs for active tuberculosis
diagnosis [13], and many investigators continue to recommend
the use of IGRAs for a ctive t uberculosis diagnosis [ 14–17].
Because of unclear benefits and potential costs to patients and
national tuberculosis programs, we conducted a systemic review
and meta-analysis to determine IGRA test performance in per-
sons with suspected or confirmed active pulmonary tuberculosis
living in low- and middle-income settings.
METHODS
Overview
Because of the absence of studies evaluating patient-important
outcomes in persons with suspected tuberculosis who were
randomized to treatment on the basis of IGRA results, we fo-
cused our review on the diagnostic accuracy of IGRAs for active
tuberculosis. We observed standard guidelines and methods for
systematic reviews and meta-analyses of diagnostic tests [18–21].
Search Methods
We previously published systematic and narrative reviews on the
accuracy and performance of IGRAs in various subgroups [2–4,
10, 12]. We updated the previous literature searches to identify
all studies evaluating IGRAs published through May 2010. We
searched PubMed, Embase, Biosis, and Web of Science for studies
in all languages. The search terms used included ‘‘interferon-
gamma release assay,’’ ‘‘T cell–based assay,’’ ‘‘antigen-specific
T cell,’’ ‘‘T cell response,’’ ‘‘T-cell response,’’ ‘‘interferon,’’
‘‘interferon-gamma,’’ ‘‘gamma-interferon,’’ ‘‘IFN,’’ ‘‘elispot,’’
‘‘ESAT-6,’’ ‘‘CFP-10,’’ ‘‘culture filtrate protein,’’ ‘‘enzyme-linked
immunosorbent spot,’’ ‘‘Quantiferon,’’ ‘‘Quantiferon-TB,’’ ‘‘tu-
berculosis,’’ and ‘‘Mycobacterium tuberculosis.’’ In addition to
database searches, we reviewed bibliographies of reviews and
guidelines, screened citations of all included studies, searched
clinicaltrials.gov for ongoing studies, and contacted both ex-
perts in the field and IGRA manufacturers to identify addi-
tional published and unpublished studies. We requested
pertinent information not reported in the original publication
from the primary authors of all studies included in the review.
Study Selection and Data Collection
We included studies that evaluated the performance of the most
recent generation of commercial, RD1 antigen-based IGRAs
(QFT-GIT and T-SPOT) among adults (age $15 years) with
suspected active pulmonary tuberculosis or confirmed tuber-
culosis in low- and middle-income countries [22]; the World
Bank Country Classification was considered as a surrogate for
national tuberculosis incidence. HIV infection was established
either by documented serological testing or self-report. We
excluded (1) studies that evaluated noncommercial (in-house)
IGRAs, purified protein derivative–based IGRAs, QuantiFERON-
TB Gold (2G), and IGRAs performed using specimens other
than blood; (2) longitudinal data focused on the effect of anti-
tuberculosis treatment on IGRA response; (3) studies including
,10 eligible individuals; (4) studies focused on extrapulmonary
tuberculosis or children (age ,15 years); (5) studies reporting
insufficient data to determine diagnostic accuracy measures;
and (6) conference abstracts, letters without original data, and
reviews.
At least 2 reviewers (J. Z. M., C. K. E., K. R. S., or A. C.)
independently screened the accumulated citations for relevance,
reviewed full-text articles using the prespecified eligibility cri-
teria, and extracted data with use of a standardized form. The
reviewers resolved disagreements about study selection and data
extraction by consensus.
Assessment of Study Quality
Because primary outcomes for this systematic review focus on
test accuracy, we evaluated study quality with use of a subset of
relevant criteria from the Quality Assessment of Diagnostic
Accuracy Studies (QUADAS) tool, a validated tool for diagnostic
accuracy studies [23]. Because of growing concerns about con-
flicts of interest in diagnostic studies and guidelines [24, 25], we
also reported whether IGRA manufacturers had any involvement
with the design or conduct of each study, including donation of
materials, monetary support, work and/or financial relationships
with study authors, and participation in data analysis.
Outcome Definitions
Well-designed diagnostic accuracy studies focus on a represen-
tative target population in whom genuine diagnostic uncertainty
exists (ie, patients for whom clinicians would apply the test in
the course of regular clinical practice) [26]. There is evidence
that diagnostic studies that include only known patients with the
condition of interest and healthy control subjects without this
condition tend to overestimate test accuracy [27]. Therefore, we
considered studies simultaneously evaluating IGRA sensitivity
and specificity among persons with suspected active tuberculosis
to represent the highest quality evidence, whereas studies eval-
uating IGRA performance among patients with known active
tuberculosis (for sensitivity) were considered to be of lesser
quality. Because of our focus on active tuberculosis diagnostic
accuracy and the high prevalence of LTBI in settings with a high
IGRAs for Active Tuberculosis
d
JID 2011:204 (Suppl 4)
d
S1121
at McGill University Libraries on October 13, 2011jid.oxfordjournals.orgDownloaded from
tuberculosis burden, IGRA specificity was estimated exclusively
among studies enrolling persons with suspected active tuber-
culosis for whom the diagnostic examination ultimately showed
no evidence of active disease.
A hierarchy of reference standards for active tuberculosis was
developed a priori to judge the quality of each individual as-
sessment of IGRA diagnostic accuracy. From most to least
favorable, these reference standards included (1) culture con-
firmation or sputum smear positivity in settings with high tu-
berculosis incidence ($50 cases/100 000 population), where
sputum smear microscopy has been shown to have high
specificity [28]; (2) sputum smear positivity without culture
confirmation in settings with low or interm ediate tuberculosis
incidence (,50 cases/100 000 population); and (3) clinical
diagnosis based on presen ting symptoms, radiologic find-
ings, and/or response to tuberculosis treatment without
microbiological confirmation. Beca use the TST remains in
widespread u se and indeterminate IGRA results may affect
assay performance in low-income settings, we also evaluated
(1) observed differences in sensitivity for active tuberculosis
diagnosis between IGRA and TST, and (2) the proportion of
IGRA results among patients with active disease that were
indeterminate.
We used the following definitions for primary outcomes:
(1) sensitivity was defined as the proportion of individuals with
a positive IGRA result among those with culture-positive tu-
berculosis (we included indeterminate IGRA results in the de-
nominator if they occurred in individuals with culture-positive
tuberculosis), and (2) specificity was defined as the proportion
of individuals with a negative IGRA result among those who had
active tuberculosis disease ruled out (indeterminate IGRA re-
sults were excluded from analysis). With use of the Grading of
Recommendations Assessment, Development and Evaluation
framework [26], these measures can be interpreted as surrogates
for patient-important outcomes.
Data Synthesis and Meta-Analysis
Multiple sources of heterogeneity frequently exist when sum-
marizing estimates from studies of diagnostic tests [29]. We
adopted the following approach to account for expected het-
erogeneity. First, when possible, we separately synthesized data
for each commercial IGRA and by HIV status. The prespecified
subgroups minimize h eterogeneity related to d ifferences in testing
platform (enzyme-linked immun osorbent assay vs enzyme-linked
immunospot assay), antigens used to elicit IFN-c release (ESAT-
6/CFP-10 vs ESAT-6/CFP-10/TB 7.7), and test performance
related to HIV-associated host immunosuppression. Second,
we visually assessed heterogeneity with use of forest plots,
characterized the variation in study results attributable to
heterogeneity (I-squared value), and statistically tested for
heterogeneity (v
2
test) [29]. Third, we calculated pooled sen-
sitivity and specificity estimates with use of random effects
modeling, which provides more conservative estimates than
does fixed effects modeling when heterogeneity is a concern
[19, 30].
For each individual study, we assessed all outcomes for
which data were available. First, we generated forest plots to
display the individual study estimates and their 95% confidence
intervals (CIs). Second, we used bivariate random effects re-
gression models [31] when both sensitivity and specificity could
be reported from the same p opulation of tuberculosis s uspects.
Because pooling sensitivity and specificity separately can produce
biased estimates of test accuracy [19], we preferred to generate
pooled estimates when both sensitivity and specificity were re-
ported in a study and ranked this as higher-quality evidence.
Third, we generated hierarchical summary receiver operating
characteristic (HSROC) c urves t o summarize the global t est p er-
formance [30]. Because of the need to summarize 2 correlated
measures (eg, sensitivity and specificity) and because substantial
between-study heterogeneity is common, meta-analysis of di-
agnostic accuracy requires different and more complex methods
than do traditional meta-analytic techniques. Graphically illus-
trating the trade-off between sensitivity and specificity, HSROC
curves differ from traditional ROC curves in allowing accuracy
to vary by each individual study (ie, allowing for random effects
and, thus, asymmetry in the plotted curve) and by discouraging
extrapolation beyond the available data by plotting the curve
only over the observed range of test characteristics. The HSROC
approach is closely related to the bivariate random effects re-
gression model [32]. These 2 methods generally produce similar
results and are both recommended by the Cochrane Diagnostic
Test Accuracy Working Methods group [20]. We calculated
pooled estimates when at least 4 studies were available in
any subgroup and summarized individual study results when
,4 studies were available. We performed all analyses with use
of Stata, version 11 (StataCorp). For bivari ate random effects
regression and HSROC analyses, we used t he user-written
‘‘metandi’’ program for Stata [31].
RESULTS
Search Results
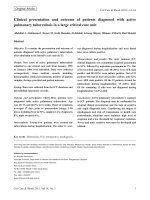
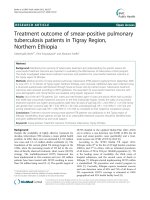
The initial search yielded 789 citations (Figure 1). After full-text
review of 168 articles, 19 [15, 17, 33–49]weredeterminedto
meet eligibility criteria for IGRA evaluation of active tubercu-
losis in low- and middle-income settings. Because some articles
included .1 commercial IGRA, there were 27 unique evalua-
tions (referred to as studies; 17 of QFT-GIT and 10 of T-SPOT)
that included a total of 590 HIV-uninfected and 844 HIV-
infected individuals.
Study Characteristics
Of the total studies, 7 (26%) were from low-income countries
and 20 (74%) were from middle-income countries. Fourteen
S1122
d
JID 2011:204 (Suppl 4)
d
Metcalfe et al
at McGill University Libraries on October 13, 2011jid.oxfordjournals.orgDownloaded from
studies (52%) included HIV-infected individuals, and 21(78%)
studies included ambulatory patients (Table 1). IGRAs were
performed for persons suspected of having active tuberculosis in
14 studies (52%) [34, 36–38, 40, 41, 46, 47, 49] and in persons
with known active tuberculosis in 13 studies (48%) [15, 17, 33,
35, 39, 42–45, 48]. A list of excluded studies and reasons for
exclusion is available from the authors on request.
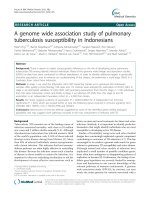
Study Quality
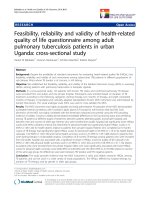
The majority of studies satisfied the QUADAS criteria assessed
(Figure 2), with the exception of patient spectrum (biased
sampling) and blinding. Sixteen studies (59%) did not enroll
a representative spectrum of patients, and 9 (33%) did not
clearly report whether assessment of the reference standard
was performed with blinding to IGRA results. Industry in-
volvement was unknown in 5 studies (19%) and acknowledged
in 8 (30%), including donation of IGRA kits (6 studies) and
work and/or financial relationships between authors and IGRA
manufacturers (2 studies).
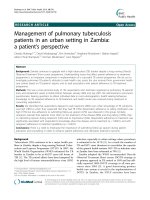
Sensitivity and Specificity Estimation Among Persons With
Suspected Tuberculosis
We identified a total of 14 studies that simultaneously estimated
sensitivity and specificity among persons with suspected tuber-
culosis, and test accuracy estimates were pooled using bivariate
random effects and/or HSROC methods (these studies were
ranked as high-quality evidence). Overall, studies enrolling
persons with suspected active tuberculosis revealed a sensitivity
of 83% (95% CI, 63%–94%) and specificity of 61% (95% CI,
40%–79%) for T-SPOT (6 studies) and a sensitivity of 69%
(95% CI, 52%–83%) and specificity of 52% (95% CI,
41%–63%) for QFT-GIT (8 studies).
Sensitivity
With the exception of 2 studies [36, 47], the sensitivity of IGRAs
was assessed on the basis of a positive culture result (21 studies
[78%]) or a positive sputum acid-fast bacilli smear result in a
setting with high tuberculosis incidence (4 studies [15%]).
Among studies performed in patients with known active
tuberculosis, 6 (46%) included patients who had been treated
for .1week.
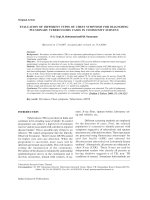
HIV-Infected Persons. Nine studies assessed IGRA sensi-
tivity among HIV-infected persons with suspected active tu-
berculosis. HSROC and/or bivariate pooled sensitivity estimates
were higher for T-SPOT (76%; 95% CI, 45%–92%; 4 studies
[34, 37, 40, 41]) than for QFT-GIT (60%; 95% CI, 34%–82%;
5 studies [37, 38, 40, 41, 49]) (Figure 3). Pooled sensitivity
estimates did not change appreciably for either T-SPOT (68%;
95% CI, 56%–80%; 5 studies [15, 34, 40–42]) or QFT-GIT
(65%; 95% CI, 52%–77%; 7 studies [33, 38, 40, 41, 48, 49])
when studies evaluating patients with known active tuberculosis
were included in the analysis (Figure 4). Pooled sensitivity
estimates for both T-SPOT (I-squared, 72%; P , .01) and
QFT-GIT (I-squared, 76%; P , .001) showed significant
heterogeneity.
HIV-Uninfected Persons. Five studies assessed IGRA sen-
sitivity among HIV-uninfected persons with suspected active
tuberculosis; data were insufficient to report HSROC and/or
bivariate pooled sensitivity estimates for either QFT-GIT [36, 37,
47] or T-SPOT [37, 46]. Pooled sensitivity estimates were sim-
ilar for T-SPOT (88%; 95% CI, 81%–95%; 4 studies [17, 37,
43, 46]) and QFT-GIT (84%; 95% CI, 78%–91%; 9 studies
[10, 33, 35–37, 39, 45, 47, 48]) when studies evaluating pa-
tients with known active tuberculosis were included in the
analysis (Figure 5). Pooled sensitivity estimates showed sig-
nificant heterogeneity for QFT-GIT (I-squared, 60%; P 5 .01)
but not for T-SPOT (I-squared, 28%; P 5 .25).
Comparisons of QFT-GIT and T-SPOT Sensitivity. Over-
all, 4 studies (3 involving HIV-infected patients [37, 40, 41]and
1 involving HIV-uninfected persons [37]) reported comparisons
of T-SPOT and QFT-GIT sensitivity. T-SPOT sensitivity was
higher but not significantly different from QFT-GIT sensitivity
(sensitivity difference, 19%; 95% CI, 217% to 56%; P 5 .3)
(Table 2). Results were similar when restricted to HIV-infected
individuals.
Comparisons of TST and IGRA Sensitivity. Overall, 9
studies reported comparisons of TST and IGRA (3 T-SPOT and
6 QFT-GIT) sensitivity. TST sensitivity in the 5 studies [17, 39,
Figure 1. Study selection. IGRA, interferon-c release assay; LTBI, latent
tuberculosis infection.
IGRAs for Active Tuberculosis
d
JID 2011:204 (Suppl 4)
d
S1123
at McGill University Libraries on October 13, 2011jid.oxfordjournals.orgDownloaded from
43, 45, 48] involving HIV-uninfected patients was higher (78%;
95% CI, 71%–86%) than that in the 4 studies [15, 38, 45, 48]
involving HIV-infected patients (45%; 95% CI, 15%–75%).
IGRA sensitivity was not statistically different from TST sensi-
tivity for either T-SPOT (sensitivity difference, 23%; 95% CI,
0%–45%; P 5 .05) or QFT-GIT (sensitivity difference, 7%;
95% CI, 29% to 23%; P 5 .37) (Figure 6). There was significant
heterogeneity for both estimates (I-squared, .75%; P , .001).
Data were insufficient to form HIV-stratified pooled sensitivity
difference estimates for either IGRA.
Specificity
All specificity estimates were determined in persons with sus-
pected tuberculosis with use of HSROC and/or bivariate techni-
ques. O verall, pooled specificity w as low f or bo th T-SPOT (6 1%;
95% CI, 40 %–79%; 6 studies) and QFT-GIT (52%; 95 % CI, 41%–
62%; 8 studies). When restricted to HIV-infected persons with
suspected active tuberculosis, pooled specificity for T-SPOT (52%;
95% CI, 40%–6 3%; 4 st udies [34, 37, 40, 41]) was s imilar t o that
for QFT-GIT (50 %; 95% CI, 35%–65%; 5 studies [ 37, 38, 40, 41,
49]) (Figure 3 ). An insuf ficient number o f s tudies were available
to estimate pooled specificity for HIV -uninfected p atients.
Proportion of Indeterminate IGRA Results
The proportion of indeterminate IGRA results among patients
with suspected or confirmed active tuberculosis varied con-
siderably (range of 0%–26% among studies enrolling $50
participants). The proportion of indeterminate results was
low (4%; 95% CI, 1%–7%) among HIV-uninfected patients,
regardless of IGRA platform (Figure 1; online only). Ho wever,
Table 1. Characteristics of Included Studies
Study, year Country Income Setting
Total patients, n Active tuberculosis
n (%)
Indeterminate
a
n(%)
Industry
involvement
b
QFT-GIT
Aabye, 2009 Tanzania Low Inpatient/Outpatient HIV2 93 93 (100) 8 (9) Work
relationship
Aabye, 2009 Tanzania Low Inpatient/Outpatient HIV1 68 68 (100) 15 (22) Work
relationship
Raby, 2008 Zambia Low Outpatient HIV2 37 37 (100) 5 (14) No
Raby, 2008 Zambia Low Outpatient HIV1 59 59 (100) 10 (17) No
Chegou, 2009 South Africa Upper middle Outpatient HIV2 23 23 (100) 0 (0) No
Chen, 2009 China Lower middle NR HIV2 49 41 (84) 2 (4) Unclear
Dheda (b), 2009 South Africa Upper middle Inpatient/Outpatient HIV1 20 5 (25) 8 (40) No
Dheda (d), 2009 South Africa Upper middle Inpatient/Outpatient HIV2 51 15 (29) 14 (27) No
Kabeer, 2009 India Lower middle Inpatient/Outpatient HIV1 64 44 (69) 12 (19) No
Katiyar, 2008 India Lower middle Outpatient HIV2 76 76 (100) 0 (0) Unclear
Leidl (b), 2009 Uganda Low Outpatient HIV1 128 19 (15) 4 (3) Kit donation
Markova (b), 2009 Bulgaria Upper middle Outpatient HIV1 90 13 (14) 5 (6) No
Pai, 2007 India Lower middle Inpatient/Outpatient HIV2 57 57 (100) 0 (0) Unclear
Tahereh, 2010 Iran Lower middle Unclear HIV2 81 28 (35) 6 (7) Unclear
Tsiouris, 2006 South Africa Upper middle Outpatient HIV2 13 13 (100) 0 (0) Kit donation
Tsiouris, 2006 South Africa Upper middle Outpatient HIV1 26 26 (100) 5 (19) Kit donation
Veldsman, 2009 South Africa Upper middle Outpatient HIV1 60 30 (50) 9 (15) No
T-SPOT
Cattamanchi, 2010 Uganda Low Inpatient HIV1 212 112 (53) 54 (25) Kit donation
Dheda (a), 2009 South Africa Upper middle Inpatient/Outpatient HIV1 20 5 (25) 1 (5) No
Dheda (c), 2009 South Africa Upper middle Inpatient/Outpatient HIV2 49 15 (31) 2 (4) No
Jiang, 2009 China Lower middle Inpatient/Outpatient HIV1 32 32 (100) 0 (0) No
Leidl (a), 2009 Uganda Low Outpatient HIV1 128 19 (15) 6 (5) Kit donation
Markova (a), 2009 Bulgaria Upper middle Outpatient HIV1 90 13 (14) 9 (10) No
Oni, 2010 South Africa Upper middle Outpatient HIV1 85 85 (100) 5 (6) Kit donation
Ozekinci, 2007 Turkey Upper middle Inpatient HIV2 28 28 (100) 0 (0) No
Soysal, 2008 Turkey Upper middle Inpatient HIV2 102 99 (97) 4 (4) No
Shao-ping, 2009 China Lower middle Inpatient HIV2 82 22 (27) 6 (7) No
Abbreviations: HIV, human immunodeficiency virus; QFT-GIT, QuantiFERON-TB Gold In-Tube; T-SPOT, T-SPOT.TB.
a
Indeterminate results were not excluded in calculating sensitivity estimates.
b
Kit donation refers to donation of any test materials including kits and reagents. Work relationship refers to when one or more authors are involved in test
development, consulting work, or other employment by an IGRA manufacturer.
S1124
d
JID 2011:204 (Suppl 4)
d
Metcalfe et al
at McGill University Libraries on October 13, 2011jid.oxfordjournals.orgDownloaded from
the proportion of indeterminate results was considerably
higher among HIV-infected patients for both QFT-GIT (15%;
95% C I, 9%–21%; 8 studies ) and T-SP OT (9%; 9 5% CI,
0%–17%; 6 studies) (Figure 2; online only). Results were
similar for HIV-infected patients when stratified by persons
with suspected tuberculosis and persons with known active
tuberculosis.
DISCUSSION
The vast majority of the estimated annual 9.4 million new cases
of active tuberculosis and 1.7 million tuberculosis-related deaths
occur in low- and middle-income countries [50]. Because of
resource constraints, public health policies have appropriately
placed limited emphasis on diagnosis and treatment of LTBI in
these settings. Clinical use of IGRAs, however, has expanded
dramatically in recent years, especially in the private sector [13].
Because of their high burden of disease and emerging econo-
mies, these countries (eg, India, South Africa, Brazil, and China)
represent a potentially lucrative market for commercial IGRAs.
Although IGRAs are intended for LTBI and not active tuber-
culosis disease, and although these tests cannot distinguish be-
tween latent infection and active disease, there is concern about
increasing use of IGRAs for active tuberculosis in high-burden
countries. In this systematic review focused on individuals living
in low- and middle-income countries, the highest-quality evi-
dence from persons with suspected tuberculosis demonstrated
sensitivity of 69%–83% and specificity of 52%–61% for IGRAs
Figure 2. Assessment of study quality with use of the Quality Assessment of Diagnostic Accuracy Studies (QUADAS) tool. For each QUADAS item, 2
reviewers independently determined whether a study met the quality criterion or whether it was unclear.
Table 2. Comparison of Sensitivity of T-SPOT.TB Versus QuantiFERON-TB Gold In-Tube Among Persons With Suspected Active
Tuberculosis
Author, year Country HIV status
Active tuberculosis,
n(%)
Positive T-SPOT
result, n (%)
Positive QFT-GIT
result, n (%)
Sensitivity
difference
a
(%)
Dheda, 2009
b
South Africa HIV2 15 (31), 15 (29) 14 (93) 11 (73) 20
Dheda, 2009 South Africa HIV1 5 (25) 5 (100) 1 (20) 80
Leidl, 2009 Uganda HIV1 19 (15) 17 (89) 14 (74) 15
Markova, 2009 Bulgaria HIV1 13 (14) 8 (62) 12 (92) 231
Abbreviations: HIV, human immunodeficiency virus; QFT-GIT, QuantiFERON-TB Gold In-Tube; T-SPOT, T-SPOT.TB.
a
Sensitivity difference (%) is T-SPOT sensitivity (%)2QFT-GIT sensitivity (%).
b
Total number of active tuberculosis suspects evaluated by each interferon-c release assay differed within some studies; these are listed in the order T-SPOT,
QFT-GIT.
IGRAs for Active Tuberculosis
d
JID 2011:204 (Suppl 4)
d
S1125
at McGill University Libraries on October 13, 2011jid.oxfordjournals.orgDownloaded from
in the diagnosis of active tuberculosis. Furthermore, there was
no consistent evidence that either IGRA was more sensitive than
the TST for active tuberculosis diagnosis.
The majority of evidence for the diagnostic accuracy of IGRAs
to date has been summarized from high-income settings where
active tuberculosis has been used as a surrogate reference stan-
dard for LTBI diagnosis [4, 14]. However, diagnostic test
performance (eg, sensitivity and specificity) can be expected to
vary according to disease prevalence and other population
characteristics [51, 52]. Likewise, clinicians have been advised to
base their decisions on studies that most closely match their own
clinical circumstances [53].
IGRAs were designed as diagnostic tests of LTBI, though the
lack of an accepted gold standard for LTBI has been a significant
Figure 4. Sensitivity of QuantiFERON-TB Gold In-Tube and T-SPOT.TB in
human immunodeficiency virus (HIV)–infected persons with confirmed
active tuberculosis in low- and middle-income countries. The forest plots
display the sensitivity estimates obtained from individual studies and
pooled estimates derived from random effects (DerSimonian–Laird)
modeling.
Figure 3. A and B, Hierarchical summary receiver operating characteristic (HSROC) plot of studies that reported both sensitivity and specificity among
persons with suspected active tuberculosis. The summary curves from the HSROC model contain a summary operating point (red square) representing
summarized sensitivity and specificity point estimates for individual study estimates (open circles). The 95% confidence region is delineated by the area
in the orange dashed line.
Figure 5. Sensitivity of QuantiFERON-TB Gold In-Tube and T-SPOT.TB
among human immunodeficiency virus (HIV)–uninfected persons with
confirmed active tuberculosis in low- and middle-income countries. The
forest plots show the sensitivity estimates obtained from individual
studies and pooled estimates derived from random effects (DerSimonian–
Laird) modeling.
S1126
d
JID 2011:204 (Suppl 4)
d
Metcalfe et al
at McGill University Libraries on October 13, 2011jid.oxfordjournals.orgDownloaded from
limitation in establishing test performance. In contrast, adequate
and commonly used reference standards exist for diagnosing
active tuberculosis. Among studies that enrolled persons with
suspected active tuberculosis (ie, patients with diagnostic un-
certainty), both IGRAs demonstrated suboptimal rule-out value
for active tuberculosis. In other words, approximately 1 in 4
patients with culture-confirmed active tuberculosis can be ex-
pected to have negative IGRA results in low- and middle-income
countries; this has consequences for patients in terms of mor-
bidity and mortality. Although high-quality data were limited,
sensitivity of both IGRAs was lower among HIV-infected pa-
tients (60%–70%), suggesting that 1 in 3 HIV-infected pa-
tients with active tuberculosis will have negative IGRA results.
The few available comparisons between QFT-GIT and T-SPOT
revealed higher sensitivity for the T-SPOT platform, although
this difference did not reach statistical significance. Lastly,
comparisons with pooled estimates of TST sensitivity were dif-
ficult to interpret because of substantial heterogeneity. Our
results, however, suggest that neither IGRA platform may be
more sensitive than the TST for active tuberculosis diagnosis in
low- and middle-income countries.
IGRA specificity in diagnosing LTBI, estimated among in-
dividuals at low risk for tuberculosis exposure in settings with
low tuberculosis incidence (high-income settings), is known to
be high ($98%) [4]. In contrast, specificity for active tubercu-
losis diagnosis is best estimated only in studies evaluating per-
sons with suspected tuberculosis. As expected, because of the
higher background LTBI prevalence and the known inability of
IGRAs to differentiate LTBI from active tuberculosis [10], the
specificity of both IGRAs for active tuberculosis was low, re-
gardless of HIV status. These data suggest that 1 in 2 patients
without active tuberculosis will have positive IGRA results; this
has consequences for patients because of unnecessary therapy
for tuberculosis and its attendant risks. Studies demonstrating
activated T-cell IFN-c response throughout the entire spectrum
of tuberculosis, from latency to active disease [54], lend biologic
plausibility to our findings. Even in the spectrum of latent tu-
berculosis infection [55], activated T-cell IFN-c responses occur
throughout each phase, with the possible exception of the innate
immune response (which eliminates M. tuberculosis without
priming a T-cell immune response).
The goal of our systematic review was to critically evaluate the
diagnostic accuracy of IGRAs for active tuberculosis diagnosis in
low- and middle-income settings. However, there are inherent
limitations to sensitivity, specificity, and predictive values as
measures of test performance. These measures are unable to
determine the extent to which a test may improve on readily
available clinical information [56] or the degree to which
patient-important outcomes are improved by test results [26].
Although limited, available data suggest that IGRAs may add
little to the conventional diagnostic investigation for active tu-
berculosis in settings with low [57] and high tuberculosis in-
cidence [58]. Additional work is necessary to confirm this.
Our meta-analysis has several limitations. First, as with pre-
vious systematic reviews [4, 14], heterogeneity was substantial
for the primary outcomes of sensitivity and specificity. We used
empirical random effects weighting, excluded all studies con-
tributing ,10 eligible individuals, and separately synthesized
data for currently manufactured IGRAs to minimize heteroge-
neity. Second, World Bank income classification is an imperfect
surrogate for national tuberculosis incidence. Although no
standard criteria currently exist for defining countries with high
tuberculosis incidence, our results were fundamentally un-
changed when restricted to nations with a World Health
Organization (WHO)-defined annual tuberculosis incidence of
$50 cases/100 000 population [50]. Third, it is likely that un-
published data and ongoing studies were missed. It is also
possible that studies that found poor IGRA performance were
less likely to be published. Because of the lack of statistical
methods to account for publication bias in diagnostic meta-
analyses, it would be prudent to assume some degree of over-
estimation of our estimates resulting from publication bias.
Fourth, our review did not include evidence on use of IGRAs in
2 patient subgroups in which conventional tests for active tu-
berculosis perform poorly: children and patients with suspected
extrapulmonary tuberculosis. Lastly, we did not identify any
studies directly measuring the impact of IGRAs on patient-im-
portant outcomes.
In conclusion, as in the case of the TST, the data suggest no
role for using IGRAs for active tuberculosis diagnosis for adults
living in low- and middle-income countries. These data should
help inform evidence-based policies on the role of IGRAs in
active tuberculosis diagnosis in low- and middle-income
Figure 6. Sensitivity difference between interferon-c release assay
(IGRA) and tuberculin skin test (TST) results. The forest plots display
percent differences (IGRA sensitivity–TST sensitivity) for confirmed active
pulmonary tuberculosis in individual studies and pooled estimates derived
from random effects (DerSimonian–Laird) modeling. *Studies involving
human immunodeficiency virus (HIV)–infected patients.
IGRAs for Active Tuberculosis
d
JID 2011:204 (Suppl 4)
d
S1127
at McGill University Libraries on October 13, 2011jid.oxfordjournals.orgDownloaded from
settings. Indeed, a WHO Expert Group considering this evidence
recently recommended that IGRAs should not be used as
a replacement for conventional microbiological diagnosis of
pulmonary and extrapulmonary tuberculosis in low-and middle-
income countries [59].
Notes
Acknowledgments. We thank the authors of all studies included in the
review for kindly responding to our requests for additional information;
George Yen, for his help with translation; and UNICEF/UNDP/World
Bank/WHO Special Programme for Research and Training in Tropical
Diseases, WHO Stop TB Department, and New Diagnostics Working
Group, Stop TB Partnership, for supporting this work.
Financial Support. This work was supported in part by the National
Institutes of Health (UCSF-CTSI KL2 RR024130 to J. Z. M., K23HL094141
to A. C., and K24 HL087713 to L. H.) and a New Investigator Award from
the Canadian Institutes of Health Research (to M. P.).
Potential conflicts of interest. K. R. S. serves as Coordinator of the
Evidence Synthesis subgroup of Stop TB Partnership’s New Diagnostics
Working Group; M. P. serves as cochair of the Stop TB Partnership’s New
Diagnostics Working Group and as consultant to the Bill & Melinda Gates
Foundation. All other authors: no conflicts.
All authors have submitted the ICMJE Form for Disclosure of Potential
Conflicts of Interest. Conflicts that the editors consider relevant to the
content of the manuscript have been disclosed.
References
1. Pai M, Kalantri S, Dheda K. New tools and emerging technologies for
the diagnosis of tuberculosis: part I. Latent tuberculosis. Expert Rev
Mol Diagn 2006; 6:413–22.
2. Menzies D, Pai M, Comstock G. Meta-analysis: new tests for the
diagnosis of latent tuberculosis infection: areas of uncertainty and
recommendations for research. Ann Intern Med 2007; 146:340–54.
3. Pai M, Riley LW, Colford JM Jr. Interferon-gamma assays in the im-
munodiagnosis of tuberculosis: a systematic review. Lancet Infect Dis
2004; 4:761–76.
4. Pai M, Zwerling A, Menzies D. Systematic review: T cell-based assays
for the diagnosis of latent tuberculosis infection: an update. Ann Intern
Med 2008; 149:177–84.
5. Mazurek G, Jereb J, Vernon A, LoBue P, Goldberg S. Updated guide-
lines for using interferon-gamma release assays to detect Mycobacte-
rium tuberculosis infection, United States. MMWR. In press.
6. CTC. Canada communicable disease report: updated recom-
mendations on interferon gamma release assays for latent tuberculosis
infection, 2008.
7. NHS. Health Protection Agency position statement on the use of in-
terferon gamma release assay (IGRA) tests for tuberculosis (TB). HPA
Tuberculosis Programme Board, 2008.
8. Lange C, Pai M, Drobniewski F, Migliori GB. Interferon-gamma release
assays for the diagnosis of active tuberculosis: sensible or silly? Eur
Respir J 2009; 33:1250–3.
9. Menzies D. Using tests for latent tuberculous infection to diagnose
active tuberculosis: can we eat our cake and have it too? Ann Intern
Med 2008; 148:398–9.
10. Pai M, Menzies D. Interferon-gamma release assays: what is their
role in the diagnosis of active tuberculosis? Clin Infect Dis 2007; 44:
74–7.
11. Sester M, Sotgiu G, Lange C, et al. Interferon-{gamma} release assays
for the diagnosis of active tuberculosis: a systematic review and meta-
analysis. Eur Respir J.
12. Dheda K, van Zyl Smit R, Badri M, Pai M. T-cell interferon-gamma
release assays for the rapid immunodiagnosis of tuberculosis: clinical
utility in high-burden vs. low-burden settings. Curr Opin Pulm Med
2009; 15:188–200.
13. Denkinger CM, Dheda K, Pai M. Guidelines on interferon-c release
assays for tuberculosis infection: concordance, discordance or confu-
sion? Clin Microbiol Infect 2011; 6:806–14.
14. Diel R, Loddenkemper R, Nienhaus A. Evidence-based comparison of
commercial interferon-gamma release assays for detecting active TB:
a metaanalysis. Chest 2010; 137:952–68.
15. Jiang W, Shao L, Zhang Y, et al. High-sensitive and rapid detection of
Mycobacterium tuberculosis infection by IFN-gamma release assay
among HIV-infected individuals in BCG-vaccinated area. BMC Im-
munol 2009; 10:31.
16. Kanunfre KA, Leite OH, Lopes MI, Litvoc M, Ferreira AW. Enhance-
ment of diagnostic efficiency by a gamma interferon release assay for
pulmonary tuberculosis. Clin Vaccine Immunol 2008; 15:1028–30.
17. Soysal A, Torun T, Efe S, Gencer H, Tahaoglu K, Bakir M. Evalua-
tion of cut-off values of interferon-gamma-based assays in the di-
agnosis of M. tuberculosis infection. Int J Tuberc Lung Dis 2 008; 12:
50–6.
18. Deville WL, Buntinx F, Bouter LM, et al. Conducting systematic reviews
of diagnostic studies: didactic guidelines. BMC Med Res Methodol
2002; 2:9.
19. Gatsonis C, Paliwal P. Meta-analysis of diagnostic and screening test
accuracy evaluations: methodol ogic primer. AJR A m J Roentgenol 2 006;
187:271–81.
20. Leeflang MM, Deeks JJ, Gatsonis C, Bossuyt PM. Systematic reviews
of diagnostic test accuracy. Ann Intern Med 2008; 149:889–97.
21. Pai M, McCulloch M, Enanoria W, Colford JM Jr. Systematic reviews
of diagnostic test evaluations: what’s behind the scenes? ACP J Club
2004; 141:A11–3.
22. World Bank List of Economies. />DATASTATISTICS/Resources/CLASS.XLSApril 2010. Accessed 1 June
2010.
23. Whiting P, Rutjes AW, Reitsma JB, Bossuyt PM, Kleijnen J. The de-
velopment of QUADAS: a tool for the quality assessment of studies of
diagnostic accuracy included in systematic reviews. BMC Med Res
Methodol 2003; 3:25.
24. Fontela PS, Pant Pai N, Schiller I, Dendukuri N, Ramsay A, Pai M.
Quality and reporting of diagnostic accuracy studies in TB, HIV and
malaria: evaluation using QUADAS and STARD standards. PLoS One
2009; 4:e7753.
25. Pai M, Minion J, Steingart K, Ramsay A. New and improved tuber-
culosis diagnostics: evidence, policy, practice, and impact. Curr Opin
Pulm Med 2010; 16:271–84.
26. Schunemann HJ, Oxman AD, Brozek J, et al. Grading quality of evi-
dence and strength of recommendations for diagnostic tests and
strategies. BMJ 2008; 336:1106–10.
27. Rutjes AW, Reitsma JB, Di Nisio M, Smidt N, van Rijn JC, Bossuyt PM.
Evidence of bias and variation in diagnostic accuracy studies. CMAJ
2006; 174:469–76.
28. Van Deun A. What is the role of mycobacterial culture in diagnosis and
case definition? In: Frieden T, ed. Toman’s tuberculosis: case detection,
treatment, and monitoring-questions and answers, 2nd ed. World
Health Organization, 2004; 35–43.
29. Lijmer JG, Bossuyt PM, Heisterkamp SH. Exploring sources of het-
erogeneity in systematic reviews of diagnostic tests. Stat Med 2002; 21:
1525–37.
30. Rutter CM, Gatsonis CA. A hierarchical regression approach to meta-
analysis of diagnostic test accuracy evaluations. Stat Med 2001; 20:
2865–84.
31. Harbord R, Whiting P. Metandi: meta-analysis of diagnostic accuracy
using hierarchical logistic regression. Stata J 2009; 9:211–29.
32. Harbord RM, Deeks JJ, Egger M, Whiting P, Sterne JA. A unification
of models for meta-analysis of diagnostic accuracy studies. Biostatistics
2007; 8:239–51.
33. Aabye MG, Ravn P, PrayGod G, et al. The impact of HIV infection
and CD4 cell count on the performance of an interferon gamma release
assay in patients with pulmonary tuberculosis. PLoS One 2009;4:
e4220.
S1128
d
JID 2011:204 (Suppl 4)
d
Metcalfe et al
at McGill University Libraries on October 13, 2011jid.oxfordjournals.orgDownloaded from
34. Cattamanchi A, Smith R, Steingart KR, et al. Interferon-gamma release
assays for the diagnosis of latent tuberculosis infection in HIV-infected
individuals: a systematic review and meta-analysis. J Acquir Immune
Defic Syndr 2011; 56:230–8.
35. Chegou NN, Black GF, Kidd M, van Helden PD, Walzl G. Host markers
in QuantiFERON supernatants differentiate active TB from latent TB
infection: preliminary report. BMC Pulm Med 2009; 9:21.
36. Chen X, Yang Q, Zhang M, et al. Diagnosis of active tuberculosis in
China using an in-house gamma interferon enzyme-linked immuno-
spot assay. Clin Vaccine Immunol 2009; 16:879–84.
37. Dheda K, van Zyl-Smit RN, Meldau R, et al. Quantitative lung T cell
responses aid the rapid diagnosis of pulmonary tuberculosis. Thorax
2009; 64:847–53.
38. Kabeer BSA, Sikhamani R, Swaminathan S, Perumal V, Paramasivam
P, Raja A. Role of interferon gamma release assay in active TB diagnosis
among HIV infected individuals. PLoS One 2009; 4:e5718.
39. Katiyar SK, Sampath A, Bihari S, Mamtani M, Kulkarni H. Use of
the QuantiFERON-TB Gold In-Tube test to monitor treatment efficacy
in active pulmonary tuberculosis. Int J Tuberc Lung Dis 2008; 12:
1146–52.
40. Leidl L, Mayanja-Kizza H, Sotgiu G, et al. Relationship of immuno-
diagnostic assays for tuberculosis and numbers of circulating CD41
T cells in HIV-infection. Eur Respir J 2010; 35:619–26.
41. Markova R, Todorova Y, Drenska R, Elenkov I, Yankova M, Stefanova
D. Usefulness of interferon-gamma release assays in the diagnosis of
tuberculosis infection in HIV-infected patients in Bulgaria. Bio-
technology & Biotechnological Equipment 2009; 23:1103–8.
42. Oni T, Patel J, Gideon HP, et al. Enhanced diagnosis of HIV-1 asso-
ciated tuberculosis by relating T-SPOT.TB and CD4 counts. Eur Respir
J 2010; 36:594–600.
43. Ozekinci T, Ozbek E, Celik Y. Comparison of tuberculin skin test and
a specific T cell-based test, T-Spot.TB, for the diagnosis of latent tu-
berculosis infection. J Int Med Res 2007; 35:696–703.
44. Pai M, Joshi R, Bandyopadhyay M, et al. Sensitivity of a whole-blood
interferon-gamma assay among patients with pulmonary tuberculosis
and variations in T cell responses during anti-tuberculosis treatment.
Infection 2007; 35:98–103.
45. Raby E, Moyo M, Devendra A, et al. The effects of HIV on the sensi-
tivity of a whole blood IFN-gamma release assay in Zambian adults
with active tuberculosis. PLoS One 2008; 3:e2489.
46. Huang S, Lu S, Zhu Z, et al. Enzyme-linked immunospot assay com-
bined with serum latex agglutination test for diagnosis of pulmonary
tuberculosis and concomitant pulmonary cryptococcosis. Chin J Infect
Chemother 2009; 9:252–5.
47. Tahereh K, Alireza N, Massoud S, Amina K. A validity study of the
QuantiFERON-TB Gold (QFT-TB) method for the diagnosis of
pulmonary tuberculosis in a high risk population. Swiss Med Wkly
2010; 140:95–6.
48. Tsiouris SJ, Coetzee D, Toro PL, Austin J, Stein Z, El-Sadr W. Sensi-
tivity analysis and potential uses of a novel gamma interferon release
assay for diagnosis of tuberculosis. J Clin Microbiol 2006; 44:2844–50.
49. Veldsman C, Kock MM, Rossouw T, et al. QuantiFERON-TB GOLD
ELISA assay for the detection of Mycobacterium tuberculosis-specific
antigens in blood specimens of HIV-positive patients in a high-burden
country. FEMS Immunol Med Microbiol 2009; 57:269–73.
50. WHO. Global tuberculosis control 2010. Geneva: World Health Or-
ganization, 2010.
51. Leeflang MM, Bossuyt PM, Irwig L. Diagnostic test accuracy may vary
with prevalence: implications for evidence-based diagnosis. J Clin
Epidemiol 2009; 62:5–12.
52. Brenner H, Gefeller O. Variation of sensitivity, specificity, likelihood
ratios and predictive values with disease prevalence. Stat Med 1997;
16:981–91.
53. Guyatt GH, Oxman AD, Vist GE, et al. GRADE: an emerging consensus
on rating quality of evidence and strength of recommendations. BMJ
2008; 336:924–6.
54. Andersen P, Doherty TM, Pai M, Weldingh K. The prognosis of latent
tuberculosis: can disease be predicted? Trends Mol Med 2007; 13:
175–82.
55. Barry CE 3rd, Boshoff HI, Dartois V, et al. The spectrum of latent
tuberculosis: rethinking the biology and intervention strategies. Nat
Rev Microbiol 2009; 7:845–55.
56. Cook NR. Use and misuse of the receiver operating characteristic curve
in risk prediction. Circulation 2007; 115:928–35.
57. Metcalfe JZ, Cattamanchi A, Vittinghoff E, et al. Evaluation of quan-
titative IFN-gamma response for risk stratification of active tubercu-
losis suspects. Am J Respir Crit Care Med 2010; 181:87–93.
58. Rangaka MX, Gideon HP, Wilkinson KA, et al. No discriminatory
value of interferon release added to smear negative HIV-tuberculosis
algorithms. Eur Respir J 2011; doi:10.1183.09031936.00058911.
59. WHO. Strategic and Technical Advisory Group for Tuberculosis
(STAG-TB): report of the tenth meeting. Geneva: World Health
Organization, 2010. />report_2010.pdf. Accessed 1 December 2010.
IGRAs for Active Tuberculosis
d
JID 2011:204 (Suppl 4)
d
S1129
at McGill University Libraries on October 13, 2011jid.oxfordjournals.orgDownloaded from