The impact of sovereign credit risk on bank funding conditions pot
Bạn đang xem bản rút gọn của tài liệu. Xem và tải ngay bản đầy đủ của tài liệu tại đây (972.32 KB, 52 trang )
Committee on the Global
Financial System
CGFS Papers
No 43
The impact of sovereign credit
risk on bank funding conditions
Report submitted by a Study Group established by the Committee on
the Global Financial System
This Study Group was chaired by Fabio Panetta of the Bank of Italy
July 2011
JEL classification: E58, E60, G21
Copies of publications are available from:
Bank for International Settlements
Communications
CH-4002 Basel, Switzerland
E-mail:
Fax: +41 61 280 9100 and +41 61 280 8100
This publication is available on the BIS website (
www.bis.org
).
© Bank for International Settlements 2011. All rights reserved. Brief excerpts may be
reproduced or translated provided the source is cited.
ISBN 92-9131-879-5 (print)
ISBN 92-9197-879-5 (online)
CGFS – The impact of sovereign credit risk on bank funding conditions
iii
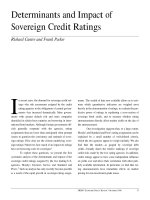
Preface
In late 2010, the Committee on the Global Financial System (CGFS) established a Study
Group to examine the relationship between sovereign credit risk and bank funding
conditions, how banks might respond to an environment of ongoing elevated sovereign risk
and the implications for policymakers. This is an important topic, as sovereign credit risk is
already a significant issue for European banks, and over coming years may have
implications for global financial stability.
The Study Group was chaired by Fabio Panetta of the Bank of Italy. The report was finalised
in early June 2011, and presented to central bank Governors at the Global Economy Meeting
later that month, where it received endorsement for publication.
We hope that this report will be a relevant and timely input to national and international
discussions about managing the current circumstances of economic and financial strain.
Mark Carney
Chairman, Committee on the Global Financial System
Governor, Bank of Canada
CGFS – The impact of sovereign credit risk on bank funding conditions
v
Contents
Preface iii
Introduction and executive summary 1
1. The deterioration in sovereigns’ perceived creditworthiness 3
2. Broad trends in the composition and cost of banks’ funding 4
2.1 Composition of bank funding 5
2.2 Banks’ funding costs 8
3. Transmission channels 13
3.1 Asset holdings 13
3.2 The collateral/liquidity channel 17
3.3 Sovereign ratings and bank ratings 20
3.4 Effects of government guarantees on bank funding 21
3.5 International spillovers 25
3.6 Risk aversion channel 27
3.7 Impact on banks’ non-interest income 27
3.8 Crowding-out effects on banking sector debt issuance 28
3.9 Hedging strategy of sovereign exposure with the iTraxx Financial Index 28
4. Discussion of results and conclusions 29
4.1 Bank funding structure and transmission channels: main findings 29
4.2 Implications for banks 30
4.3 Possible policy implications 31
References 34
Annex 1 Spillovers from banks to sovereigns and possible feedback loops 37
Annex 2 How previous sovereign crises have affected banks 38
Annex 3 A timeline of key sovereign debt events 40
Annex 4 Graphical appendix 42
Annex 5 Study Group members 45
CGFS – The impact of sovereign credit risk on bank funding conditions
1
Introduction and executive summary
The financial crisis and the ensuing recession have caused a sharp deterioration in public
finances across advanced economies, raising investor concerns about sovereign risk. The
concerns have so far mainly affected the euro area, where some countries have seen their
credit ratings downgraded during 2009−11 and their funding costs rise sharply. Other
countries have also been affected, but to a much lesser extent. Greater sovereign risk is
already having adverse effects on banks and financial markets.
Looking forward, sovereign risk concerns may affect a broad range of countries. In advanced
economies, government debt levels are expected to rise over coming years, due to high
fiscal deficits and rising pension and health care costs. In emerging economies, vulnerability
to external shocks and political instability may have periodic adverse effects on sovereign
risk. Overall, risk premia on government debt will likely be higher and more volatile than in
the past. In some countries, sovereign debt has already lost its risk-free status; in others, it
may do so in the future.
The challenge for authorities is to minimise the negative consequences for bank funding and
the flow-on effects on the real economy. This report outlines the impact of sovereign risk
concerns on the cost and availability of bank funding over recent years. It then describes the
channels through which sovereign risk affects bank funding. The last section summarises the
main conclusions and discusses some implications for banks and the official sector.
Two caveats are necessary before discussing the main findings. First, the analysis focuses
on causality going from sovereigns to banks, as is already the case in some countries, and,
looking forward, is a possible scenario for other economies. But causality may clearly also go
from banks to sovereigns. However, even in this second case, sovereign risk eventually
acquires its own dynamics and compounds the problems of the banking sector. Second, the
report examines the link between sovereign risk and bank funding in general terms, based on
recent experience and research. It does not assess actual sovereign risk and its impact on
bank stability in individual countries at the present juncture.
Sovereign risk and the cost and composition of bank funding
Higher sovereign risk since late 2009 has pushed up the cost and adversely affected the
composition of some euro area banks’ funding, with the extent of the impact broadly in line
with the deterioration in the creditworthiness of the home sovereign. Banks in Greece,
Ireland and Portugal have found it difficult to raise wholesale debt and deposits, and have
become reliant on central bank liquidity. The increase in the cost of wholesale funding has
spilled over to banks located in other European countries, although to a much lesser extent.
These banks have retained access to funding markets. Banks in other major advanced
economies have experienced only modest changes in their wholesale funding costs.
Transmission channels through which sovereign risk affects bank funding
Rises in sovereign risk adversely affect banks’ funding costs through several channels, due
to the pervasive role of government debt in the financial system. First, losses on holdings of
government debt weaken banks’ balance sheets, increasing their riskiness and making
funding more costly and difficult to obtain. Banks’ exposures are mostly to the home
sovereign. Second, higher sovereign risk reduces the value of the collateral banks can use to
raise wholesale funding and central bank liquidity. The repercussions of this channel have so
far been contained by the intervention of central banks. Third, sovereign downgrades
generally flow through to lower ratings for domestic banks, increasing their wholesale funding
costs, and potentially impairing their market access. Fourth, a weakening of the sovereign
reduces the funding benefits that banks derive from implicit and explicit government
guarantees. Since end-2009, the value of guarantees seems to have diminished for the
2
CGFS – The impact of sovereign credit risk on bank funding conditions
weaker euro area countries. Other channels were also examined, but our analysis was
inconclusive regarding their significance (see Section 3).
Sovereign tensions in one country may spill over to banks in other countries, either through
banks’ direct exposures to the distressed foreign sovereign, or indirectly, as a result of cross-
border interbank exposures or possible contagion across sovereign debt markets.
Implications for banks and some associated policy issues
Changes in banks’ operations may mitigate their exposure to sovereign risk. On the assets
side, banks might further diversify the country composition of their sovereign portfolio, to
contain their overexposure to the home sovereign. For banks located outside the euro area
this may imply, in addition to currency risk, a trade-off between sovereign and liquidity risk,
as foreign sovereign securities may not be accepted to satisfy liquidity standards or as
collateral in central bank and private repurchase agreements.
Banks may lessen the adverse impact of sovereign risk on their funding by making greater
use of stable funding sources such as bonds, retail deposits and equity. They could also
increase their focus on minimising “risk-adjusted” funding costs by spreading their issuance
over time and avoiding the clustering of maturing debt. Cross-border banks might also
diversify their debt issues across different jurisdictions through their subsidiaries.
Internationally active banks – and their supervisors – need to track fiscal conditions in the
foreign countries in which they operate, as any worsening in sovereign risk in those countries
could affect their branches or subsidiaries, with negative spillovers on the parent bank.
There are also possible implications for the official sector. First and foremost, the negative
spillovers from sovereign risk to bank risk, and the impossibility of fully protecting the banking
system from a severely distressed domestic sovereign, is yet another reason to maintain
sound public finance conditions. Moreover, increasing international financial integration and
the close links between banks and sovereigns imply that global financial stability depends on
the solidity of fiscal conditions in each individual country.
1
Sound supervisory and macroprudential policies are also of the essence, as a strong capital
base and rigorous credit and liquidity risk management practices are indispensable in
containing the impact of sovereign tensions on banks.
Moreover, because the crisis has shown that sovereign debt may not be liquid and riskless at
all times, authorities should closely monitor the effects of regulatory policies which provide
banks with strong incentives to hold large amounts of government securities.
Transparency is also important. During a sovereign crisis, when risk aversion is high,
uncertainty about the quality of banks’ assets (including sovereign portfolios) can create
funding pressures for all banks. Depending on the specific circumstances, authorities might
want to consider coordinated, industry-wide disclosures on banks’ sovereign exposures.
To contain potential bank liquidity shortages induced by sovereign risk, central banks might
consider having flexible operational frameworks that allow funding to be supplied against a
broad range of collateral. But this is not costless – it shifts credit risk to the central bank and
creates moral hazard – and so should be used sparingly and with appropriate safeguards.
Regulatory developments (such as the proposed changes in bank resolution regimes) will
contribute to weakening the link between sovereign and bank risk, by reducing investors’
expectations of government support for distressed banks. Looking ahead, authorities should
monitor how regulatory changes influence the relationship between banks and sovereigns.
1
If banking markets are closely integrated, each country is de facto responsible for preserving the stability of
the global financial system. By maintaining sound fiscal conditions, it provides a public good to other countries.
CGFS – The impact of sovereign credit risk on bank funding conditions
3
1. The deterioration in sovereigns’ perceived creditworthiness
2
The financial crisis and global economic downturn have caused a sharp deterioration in
public finances across advanced economies. Fiscal deficits widened significantly, reflecting
the effects of automatic stabilisers, discretionary stimulus measures to reduce the severity of
the downturn, and support to the financial sector. Between end-2007 and end-2010, average
budget deficits in advanced countries increased from 1% to 8% of GDP and gross
government debt rose from 73% to 97% of GDP. In emerging economies, government debt
levels are trending lower.
The situation is currently most severe in some euro area countries, which have seen their
credit ratings lowered several notches and/or have experienced sizeable increases in their
debt spreads (Graph 1). Greece, Ireland and Portugal have received international
assistance, after they were unable to raise funding at reasonable cost. The driver of the
increase in sovereign risk differs across these countries – for example, in Greece the
financial crisis has exacerbated an already weak fiscal position, while in Ireland the
government’s fiscal position was considered strong before the crisis but has been severely
affected by the cost of supporting banks. Nonetheless, even where the original causality
went from banks to the sovereign, sovereign risk has reached the point where it is
compounding the problems in the banking sector.
3
Other euro area countries, such as Spain
and, to a lesser extent, Belgium and Italy, have also been affected by investor concerns
about fiscal conditions. Spain’s credit rating has been downgraded to AA.
The United States, the United Kingdom and Japan have so far been less affected by
sovereign risk concerns, despite the sharp increase in their public debt ratios over recent
years. However, they have not been immune, with Japan being downgraded in January
2011, and the United States and United Kingdom being warned at various stages that they
might lose their triple-A ratings.
Graph 1
CDS premia and ratings of advanced economies
Sovereign CDS premia
1
Sovereign CDS premia
1
Credit ratings
2
0
200
400
600
800
1,000
1,200
1,400
1,600
1,800
2009 2010 2011
Greece
Ireland
Portugal
Italy
Spain
Germany
France
0
20
40
60
80
100
120
140
160
180
2009 2010 2011
United States
United Kingdom
Japan
CCC+
B-
B
B+
BB-
BB
BB+
BBB-
BBB
BBB+
A-
A
A+
AA-
AA
AA+
AAA
2007 2008 2009 2010 2011
Greece
Ireland
Portugal
Japan
Spain
1
Five-year on-the-run CDS spreads, in basis points.
2
Average of Fitch, Moody’s and Standard & Poor’s foreign currency long-term
sovereign ratings.
Sources: Bloomberg; Markit.
2
Annex 3 provides a timeline of the evolution of the current sovereign debt crisis.
3
Some of the analysis in the report (such as Graph A4.5) may be affected by reverse causality from banks to
sovereigns. For a broader discussion of reverse causality, see Annex 1: Spillovers from banks to sovereigns
and possible feedback loops.
4
CGFS – The impact of sovereign credit risk on bank funding conditions
Looking forward, public finances in many advanced countries are likely to remain under
pressure for some time. Government debt levels are expected to continue to rise over the
next few years, with the United States, the United Kingdom, Japan and some euro area
countries running large fiscal deficits (Graph 2).
4
Over coming decades, countries also face
rising pension and health care costs related to the ageing of their populations (assuming that
there are no changes in entitlements).
5
High combined debt levels of government,
households and corporates in some countries also add to the sovereign’s vulnerability.
Graph 2
Government debt and fiscal balances
As a percentage of GDP, for 2012
Financial balances Underlying primary balance
1
Gross financial liabilities
–8
–6
–4
–2
0
2
BE DE GR FR IE IT PT ES US GB JP
–6
–4
–2
0
2
4
BE DE GR FR IE IT PT ES US GB JP
0
50
100
150
200
250
BE DEGRFR IE IT PT ES US GB JP
BE = Belgium; DE = Germany; ES = Spain; FR = France; GB = United Kingdom; GR = Greece; IE = Ireland; IT = Italy; JP = Japan;
PT = Portugal; US = United States.
1
Underlying primary balance is adjusted for the economic cycle and excludes non-recurring revenues / expenses and interest payments.
Source: OECD, Economic Outlook, December 2010.
Elevated sovereign debt levels in advanced countries may mean that their debt is no longer
regarded as having zero credit risk and may not be liquid at all times. As a result, sovereign
risk premia could be persistently higher and more volatile in the future than they have been in
the past, particularly for less fiscally conservative governments. This will almost certainly
have adverse consequences for banks, as evidenced by empirical analyses
6
, and history
(see Annex 2: How previous sovereign crises have affected banks). Moreover, while this
report focuses on the potential spillovers from sovereign risk to bank risk, the consequences
of a severe deterioration of the creditworthiness of the sovereign would likely go well beyond
banks, affecting the entire financial system.
2. Broad trends in the composition and cost of banks’ funding
7
To date, banks’ balance sheet growth does not seem to differ systematically across countries
based on public finance conditions (Graph 3).
8
Clearer patterns are discernible in the
4
The OECD forecasts used in Graph 2 are one set of forecasts among many.
5
See Cecchetti et al (2010) and the BIS (2010a).
6
Demirgüç-Kunt and Huizinga (2010) show that in advanced countries banks’ market valuation is negatively
related to government debt and deficits. Borensztein and Panizza (2009) estimate a high probability of having
a banking crisis conditional on a sovereign default.
7
In this report, bank nationalities have been shown separately where possible. Where nationalities have been
grouped, the groupings are based on the dynamics of the underlying data, with similar countries put together.
Consistent with this, the country groupings differ through the report. Owing to data limitations, the broad
analysis of the composition of bank liabilities in Section 2 refers to banks resident in a given country, while the
analysis of wholesale markets generally refers to banks headquartered in a given country.
CGFS – The impact of sovereign credit risk on bank funding conditions
5
composition of banks’ liabilities. For banks headquartered in countries with acute sovereign
debt concerns, the share of funding derived from retail deposits, short-term wholesale debt
and cross-border liabilities has generally fallen. In these countries, this shortfall was largely
met via recourse to central bank funding and to bonds with a high degree of investor
protection (covered bonds and government-guaranteed bonds), which were issued mainly for
use as Eurosystem collateral. In contrast, in other countries, banks have slightly increased
their use of retail deposits. Bond issuance has been generally weak, though trends differ
somewhat across countries.
The cost of wholesale debt and deposit funding has risen significantly for banks from weak
euro area countries. Banks in other countries have been affected to a much smaller extent.
Part of the increase in banks’ funding costs seems to reflect investor demand for higher
compensation for taking on country risk.
2.1 Composition of bank funding
The composition of b
a
nk funding in the major advanced countries has been little changed
since the onset of sovereign tensions in late 2009. Banks have generally continued to follow
the funding patterns initiated in 2007, increasing their use of more stable funding sources
such as retail deposits and equity, and reducing their use of interbank deposits and central
bank financing (Graph A4.1).
Graph 3
GDP growth and changes in total bank liabilities
1
Real GDP growth rates Growth in total bank liabilities
2
Growth in total bank liabilities
2
–15
–10
–5
0
5
10
2007 2008 2009 2010 2011
Canada
Greece
Japan
United
Kingdom
Ireland
Portugal
United States
Euro area
–20
–10
0
10
20
30
2007 2008 2009 2010 2011
United States
Canada
United Kingdom
Japan
–20
–10
0
10
20
30
2007 2008 2009 2010 2011
Belgium
Germany
Spain
France
Greece
Ireland
Italy
Portugal
1
Percentage changes over the same quarter in the previous year.
2
For the United States, seasonally adjusted data for domestically
chartered banks. For euro area countries, growth rates exclude changes to outstanding amounts which are not due to transactions;data
refer to the monetary and financial institutions, excluding the European System of Central Banks.
Sources: OECD, central banks.
In contrast, the composition of funding has changed significantly for banks located in Greece,
Ireland and Portugal (Graph 4). In these countries, customer deposits have generally
declined as a share of total assets. This fall is particularly marked in Greece, while in Ireland
the reduction was strong in absolute terms (but the decrease in share terms is limited by the
contraction in total liabilities). The share of external liabilities has also decreased, especially
in Ireland and Portugal. Interbank and other deposits have risen, reflecting greater reliance
on central bank liquidity (which currently accounts for between 7 and 17% of total funding;
8
In most economies, banks’ assets decelerated markedly around two to four quarters after the start of the
economic downturn, reaching a trough in late 2009 and early 2010. The deleveraging was pronounced for
Irish banks, but negative asset growth was also observed in France and Germany. Over the course of 2010,
as advanced economies returned to growth, bank asset expansion picked up in most countries. In that phase,
the growth of bank assets was negative in Ireland but strong in Portugal.
6
CGFS – The impact of sovereign credit risk on bank funding conditions
see Graph 5). Borrowing from the Eurosystem has allowed banks in these countries to avoid
shrinking their balance sheets aggressively, thereby preventing a credit crunch.
Graph 4
Composition of banks’ liabilities in Greece, Ireland and Portugal
1
As a percentage of total assets
Greece Ireland
2
Portugal
0
10
20
30
40
50
60
05 06 07 08 09 10 11
Interbank and other deposits
Capital and reserves
External liabilities
Other liabilities
Debt securities
Customer deposits
0
10
20
30
40
05 06 07 08 09 10 11
0
10
20
30
40
50
05 06 07 08 09 10 11
1
Monetary and financial institutions, excluding the European System of Central Banks and shares in money market funds. Interbankand
other deposits includes, but is not limited to, borrowing from the Eurosystem.
2
External liabilities are only non-residents’ deposits.
Source: Central banks.
The funding challenges faced by banks in euro area countries hit by concerns about fiscal
sustainability have also been evident in specific markets. For instance, these banks’ US
branches – which are mostly funded with non-insured interbank and wholesale deposits, and
hence are sensitive to changes in investors’ risk perceptions – have been severely affected.
Since late 2009, the liabilities of branches of Irish, Portuguese and Spanish banks have
decreased by one-third, compared with a milder decline in the liabilities of branches of other
euro area banks and an increase in liabilities for banks from other countries (Graph 5).
Graph 5
Liabilities of US branches of foreign banks and banks’ recourse to central bank funding
Use of central bank lending facilities
1
(as a percentage of total bank liabilities)
Liabilities of US branches of foreign
banks (in billions of US dollars)
2
0
1
2
3
4
5
2007 2008 2009 2010
Canada
Euro area
Japan
United Kingdom
United States
0
4
8
1
2
1
6
20
2007 2008 2009 2010 201
1
France
Germany
Greece
Ireland
Italy
Portugal
Spain
0
300
600
900
1,200
1,500
0
60
120
180
240
300
04 05 06 07 08 09 10 11
Lhs:
France, Germany,
Italy, Netherlands
Other countries
Ireland, Portugal,
Spain (rhs)
1
Central bank lending includes: for Canada, securities purchased under resale agreements; for the euro area, lending to credit
institutions related to monetary policy operations and other claims on euro area residents in euros; for Japan, loans and receivables
under resale agreements; for the United Kingdom, short-term and long-term sterling operations; for the United States, repos, term
auction facility and discount window lending.
2
Other countries consist of all other countries with branches in the United States.
Sources: Federal Financial Institutions Examination Council 002 report; Datastream; national data.
CGFS – The impact of sovereign credit risk on bank funding conditions
7
The sovereign debt crisis has also had a clear impact on commercial paper (CP) and
certificates of deposit (CDs) issued in the euro and US markets, which represent key sources
of short-term funds for euro area banks.
9
In the euro market, while the reduction over the last
two years has been fairly generalised across European banking systems, outstanding
amounts have fallen particularly sharply for banks headquartered in Greece, Ireland,
Portugal and Spain (Graph 6). In the United States, the outstanding CP issued by Spanish
and Italian banks has also fallen somewhat over the entire period, with the declines
concentrated in the periods of acute sovereign tensions (April and November 2010). Irish
banks (not shown in the graph) have largely withdrawn from the market.
Graph 6
European banks' issuance of commercial paper and certificates of deposit
Euro CP and CDs issued by European banks
1
CP issued by financial firms in the United States
2
0
50
100
150
200
250
300
2008 2009 2010 2011
Italy
Belgium
France
Netherlands
United Kingdom
Germany
Ireland
Spain
Portugal
Greece
0
50
100
150
200
250
300
2008 2009 2010 2011
France and Germany
Italy and Spain
Other Europe
United States
1
End-of month outstanding stock; January 2008 = 100.
2
Daily outstanding stock; January 2008 = 100.
Sources: Federal Reserve Board based on the Depository Trust and Clearing Corporation (DTCC); Dealogic.
Gross and net international bond issuance by banks in the United States, the United
Kingdom and the euro area shrank during 2009 and 2010, largely reflecting reductions in
mortgage- and asset-backed debt in the first two economies and senior debt in the latter one
(Graph A4.2). Within the euro area, the share of gross bond issuance featuring a high degree
of investor protection (government-guaranteed and covered bonds) has roughly doubled to
50% (Graph A4.3). For banks headquartered in Greece, Ireland and Portugal, the shift
towards “safer” bonds has been even more pronounced (Graph 7), and was largely
motivated by the need to create collateral that is eligible in Eurosystem refinancing
operations. A large Belgian bank has also issued substantial amounts of government-
guaranteed bonds.
Banks’ capital raisings in 2010 were much lower than in the previous two years, when they
raised large amounts of equity from both public and private sources to cover writedowns and
losses from the financial crisis. Within the euro area, most of the new shares were placed by
German, Italian and Spanish banks, but there were also issues by Greek and Irish banks.
9
As of end-2010, euro market CP and CDs outstanding totalled $670 billion (with half issued by banks), while
unsecured financial CP outstanding on the US market totalled $550 billion.
8
CGFS – The impact of sovereign credit risk on bank funding conditions
Graph 7
Banks’ gross bond issuance in selected euro area countries
1
In billions of US dollars
Greece Ireland Portugal Belgium
0
10
20
30
40
05 06 07 08 09 10 11
Other bonds
Covered bonds
Guaranteed
bonds
0
10
20
30
40
05 06 07 08 09 10 11
0
10
20
30
40
05 06 07 08 09 10 11
0
10
20
30
40
05 06 07 08 09 10 11
1
Based on the sector and nationality of the issuer’s parent company. Data for Q2 2011 only includes issuance in April and May.
Sources: Dealogic; BIS.
2.2 Banks’ funding costs
Sovereign debt concerns have pushed up banks’ funding costs, with wholesale markets
more affected than retail deposits.
10
Banks from the peripheral euro area countries have
been most affected, but banks in other advanced countries – where the deterioration of
public finance conditions is less pronounced – have also experienced some funding cost
pressures.
Graph 8
Interest rates on bank deposits of households and non-financial companies in the euro area
1
In per cent
All deposits
2
Term deposits
0
1
2
3
4
5
6
2003 2004 2005 2006 2007 2008 2009 2010 2011
0
1
2
3
4
5
6
2003 2004 2005 2006 2007 2008 2009 2010 2011
Greece, Ireland, Portugal, Spain
Other countries
3
Three-month Euribor rate
1 Monthly data weighted average for each group of countries. 2 Overnight deposits, deposits with an agreed maturity and deposits
redeemable at notice. 3 Austria, Belgium, Germany, Finland, France, Italy and the Netherlands.
Source: ECB.
The average interest rate on banks’ retail deposits in Greece, Ireland, Portugal and Spain
started rising in early 2010, even though money market rates and deposit rates in other euro
10
International comparisons of bank funding costs are affected by the fact that, during the financial crisis, in
some countries (including the United States, the Netherlands and the United Kingdom) banks received
substantial government aid, which helped to contain funding costs, while in other countries (such as Canada,
Italy and Japan) banks received little or no public support. See Panetta et al (2009) and Ho and Signoretti
(2012).
CGFS – The impact of sovereign credit risk on bank funding conditions
9
area countries were drifting lower (Graph 8). Over the past year, the average deposit rate for
the four countries has increased by half a percentage point. The increase – which was driven
by rates on term deposits – is consistent with increasing competition for deposits, reflecting
banks’ attempts to boost their deposit base and lengthen its maturity, thus mitigating the
effects of the reduction in market financing. However, it may also reflect customers’ requiring
higher compensation for holding longer-term deposits at these banks.
Differences in banks’ funding costs have been starker on wholesale markets.
11
In November
2009, following the announcement of a much larger than expected Greek budget deficit,
Greek banks’ CDS premia rose sharply (Graph 9). In April 2010, some euro area countries
were downgraded and market tensions pushed up bank CDS premia in most advanced
countries, including the United States and the United Kingdom. Intervention by the official
sector in early May led to an improvement in market conditions.
12
A positive, temporary effect
also came from the release of the results of the EU bank stress tests in July. In October 2010
tensions escalated, due to the repercussions of the Irish crisis and proposed EU treaty
changes that would impose losses on holders of bonds issued by governments in financial
distress. The CDS premia of European banks rose noticeably. In the first quarter of 2011
bank funding conditions improved, mainly owing to expectations of a reinforcement of
financial assistance programmes among euro area countries. However, fresh tensions
emerged in April, when Portugal applied for international support. Sovereign CDS spreads
widened for Greece, Ireland and Portugal, while they narrowed or were not affected for other
countries. Bank CDS spreads were little changed in most euro area countries.
Graph 9
Credit default swap premia for banks in Europe and the United States
1
CDS premia for euro area, US and UK banks CDS premia for banks in euro area countries
0
100
200
300
400
500
2009 2010 2011
Euro area
United States
United Kingdom
0
400
800
1,200
1,600
2009 2010 2011
Belgium
Germany
Spain
France
Greece
Ireland
Italy
Portugal
1
For each country, the simple average of five-year CDS premia on senior bonds issued by the major banks. The most popular CDS
contract in Europe (modified restructuring) differs from that in the United States (modified-modified). This can affect the level of CDS
premia.
Sources: Datastream; Merrill Lynch.
Since late 2009, banks’ funding conditions have moved more closely with those of their home
sovereign. First, the correlation between sovereign and bank CDS premia has been
reasonably high and rising in several advanced countries, particularly some euro area ones
11
In this report, the analysis of the cost of bank wholesale funding is based on bank CDS premia, which are
more closely comparable across different banks than other forms of wholesale funding (such as bonds). The
qualitative results are similar to those based on banks’ bond spreads (unreported).
12
Several euro area countries tightened public finances. Public bodies intervened through the Eurosystem’s
Securities Markets Programme and, for countries under exceptionally strong pressure, the provision of
financing via the European Financial Stabilisation Mechanism and the European Financial Stability Facility,
supplemented by IMF assistance. This contained contagion. See Bank of Italy (2010) and ECB (2010b).
10
CGFS – The impact of sovereign credit risk on bank funding conditions
(Graph A4.5). Second, spreads at issuance on bank bonds have been affected by the
condition of the sovereign (see Box A: The impact of sovereign risk on the cost of bank
funding). Third, for some large European cross-border banking groups that are located in
non-triple-A countries and that issue bonds in different jurisdictions, the cost of issuing in
their home country has exceeded the cost of issuing via their subsidiaries in AAA-rated host
countries (Graph 10).
13
These findings are consistent with empirical analyses.
14
Graph 10
Spreads for bonds issued in different jurisdictions by large banking groups
Daily data, in basis points
Banking group A
1
Banking group B
2
0
50
100
150
200
250
300
Nov 2010 Jan 2011 Mar 2011 May 2011
Home jurisdiction
Foreign jurisdiction
0
50
100
150
200
250
300
Nov 2010 Jan 2011 Mar 2011 May 2011
1
Secondary market asset swap spreads on covered bonds maturing in 2016 and 2017, issued in the foreign and home jurisdiction,
respectively, by banks belonging to the same group; the foreign subsidiary has a lower rating than the parent bank.
2
Secondar
y
market asset swap spreads on unsecured senior bonds maturing in 2015, issued in different jurisdictions by banks from the same group;
the foreign subsidiary has a lower rating than the parent bank.
Source: Bloomberg.
The tensions emanating from the weaker euro area countries seem to have spilled over not
only to banks located in countries with vulnerable fiscal positions (such as Italy, Belgium and
Spain), but also to banks headquartered in countries with stronger public finances but with
sizeable exposures to banks or sovereigns in peripheral Europe, such as France, Germany
and the United Kingdom. The CDS premia of banks from this second group of countries rose
during late 2010, when possible haircuts on government bonds first became an issue, and
have a reasonably high correlation with the sovereign CDS spreads of the countries hit by
the crisis (Graph 11). Measures of expected default frequencies (EDFs
15
) of French, German
and Italian banks co-moved closely in 2010–11.
13
Besides the conditions of the home and host sovereigns, these differences in funding costs reflect other
factors including: the systemic importance of the subsidiary bank in the host country (an indicator of the public
support it may receive from the host sovereign in case of difficulties); the credit rating of parent and subsidiary
banks; and the characteristics of the bonds (for instance the quality of the mortgages backing the covered
bonds issued by Group A). The differences in funding costs have been noticed by market commentators; see
Financial Times (2011).
14
Demirgüç-Kunt and Huizinga (2010) find that during the financial crisis the increase in bank CDS premia is
significantly related to the deterioration of public finance conditions. Goldman Sachs (2010) finds that during
the euro area debt crisis, bank CDS premia were significantly positively correlated with the CDS premia of the
respective sovereigns (the relationship is found to be stronger than for corporate CDS premia).
15
Moody’s KMV’s expected default frequencies are an indicator of banks’ creditworthiness as perceived by stock
market investors, as they provide a measure of the probability, implied by the level and volatility of share
prices, that assets will have a lower market value than liabilities over a one-year horizon.
CGFS – The impact of sovereign credit risk on bank funding conditions
11
Graph 11
Bank CDS premia and expected default frequencies
Bank CDS premia Correlation between bank CDS and
Greek and Irish sovereign CDS
1
Bank expected default frequencies
2
0
50
100
150
200
250
Q2 2010 Q4 2010 Q2 2011
Germany
France
United Kingdom
–0.2
0.0
0.2
0.4
0.6
0.8
1.0
2007 2008 2009 2010 2011
Germany vs Greece+Ireland
United Kingdom vs
Greece+Ireland
France vs Greece+Ireland
0
100
200
300
400
500
600
700
Q2 2010 Q4 2010 Q2 2011
France
Germany
Italy
Spain
Portugal
United Kingdom
Greece
1
Three-month moving average of the exponentially weighted moving average between daily changes in the banking CDS index fo
r
each country shown and daily changes in the average of the sovereign CDS of Greece and Ireland. The banking CDS index for each
country is constructed as a simple average of each bank’s CDS. The decay factor is equal to 0.96.
2
For each country, the median
value (in basis points) of the EDFs of the banks in the respective KMV country index.
Sources: Bank of Italy; CMA; Datastream; FTSE, Institutional Brokers’ Estimate System (I/B/E/S); Moody’s KMV; Reuters.
Banks’ share prices have underperformed the broader market across advanced countries
since late 2009, and in most cases have fallen in absolute terms (Graph 12). The
underperformance has been greatest for banks headquartered in the euro area countries
affected by sovereign debt concerns. Banks in other euro area countries have performed
only a little worse than those in the United States and the United Kingdom. The cost of equity
is estimated to have increased slightly for euro area banks, and is little changed for banks in
the United Kingdom and the United States.
Graph 12
Banks’ share prices and cost of capital
Share prices: banks vs total market
1
Real cost of bank capital
2
40
60
80
100
120
2009 2010 2011
United States
United Kingdom
Belgium, Germany, France, Italy
Greece, Ireland, Portugal, Spain
8
10
12
14
16
18
20
22
2009 2010 2011
Germany
Italy
France
Greece
Spain
Portugal
United Kingdom
United States
1
Ratio of the bank share price index to the total market index, dividends reinvested. Daily data; 31 October 2009 = 100.
2
Averages o
f
banks’ cost of capital obtained with different models (a cyclically adjusted earnings yield, a beta model and dividend discount models).
End-of-month data, in per cent.
Sources: Bank of Italy calculations; Datastream; FTSE; I/B/E/S.
12
CGFS – The impact of sovereign credit risk on bank funding conditions
Box A
The impact of sovereign risk on the cost of bank funding
The empirical literature does not provide indications on the size of the impact of sovereign risk on
the cost of bank funding. This box examines whether the characteristics of the sovereign play a role
in addition to the traditional determinants of the cost of issuing bonds for banks (ie the
characteristics of the bank and the bond, and market conditions; see Elton et al (2001)).
The analysis is based on a sample of 534 unsecured fixed-rate senior bonds from 116 banks in
14 advanced countries. All issues took place in 2010, when concerns about the conditions of
sovereigns were acute. For these bonds, the following cross-sectional regression was estimated:
_
0
iz
CONDMKT
zz
GOV
ii
k
BOND
kk
j
BANK
jj
DaDaDaDaaSpread (1)
where Spread is the spread at launch between the bond yield and the swap rate on the contract of
corresponding maturity,
BANK
D
are binary dummies for each of the characteristics of the issuer
(rating, CDS spread, size),
BOND
D
are dummies for bond characteristics (issue size, maturity,
currency, rating),
GOV
D
are dummies for the sovereign (rating, CDS spread) and
CONDMKT
D
_
are
dummies for market conditions (quarter of issue).
Because the dummies are constructed in such a way that all coefficients have negative signs, the
intercept represents the hypothetical spread of the most expensive bond issue − ie the spread that a
bank would pay if its sovereign had a low rating and high CDS premium; if the bank had a high CDS
premium, low rating and small size; if the maturity of the bond was long, etc (Table A1). The layers
in Graph A1 (representing estimated coefficients) show the contribution of each variable to the
spread; in other words, each layer can be seen as the saving a bank would achieve if the worst
case characteristics foreseen by the intercept were removed.
Table A1 and Graph A1
Breakdown of the spread at launch of bank bonds by contributing factors
Dependent variable: spread at launch
1
Method: least squares
Amount of spread reduction on a hypothetical bank
bond
Variable Coefficient Std.Error t-Statistic Prob.
Constant
360.5 16.593 21.724 0.000
Sovereign rating high
-59.8 17.617 -3.396 0.001
Sovereign CDS low
-62.5 13.025 -4.800 0.000
Bank rating high
-28.6 14.118 -2.023 0.044
Bank CDS low
-17.2 10.857 -1.588 0.113
Total asset high
-17.6 9.576 -1.835 0.067
Issue rating high
-47.5 13.444 -3.534 0.000
Euro denomination
-73.3 8.786 -8.346 0.000
Short maturity
-95.2 8.959 -10.628 0.000
R-squared 0.43
Included observations 534
0
50
100
150
200
250
300
350
400
450
Government rating is AAA
Low sovereign CDS
Low bank CDS spread
Good bank rating
Large bank assets size
Euro denomination
Short bond maturity
Good issue rating
country-specific
factors
bank-specific
factors
issue-specific
factors
1
The precise definitions of the equation dummy variables are as follows: “sovereign rating high” is 1 if the sovereign is AAA;
“sovereign CDS low” is 1 if the CDS is below 45 basis points; “bank rating high” is 1 if the bank is AAA; “bank CDS low” is 1 if the
CDS is below 82 basis points; “total asset high” is 1 if total assets in 2010 are above 850 million; “issue rating high” is 1 if the rating is
AAA or AA+; “euro denomination” is 1 if the bond is denominated in euros; “short maturity” is 1 if the maturity is less than 12 months.
Source: Author’s calculations.
The main insight from this analysis is that in 2010 a large part of the spread at launch on bank
bonds (on average 30%, or 120 basis points) reflected the conditions of the sovereign. This
percentage increases to 50% for the countries for which the concerns over public finance conditions
were most pronounced. The characteristics of the issuing bank contribute less than 20% of the
spread for the entire sample and about 10% for the weak countries.
CGFS – The impact of sovereign credit risk on bank funding conditions
13
Box A (cont)
In order to examine whether sovereign characteristics also affect the spreads of bank bonds in
“normal” times, the regression was rerun using data for 2006, when investors did not perceive
significant risks for either banks or sovereigns. Results (unreported) suggest that, in normal times,
the characteristics of the sovereign have virtually no effect on the cost of bank funding, which
instead is closely related to issue-specific and bank-specific factors.
______________________
For example, the dummy for bank ratings in regression (1) equals 1 if the bank rating is AAA, and 0
otherwise. Hence, the estimated coefficient of this dummy is the reduction of the spread at issue for AAA-
rated banks relative to lower-rated banks. The coefficients of the other right-hand-side binary dummies have
similar interpretations. The regression implicitly assumes that the causality goes from the sovereign to banks.
Robustness tests were performed.
3. Transmission channels
This section examines the channels through which sovereign risk may affect the cost and
availability of funding for banks. The focus is on the channels that specifically affect the
banking system, neglecting those that affect all sectors of the economy. For example, we do
not consider the effect of any recession triggered by fiscal consolidation, as the fall in
demand would affect all economic sectors. We identify four main channels whereby a
deterioration in sovereign creditworthiness may make bank funding more costly and difficult
to obtain. First, there are direct effects on bank balance sheets and profitability through their
holdings of sovereign debt and their derivatives positions with sovereigns. Second, there is a
reduction in the value of the collateral that banks can use to obtain wholesale funding and
central bank refinancing. Third, sovereign downgrades tend to flow through to lower ratings
for domestic banks. Fourth, there are reduced benefits from implicit and explicit government
guarantees. These effects can be triggered or reinforced by the international transmission of
tensions. Other potential channels, which are less evident in our analysis due to data
constraints or because they may not be having significant effects, are discussed briefly.
3.1 Asset holdings
Increases in
sovereign risk may affect banks thr
ough their direct holdings of sovereign debt.
Losses on sovereign portfolios weaken banks’ balance sheets and increase their riskiness,
with adverse effects on the cost and availability of funding. The extent of the impact depends
on whether the securities are carried on the balance sheet at market value (that is, held in
the trading, available-for-sale or fair value option books) or at amortised cost (assets in the
held-to-maturity banking book). In the first case, a fall in the value of sovereign bonds has
direct and immediate effects on banks’ profit and loss statements, and on their equity and
leverage. In the second case, accounting principles imply that losses are recorded only when
the securities are impaired (eg when a sovereign restructuring or default becomes likely);
nonetheless, these exposures may affect bank funding conditions prior to this occurring, to
the extent that investors become concerned about the solidity of the bank.
16
16
When a bank’s riskiness increases, creditors get concerned about their position in the case of default of the
bank, when the bank’s assets would be realised at market value. Here, creditors will look through the
accounting conventions, assessing the solidity of the bank based on its assets at market value, even if they
are in the banking book.
14
CGFS – The impact of sovereign credit risk on bank funding conditions
Exposure to the domestic sovereign
In advanced economies, banks often have sizeable exposures to the home sovereign, and
generally have a strong home bias in their sovereign portfolios (Graph 13, left and centre
panels).
17
Holdings of domestic government bonds as a percentage of bank capital tend to
be larger in countries with high public debt. Among the countries severely affected by the
sovereign crisis, banks’ holdings are largest in Greece and small in Ireland. Across EU
countries, most of the exposure (85% on average) is held in the banking book, somewhat
limiting the immediate impact on banks of changes in the market price of sovereign bonds.
Graph 13
Banks’ exposure to the domestic public sector
Banks’ exposures to the domestic
sovereign
1
Concentration of banks’ sovereign
portfolio
4, 5
Percentage of sovereign bonds held
in the banking book
4, 6
0
30
60
90
120
150
0
100
200
300
400
500
IE GB AT NL FR US PT ES DE IT GR BE JP
23
0
20
40
60
80
100
PL HUGR ES IT PT DE IE FI AT FR BE DK SE SI NL GB
Banks exposures to the
domestic sovereign as a
% of total sovereign
exposures
Countries’ share of total
sovereign debt
0
20
40
60
80
100
IE LUAT BEGRNL ESGB PLDEHUFR PT IT SE FI SI DK
AT = Austria; BE = Belgium; CH = Switzerland; DE = Germany; DK = Denmark; ES = Spain; FI = Finland; FR = France; GB = United
Kingdom; GR = Greece; HU = Hungary; IE = Ireland; IT = Italy; JP = Japan; LU = Luxembourg; NL = Netherlands; PL = Poland;
PT = Portugal; SE = Sweden; SI = Slovenia; US = United States.
1
As a percentage of banks’ equity. Data are from national central banks, as of end-2010, and are on a locational basis, for banks
resident in each country. The definition of bank equity is an accounting one, which differs across countries and from the measure of Tier 1
capital used in subsequent graphs. The data for Netherlands banks are sourced from the CEBS EU-wide stress tests.
2
As at end 2009.
3
The value for Japan is shown on the right-hand scale.
4
Data on banks’ exposures are from the CEBS EU-wide stress tests, as of end-
March 2010, and are on a globally consolidated basis, for banks headquartered in each country. The share of the national banking
system covered by banks included in the EU stress tests is low for some of the smaller countries. Data on countries’ share of total
sovereign debt are from Bolton and Jeanne (2011).
5
The lighter bars show banks’ exposures to their home sovereign, as a percentage
of their total exposures to the 17 European sovereigns shown in the graph. The darker bars show each country’s share of outstanding
sovereign debt issued by the same 17 countries.
6
Holdings of domestic and foreign bonds. The horizontal line shows the average.
Sources: Bolton and Jeanne (2011); CEBS EU-wide stress tests; central banks’ data.
Exposure to foreign sovereigns
Banks also hold sizeable amounts of debt issued by foreign sovereigns. BIS data suggest
that banks’ exposure to the public sector in all foreign countries ranges from 75% of Tier 1
capital for Italian, US and German banks to over 200% for Swiss, Belgian and Canadian
banks (Graph 14). Exposure vis-à-vis the countries most severely affected by the sovereign
debt tensions is significantly smaller, but sometimes non-negligible − for instance, German,
French and Belgian banks’ exposures are around 20% of their Tier 1 capital.
18
17
In EU countries, banks’ exposures to their home sovereign as a share of their total exposures to all EU
sovereigns is much higher than the weight of the home country’s outstanding debt in a hypothetical market
portfolio comprised of sovereign debt issued by all EU countries.
18
These exposures data show a worst case scenario, where Spain is also severely affected by sovereign
tensions. Over recent months, Spain seems to have decoupled somewhat from Greece, Ireland and Portugal.
Data for German banks are on an immediate borrower, rather than an ultimate risk basis.
CGFS – The impact of sovereign credit risk on bank funding conditions
15
Graph 14
Banks’ exposure to foreign sovereigns
1
As a percentage of the home country banks’ Tier 1 capital
Vis-à-vis all countries Vis-à-vis Greece, Ireland, Portugal and Spain
0%
100%
200%
300%
400%
50–90% 90–150% 150–170% 170–300%
DE
IT
US
ES
NL
SE
FR
GB
JP
BE
CA
CH
Min-max range
Weighted average
0%
10%
20%
30%
40%
<2% 2–4% 4–10% 10–30%
CA
SE
US
CH
ES
JP
GB
IT
NL
BE
DE
FR
Min-max range
Weighted average
BE = Belgium; CA = Canada; CH = Switzerland; DE = Germany; ES = Spain; FR = France; GB = United Kingdom; IT = Italy;
JP = Japan; NL = Netherlands; SE = Sweden; US = United States.
1
Bank nationalities are grouped in “buckets”, based on the size of their exposure as a percentage of Tier 1 capital. Data are as at
December 2010, on an ultimate risk basis, except for German banks, which are on an immediate borrower basis. German banks’
Tier 1 capital is on a locational basis.
Source: BIS consolidated banking statistics.
Financial markets seem to be broadly aware of the risks stemming from these direct
exposures to foreign sovereigns.
19
Bank nationalities that have larger claims on the public
sectors of Greece, Ireland, Portugal and Spain as a percentage of their Tier 1 capital have
seen their CDS premia co-move more closely with the sovereign CDS premia of those four
countries (Graph 15, left-hand panel).
20
Uncertainties about the size of banks’ exposures to specific sovereigns can amplify funding
pressures. During the six months prior to the publication of the results of the CEBS stress
tests in July 2010, the CDS premia of individual EU banks were strongly correlated with the
sovereign CDS of Greece, Ireland, Portugal and Spain, regardless of the bank’s actual
exposure to those sovereigns (Graph 15, centre panel). After the bank-level data were
released, the correlation between bank and sovereign CDS more closely reflected individual
banks’ actual exposure to the weaker sovereigns, decreasing significantly for some banks
with little exposure (Graph 15, right panel; see also Box B: The impact of sovereign bond
holdings on bank risk).
19
See for example the analyses by Citigroup Global Markets (2011) and Goldman Sachs (2011).
20
This result should be regarded cautiously, given the limited number of observations on which it is based.
16
CGFS – The impact of sovereign credit risk on bank funding conditions
Graph 15
Bank CDS premia correlations and exposures to sovereigns in peripheral Europe
CDS premia correlations and
exposures to peripheral euro area
sovereigns
1
Before release of CEBS stress test
results
2
After release of CEBS stress test
results
2
–0.8
–0.6
–0.4
–0.2
0.0
0.2
0.4
0.6
0.8
1.0
0.05 0.10 0.15 0.20 0.25 0.30 0.35
R
2
= 0.356
–0.50
–0.25
0.00
0.25
0.50
0.75
1.00
50 100 150 200 250 300 350
Core European banks
Peripheral European
banks
–0.50
–0.25
0.00
0.25
0.50
0.75
1.00
50 100 150 200 250 300 350
Core European banks
Peripheral European
banks
1
For each country, the horizontal axis shows the banking sector’s consolidated claims on the public sectors of Greece, Ireland, Portugal
and Spain as a percentage of Tier 1 capital, averaged for the period Q1 2009−Q4 2010. Data for Belgian and German banks are on an
immediate borrower basis rather than an ultimate risk basis. The vertical axis shows the correlation between the average five-year CDS
premium for selected large banks, weighted by the banks’ total assets, and the CDS premia of Greek, Irish, Portuguese and Spanish
sovereign debt, weighted by GDP, for the period between 1 January 2009 and 31 March 2011.
2
Each point represents a European
bank. The horizontal axis shows the bank’s exposure to peripheral European sovereigns as a percentage of Tier 1 capital. The vertical
axis shows the correlation between bank CDS and a GDP-weighted average of sovereign CDS of Greece, Ireland, Portugal and Spain,
calculated using daily data between 1 January 2010 and 30 June 2010 for the centre panel, and between 23 July 2010 and 31 Octobe
r
2010 for the right-hand panel.
Sources: CEBS; Markit; BIS consolidated banking statistics.
Exposures through OTC derivatives transactions
Banks also have direct, on-balance sheet exposures to sovereigns through their market-
making role in over-the-counter (OTC) derivatives markets. Sovereigns often use OTC
derivatives to adjust the interest rate or the currency composition of their outstanding debt.
21
Banks are key counterparties in these transactions, and hence are exposed to sovereign risk
whenever the mark-to-market value of the derivative position is negative for the sovereign
and positive for the banks. Banks record derivatives transactions that have a positive market
value at a lower than face value on their balance sheets to reflect this inherent counterparty
risk (this is referred to as the credit valuation adjustment – CVA).
22
Increases in sovereign risk result in higher CVAs and a reduction in the market value of
banks’ derivatives transactions, and are reported as mark-to-market losses on their income
statement. The impact on banks is exacerbated by the fact that sovereigns (and other highly
rated entities) often use unilateral credit support annexes (CSAs), meaning that they do not
post collateral to offset mark-to-market losses on derivatives, but will receive collateral on
their mark-to-market gains. This negatively affects banks in two ways. First, banks’ mark-to-
market claims on sovereigns are uncollateralised, increasing their CVA risk. Second, if banks
hedge their derivatives positions with sovereigns using offsetting trades with other entities
21
Anecdotal evidence suggests that sovereigns’ derivative positions are sizeable. However it is impossible to
quantify the global value of these derivative positions, as only a very small number of sovereigns (including
Denmark and Sweden) publicly disclose data on their positions.
22
The CVA is the difference between the value of a derivative position (not taking into account counterparty
credit risk) and the value of the same derivative position adjusted for counterparty credit risk. The default
probability of a given counterparty is typically assessed using market measures of default risk such as bond
spreads or CDS premia.
CGFS – The impact of sovereign credit risk on bank funding conditions
17
that are covered by bilateral CSAs, then banks can face additional funding strains as they
need to post collateral in one transaction without receiving any reciprocal collateral in the
corresponding hedge transaction. Banks sometimes hedge themselves against sovereign
risk by buying CDS protection or short-selling government bonds, but depending on the
liquidity in these markets, this can push up sovereign risk premia and cause further CVA
losses.
Box B
The impact of sovereign bond holdings on bank risk
To assess whether sovereign exposures affect investor perceptions of bank risk (and hence bank
funding costs), we examined how the publication of banks’ holdings of government securities as
part of the EU-wide stress test affected banks’ CDS premia in the days surrounding the publication
date (23 July 2010). On that occasion, 91 banks released detailed information on their exposure vis-
à-vis 30 EU sovereigns. This very granular information was not previously available.
For the 52 banks whose CDS were available, the change in each bank’s CDS premium was
regressed on a proxy of the “surprise” at the bank’s combined holdings of Greek, Irish and
Portuguese (GIP) government bonds generated by the release of information on sovereign
portfolios.
The inclusion of this proxy is motivated by the fact that banks’ CDS premia likely already
incorporated an (imprecise) estimate of their sovereign exposures before the publication of the
tests. Thus, it can be argued that the change in spreads following the stress test was influenced by
the surprise component embedded in the information released on the publication date.
Results suggest that a larger surprise exposure vis-à-vis the GIP sovereigns is associated with
wider CDS premia. In particular, it is estimated that a surprise factor corresponding to 1% of bank
capital was associated with a 0.5−2% smaller reduction (or larger increase) in the CDS premium
after the test, depending on the specification of the equation and the time window chosen for the
event study.
This result is consistent with previous evidence on the potential adverse effects of
banks’ sovereign exposures. Gennaioli et al (2010) find that government defaults cause larger
contractions in the credit supply in countries where banks have larger holdings of public debt.
Borenstein and Panizza (2009) show that sovereign defaults are associated with banking crises, as
weakened bank balance sheets can lead to bank runs.
______________________
The “surprise” proxy is defined as the difference between each individual bank’s actual exposure to GIP
sovereigns as a percentage of its Tier 1 capital (from the CEBS stress tests), and that bank nationality’s
aggregate exposure to GIP sovereigns and the private sector as a percentage of aggregate capital (from
the BIS consolidated banking statistics). This second term represents the information available to markets
before the stress tests.
This analysis is complicated by the release of the updated Basel III rules on 26 July 2010, the next working
day after the release of the EU stress test results. The 0.5% value is based on a one-day event window,
while the 2% value reflects a three-day event window. The regressions include bank- and country-specific
controls.
3.2 The collateral/liquidity channel
Sovereign securities are used extensively by banks as collateral to secure wholesale funding
from central banks, private repo markets and issuance of covered bonds, and to back over-
the-counter (OTC) derivative positions. Increases in sovereign risk reduce the availability or
eligibility of collateral, and hence banks’ funding capacity, through several mechanisms. First,
when the price of a sovereign bond falls, the value of the collateral pool for institutions
holding that asset automatically shrinks. If the asset was already posted in specific
transactions, mark to market valuation of collateral could trigger a margin call. A downgrade
could even exclude a government’s bonds from the pool of collateral eligible for specific
operations or accepted by specific investors (eg foreign money market or pension funds).
18
CGFS – The impact of sovereign credit risk on bank funding conditions
Second, the haircuts applied to sovereign securities could increase.
23
The major
determinants of haircuts are collateral valuation uncertainty, market liquidity and credit risk
(CGFS (2010)). Sovereign bonds typically perform well on these dimensions, and so have
small haircuts. But in periods of sovereign stress, market operators might apply non-
negligible haircuts even to sovereign debt. Moreover, as sovereign bond haircuts often serve
as a benchmark for those applied on other securities, the impact on bank funding conditions
could be magnified through changes in haircuts on other securities.
24
Central bank funding
Provision of central bank liquidity (such as through open market operations) is typically
conducted through repurchase agreements or secured transactions. In the Eurosystem’s
refinancing operations, 20% of transactions are secured by government bonds (Graph 16,
left panel).
25
This share likely reflects the fact that a wide range of collateral instruments are
eligible with the central bank and that banks tend to use sovereign bonds in private repos,
where only very liquid collateral is accepted.
26
In the United Kingdom and Japan, 60-80% of
open market and standing facility operations are collateralised by government bonds.
In recent months, banks from severely affected countries (Greece, Ireland and Portugal)
have increased their use of Eurosystem liquidity and made greater use of domestic
government bonds or government-guaranteed bank bonds to collateralise this funding. This
was permitted by a modification of the rules on collateral acceptance by the Eurosystem,
which suspended the application of the minimum credit rating threshold for securities issued
or guaranteed by governments of countries that had obtained international financial support
and adopted a fiscal consolidation plan approved by the European Commission and the IMF,
in liaison with the ECB (ECB (2010a, 2011)).
Private repo markets
Private repo markets are a significant source of funding for banks. In the United States,
outstanding repos reported by primary dealers amounted to 35% of GDP in 2010.
27
Treasury,
federal agency and government-sponsored enterprise securities accounted for 75% of the
total collateral.
28
In the euro area, the amount of outstanding repos in June 2010 was
equivalent to 75% of GDP, with four fifths of the transactions collateralised by government
bonds (ICMA, 2010). In the United Kingdom, Bank of England data indicate that the gilt repo
market was equivalent to 35% of GDP in late 2010.
The private repo market is very sensitive to changes in the perceived riskiness of the
collateral. Only 1½% of transactions were collateralised by Greek, Irish and Portuguese
government bonds during the six months to December 2010, less than half the share in 2008
and 2009. This reflected sharp falls in the use of Greek and Irish collateral (Graph 16, centre
panel). The share of collateral other than government bonds issued in those countries also
23
Haircuts are the difference between the value of the pledged collateral and the cash loaned.
24
The impact of sovereign shocks on banks via funding liquidity can be reinforced if this triggers “liquidity
spirals”. See Brunnermeier and Pedersen (2009).
25
In the euro area, there is substantial variability across countries, with the shares ranging from 5 to 98%.
26
Cheun et al (2009) compare the ECB, Federal Reserve and Bank of England collateral framework.
27
This funding source is more important for dealers than for commercial banks. The above estimate includes
double-counting of repos and reverse repos. Hordahl and King (2008) estimate that in mid-2008 the size of the
whole market, including data reported by bank holding companies, was around $10 trillion (or 70% of GDP).
28
Based on the tri-party repos segment. This is a type of repurchase agreement for which a third party, called
the clearing bank, provides intermediation services to the cash investor and the collateral provider. See
Copeland et al (2010).
CGFS – The impact of sovereign credit risk on bank funding conditions
19
declined. In mid-2010, market participants were reluctant to lend to banks from countries
affected by sovereign tensions against collateral made up of their home sovereigns, as these
transactions entailed “two highly correlated risks” (ECB 2010c). Market tensions have also
affected haircuts on euro area government bonds; for instance, in November 2010
LCH.Clearnet, a leading clearing house, increased the haircuts on Irish government bonds to
45%, and in April 2011 it raised haircuts for Portuguese sovereign bonds. These haircuts
have subsequently been increased further, and were 75% and 65% respectively in June.
Covered bonds and OTC derivatives
Sovereign debt is widely used by banks as collateral in covered bond issuances. In 2008 and
2009, one third of the gross issuance of covered bonds in the euro area was backed by
government debt. For wholesale covered bonds – two thirds of the total – the share of
issuance backed by sovereign bonds had halved to 20% by late 2009, and has remained
around that level since then. This move mainly reflected a relative increase in the issuance of
mortgage-backed bonds from “core” euro area countries, which account for 70% of total
issuance in the euro area. Greek, Irish and Portuguese banks typically do not issue
sovereign-backed covered bonds on the wholesale markets.
Public sector bonds also have a role in OTC derivatives transactions: as of end-2010,
government securities accounted for $150 billion, or 17% of total delivered collateral (ISDA
(2011)); this share is little changed from that recorded at the end of 2008 and 2009.
Graph 16
Use of sovereign bonds in wholesale markets
Share of sovereign bonds in
collateral used for central bank
operations
Share of Greek, Irish and
Portuguese government bonds in
total collateral in the EU private repo
market
5
Covered bonds issued in the euro
area
0
20
40
60
80
100
2008 2009 2010 2011
United Kingdom
1
United States
2
Euro area
3
Japan
4
0
1
2
3
4
5
6
2007 2008 2009 2010
Ireland
Portugal
Greece
Total issuance
6
0
20
40
60
80
100
0
20
40
60
80
100
2005 2006 2007 2008 2009 2010
Total issuance (rhs)
7
of which: backed by
government debt
8
1
In per cent. Share of gilts, UK Treasury bills and Bank of England Bills in total sterling collateral.
2
In per cent. Share of US Treasury,
agency and agency-guaranteed securities in discount window collateral pledged by all depository institutions, including those without any
outstanding loans.
3
In per cent. Share of government bonds in total submitted collateral in Eurosystem refinancing operations.
4
In
per cent. Share of government securities and government-guaranteed bonds in total submitted collateral in Bank of Japan refinancing
operations.
5
In per cent.
6
All securities (both government and non-government) issued in Greece, Ireland and Portugal.
7
In
billions of euros. Comprises only wholesale issuance.
8
In per cent.
Sources: ICMA survey, December 2010; Dealogic; central banks.