International migration, remittances and rural development pot
Bạn đang xem bản rút gọn của tài liệu. Xem và tải ngay bản đầy đủ của tài liệu tại đây (1.47 MB, 83 trang )
International migration,
remittances and rural development
Enabling poor rural people
to overcome poverty
The opinions expressed in this document are those of the authors and do not necessarily represent
those of the Food and Agricultur
e Organization of the United Nations (FAO) and the International Fund
for Agricultural Development (IFAD). The designations employed and the presentation of material in this
publication do not imply the expression of any opinion whatsoever on the part of FAO and IFAD con-
cer
ning the legal status of any country, territory, city or area or of its authorities, or concerning the
delimitation of its frontiers or boundaries. The designations ‘developed’ and ‘developing’ countries ar
e
intended for statistical convenience and do not necessarily express a judgement about the stage
reached by a particular countr
y or area in the development process.
© 2008 by the International Fund for Agricultural Development (IFAD)
ISBN 978-92-9072-056-0
International migration, remittances
and rural development
Enabling poor rural people
to overcome poverty
Rosemary Vargas-Lundius
Guillaume Lanly
Policy Division
IF
AD
Marcela Villarreal
Martha Osorio
Gender, Equity and Rural Employment Division
FAO
THE AUTHORS
Rosemary Vargas-Lundius holds a doctorate in Development Economics from
Lund University, Sweden, and has carried out research on rural poverty,
unemployment, gender and migration. She is Policy Coordinator at the
International Fund for Agricultural Development (IFAD).
Marcela Villarreal is Director of the Gender, Equity and Rural Employment Division
of the Food and Agriculture Organization of the United Nations (FAO). She holds
a doctorate in Rural Sociology from Cornell University and has carried out
research on the linkages among rural poverty, food insecurity, gender, migration,
employment and HIV/AIDS.
Guillaume Lanly holds a doctorate in Geography, National and Regional
Development Planning from the University of Paris 3 – La Sorbonne Nouvelle. He
has conducted research on migration and development interactions in Latin
America and Africa and is currently an independent consultant.
Martha Osorio holds a master’s in International Relations from The Johns
Hopkins University and has carried out research on gender, food security,
migration and rural development. She is currently an independent consultant.
The authors would like to thank Siale Benvete, Tawfiq El-Zabri, Edward
Heinemann, Karim Hussein, Sana Jatta, Lenyara Khayasedinova, Sylvie Marzin,
Enrique Murguia, Fumiko Nakai, Kathleen Newman, Manuel Orozco, Francesco
Rispoli, Benoît Thierry, Ariko Toda and Pedro de Vasconcelos for reviewing an
earlier version of this publication. Jean-Philippe Audinet, Michael Hamp,
Zhimei Xu, Sanket Mohapatra, Jan Lundius, Rodolfo Lauritto, Gabriel Rugalema
and Libor Stloukal provided valuable input. Special thanks to Brett Shapiro,
Anna Sherwood and Lynn Ball for their editorial support, and Paul Hollingworth
for the design and layout.
This study is based on secondary sources from a desk review of literature,
policy papers, official surveys and studies, as well as interviews with migrants
and their relatives conducted for the IFAD/BBC documentary
Cash flow fever
(2005) and recent research carried out by FAO on migration issues. IFAD and
FAO do not guarantee the validity, accuracy and completeness of the
information provided. The designations and terminology employed and the
presentation of material do not necessarily imply an opinion on the part of IFAD
and FAO, nor do they represent IFAD or FAO partners’ views on migration,
r
emittances and development.
CONTENTS
ABBREVIATIONS AND ACRONYMS 5
INTRODUCTION 6
1. NATURE AND RECENT EVOLUTION OF MIGRATION 8
1.1 Brief historical considerations 8
1.2 Current migration trends 9
1.3 The human face – and the ‘feminization’ – of migration 11
1.4 Migration and transnationalism 12
2. WORLDWIDE REMITTANCES TO DEVELOPING COUNTRIES 14
2.1 Remittance trends 14
2.2 Variations in remittance behaviour 16
2.3 Formal versus informal channels for transferring funds 17
2.4 Cost of remittance transfers 18
3. POVERTY AND INEQUITIES: KEY DETERMINANTS OF CURRENT
OUTMIGRATION FROM RURAL AREAS 22
3.1 ‘Push factors’ in rural areas 22
3.2 How the current context facilitates migration processes 26
3.3 Migration as a household strategy 27
4. IMPACTS OF MIGRATION AND REMITTANCES ON RURAL DEVELOPMENT 30
4.1 Departure of rural women and men from rural areas:
the labour dimension 30
4.2 Impact of remittances on agriculture 32
4.3 Remittances, poverty alleviation and inequality in rural areas 34
4.4 Impact of remittances on health and education 36
4.5 Transnational communities and hometown associations 37
5. MOVING FORWARD: STRATEGIC DIRECTIONS 42
5.1 Banking the unbanked 42
– Increasing access to the financial system for remittance senders
and receivers 42
– Advent of microfinance institutions in the remittances market 44
5.2
Strengthening the diaspora-development link 47
5.3
Other for
ms of untapped capital as development oppor
tunities 50
3
4
6
. FUTURE CHALLENGES LINKING MIGRATION AND RURAL
DEVELOPMENT: CLIMATE CHANGE AND EMERGING DISEASES 52
6.1 Climate change and rural outmigration 52
– Impacts of climate change on agriculture and rural
livelihoods in developing countries 52
– Climate change and the threat of mass migration 53
6.2 Transboundary diseases 55
– Population movements and the spread of diseases 56
– Transboundary diseases and migration 58
7. IMPLICATIONS FOR FAO AND IFAD 60
8. CONCLUSIONS 64
ANNEX 1: SUMMARY OF PROJECTS FINANCED BY THE FINANCING
FACILITY FOR REMITTANCES 67
ENDNOTES 70
BIBLIOGRAPHY 72
FIGURES
1. International migrant stock from 1965 to 2005 10
2. Main countries of emigration 11
3. Remittances and capital flows to developing countries 16
4. Top remittance recipient countries, 2007 17
5. HIV vulnerabilities among mobile workers 59
TABLES
1. International migrant stock from 1965 to 2005 10
2. Regional distribution of international migrants 10
3. Remittance flows to developing countries 15
4. Facts and figures on migration and remittances for developing regions 20
5. Some examples of projected impacts of climate change on agriculture
in developing countries 53
5
ABBREVIATIONS AND ACRONYMS
AsDB Asian Development Bank
ATM automatic teller machine
BP Moroccan Banque Populaire
DFID Department for International Development (United Kingdom)
FAO Food and Agriculture Organization of the United Nations
FDI foreign direct investment
FFR Financing Facility for Remittances
GCIM Global Commission on International Migration
GTel GlobeTel Communications Corporation
HTA hometown association
IDB Inter-American Development Bank
IDP internally displaced people
ILO International Labour Organization
IME Institute of Mexicans Abroad
IOM International Organization for Migration
IPCC Intergovernmental Panel on Climate Change
IRnet International Remittance Network
MDG Millennium Development Goal
MFI microfinance institution
MIF Multilateral Investment Fund (IDB)
ODA official development assistance
OECD Organisation for Economic Co-operation and Development
SWIFT Society for the Worldwide Interbank Financial Telecommunication
UNDP United Nations Development Programme
UNFPA United Nations Population Fund
USAID United States Agency for International Development
6
Globalization and migration are rapidly transforming
traditional spheres of human activity. The work of
rural families is no longer confined to farming
activities, and livelihoods are increasingly being
diversified through rural-to-urban and international
migration. Age-old boundaries are breaking down.
Formerly isolated towns and villages in Latin
America and the Caribbean have come closer to
New York and Los Angeles than to the capitals of
their own nations. The same is true of the
relationship of certain areas of Africa and Asia to
metropolises such as Berlin, Johannesburg,
London, Paris, Singapore and Sydney. Development
organizations that support rural poor families in
overcoming poverty are realizing that essential
members of these families are making their living
abroad, far away from their dependants. The ‘global
village’ has become a reality. However, the poverty
that forced rural inhabitants to migrate still exists in
their places of origin and continues to influence their
lives and prospects in their ‘adopted countries’, as
well as those of the people they left behind.
Migration is significantly reshaping the traditional
social and economic structures of rural
communities, in both positive and negative ways.
In addressing rural poverty, one challenge is to
take these new social and economic realities into
consideration and integrate them into innovative
strategies for promoting rural development. The
complexities of the migration phenomenon must
be incorporated into the development agendas of
developed and developing countries, as well as
those of development or
ganizations.
The reasons for migrating are complex and vary
from area to area. Migration may be prompted by
major economic, demographic and social
disparities, as well as by conflicts, environmental
degradation or natural disasters. Regardless of
their origin and the causes of the relocation of
almost 200 million migrants worldwide, their
productivity and earnings constitute a powerful
force for poverty reduction. Remittances are the
financial counterpart to migration and are the
most tangible contribution of migrants to the
development of their areas of origin.
Mass migration movements are expected as a
result of climate change, while agricultural
production in many countries and regions,
including access to food, is projected to be
severely compromised. The areas suitable for
agriculture, length of growing seasons and yield
potential of some mainly arid areas are expected
to decrease. Episodes of heavy rainfall and
drought are likely to become more frequent and
severe, thus triggering further migration of those
already living under difficult conditions. Moreover,
the intense movement of people across regions
and countries may affect the growth of diseases
and pest management systems, thus putting
further pressure on food production and the
performance of agricultural systems at large.
Many migrants have established a continuous
social and economic interaction with their
communities of origin and play unique roles as
agents of change in both their countries of
settlement and of origin. Gover
nments, financial
institutions and international development
agencies can no longer afford to ignore the ever-
growing impact that financial flows from migrants
have on the economic and social development of
remittance-receiving countries. They also need to
focus on how migration can positively influence
Introduction
7
the achievement of the development targets set
by the Millennium Development Goals (MDGs).
Even if the majority of the world’s poor people will
continue to live in rural areas for the foreseeable
future, more than half the world’s population is
already living in urban areas, and nearly 70 per cent
is expected to be urban by 2050 (when the world’s
population is expected to reach 9.2 billion). These
facts make it impossible to address rural
development as a phenomenon isolated from
urban expansion and migration.
A resolution on international migration and
development was adopted by the United Nations
General Assembly in 2004. It calls upon all relevant
entities of the United Nations system – and other
relevant intergovernmental, regional and
subregional organizations – to adopt policies and
undertake measures to reduce the transfer costs of
migrant remittances to developing countries.
Further, one item of the action plan to achieve the
MDGs, agreed upon at the 2004 Group of Eight
(G8) Summit, is to facilitate remittance support to
families and small businesses. In 2007, the First
Global Forum on International Migration was
organized, with the participation of 155 countries.
The forum is a global process designed to enhance
the positive impact of migration on development
(and vice versa) by adopting a more consistent
policy appr
oach, identifying new instruments and
best practices, exchanging know-how and
experience and establishing cooperative links
among the various actors involved. Participating
governments agreed that migration should not
become an alternative to national development
strategies in developing countries. Neither should it
become a substitute for commitments to
development by donor countries. There is a need
to analyse and address the development
challenges of regions with high outmigration
pressures in order to ensure that people are not
driven to migrate out of necessity and despair.
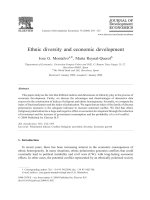
This paper analyses the root causes of rural
outmigration, focusing on its economic and social
implications. It takes as its starting point the fact
that mobility is inherent in human existence.
Livelihoods and sociocultural changes are
intimately connected with population movements.
To understand present and fast-developing trends
in human mobility, we examine the origins of
migratory movements and discern how such
transformations actually affect the natural resource
base, as well as how they shape livelihoods and
socio-economic/cultural coexistence. The main
body of the paper presents an overview of
migration and remittance flows, the role of financial
institutions in leveraging remittances and the role
of the diaspora in the development of communities
of origin. Finally, the paper presents a discussion
of future challenges linking migration to climate
change, as well as the impact of transboundary
diseases on agriculture and rural development.
Even if the majority of the world’s poor people will continue to live in rural areas
for the foreseeable future, more than half the world’s population is already living
in urban areas, and nearly 70 per cent is expected to be urban by 2050
8
1.1 Brief historical considerations
Migration is the movement of people from one
place to another. As long as Homo sapiens have
existed, members of the species have migrated in
search of food or to escape from disasters or
conflicts. Population movements have been
frequent during every epoch. They have often been
gradual and related to the search for better
livelihoods, lasting for a thousand years – the
Bantu expansion in Africa – or for more
concentrated periods – the few hundred years of
the so-called ‘barbarian’ population movements in
Europe, which peaked from the third to eighth
centuries. These were followed by the
Ostsiedlung,
in which central Europeans constantly moved
eastwards from the eighth century onwards.
Turkish, Arabic and Mongol expansions and
conquests have changed demographics and
cultures in Asia, Europe and Africa, often very
rapidly, and the same is true, for example, of the
Inca conquests in Latin America. While Europeans
and chattel slaves were arriving on the American
continents from the sixteenth to the nineteenth
centuries, South-East Asia received approximately
50 million migrants, mainly fr
om India and souther
n
China. However
, it was not until the early twentieth
century that a system of nation states, passports
and visas was developed to regulate the flow of
people across borders (Torpey 1999).
The last century has witnessed new, massive
population movements due to inter
nal and nation-
state conflicts. Some examples: in 1923, 2 million
Turks and Greeks moved in opposite directions,
most of them forced to become refugees. Three
years after Indian independence in 1947, more than
7 million Muslims had entered Pakistan and more
than 7 million Hindus and Sikhs had left Pakistan
for India. In 1994, 2 million Rwandans left their
country (mainly ethnic Hutus), and 500,000 mainly
ethnic Tutsis had been massacred during the three
preceding months. At present, there are
approximately 8.4 million refugees and 7 million
internally displaced people (IDP) in the world.
1
One of the most spectacular population
movements, which still affects the modern world,
was the transatlantic slave trade from the mid-
sixteenth century to the 1820s. The forced and
violent transfer of millions of Africans has had an
important impact on the composition of the
American population. Towards 1818 almost half
the Brazilian population (4 million inhabitants) was
composed of slaves. Today it is estimated that
some 40 million people in the Americas and the
Caribbean are descended from African slaves
(Stalker 2007).
Europe has traditionally been a source of overseas
migrants, with over 60 million people leaving the
continent from 1820 to 1914.
2
The last two
centuries experienced two main waves of
European migration. The first occurred from 1846
to 1890, when some 17 million people left Eur
ope.
About 3.5 million Germans moved from their
territories, pressed by rural poverty and periodic
crop failures. Nearly 8 million people from the
British Isles also abandoned their lands during this
period. While some of them were pushed by the
industrialization pr
ocess, others left due to famine
and emergencies, such as the Irish potato famine
of 1845-1849. The destruction of potato crops by
the late blight of potato in 1845, inadequate
agricultural practices and an inappropriate reaction
by British economic policy plunged the economy
Nature and recent evolution
of migration
1
9
and the Irish population into an unprecedented
crisis. As a consequence, from 500,000 to
1 million people died, and 1 million emigrated to
Great Britain and the United States or moved
internally (Hatton and Williamson 2004, 17).
The second wave of migration occurred from 1891
to 1920, when 27 million people left, particularly
from southern and eastern Europe. Although
migration continued until the Second World War,
after the First World War the pace of movements
diminished significantly (Stalker 2007).
Nevertheless, the Second World War was
connected with unprecedented mass death
3
and
huge population movements, such as the forced
migration of ethnic Germans after the war, which
resulted in the transfer of 13.5-16.5 million people
(Overy 1996, 111).
After the conclusion of the Second World War,
central and western European countries adopted
policies to attract labour (guest worker programmes)
for reconstruction of the devastated economies.
Millions of workers from southern European
countries that had been slower to industrialize
(Greece, Italy, Portugal, Spain and Yugoslavia), as
well as workers fr
om T
urkey and the countries of the
Maghreb region, moved towards economically
expanding areas (Meissner et al. 1993).
1.2
Current migration trends
The number of inter
national migrants is at an all-
time high (table 1 and figure 1). The presence of
such migrants in industrialized countries more than
doubled between 1985 and 2005, fr
om almost
55 million to 120 million (Martin and Zürcher 2008,
3). Statistics from the International Organization for
Migration (IOM) indicate that in 2005 192 million
people (3 per cent of the world’s population) were
living outside their countries of origin.
4
In the mid-1960s, migration began to be
dominated by a South-North flow (Sutcliffe 1998,
59-65). In the period 1960-1975, the stock of
migrants in industrialized countries in the North
was 2 per cent, during 1975-1990 it had increased
to 2.9 per cent, and reached 3 per cent during
1990-2005. Developing countries experienced an
increase of 0.2 per cent during the period
1960-1975, a peak increase of 2.6 per cent during
1975-1990, and a more modest 0.5 increase
during 1990-2005.
5
In 2005, Europe had 64.1 million immigrants within
its borders, Asia 53.3 million and North America
44.5 million (table 2).
In 2005 the World Bank estimated that the number
of emigrants from sub-Saharan Africa reached
15.9 million, 63.2 percent of whom have moved to
countries within the region. Equivalent figures for
East Asia and the Pacific were 19.3 million, for
South Asia 22.1 million, for Europe and Central Asia
47.6 million, for Latin America and the Caribbean
28.3 million and for the Middle East and North
Africa 12.9 million (W
orld Bank 2008).
The number of both source and destination
countries has also increased. Using a sample
152 countries, the International Labour
Or
ganization (ILO) found that from 1970 to 1990
the number of countries classified as destinations
for labour migrants had incr
eased from 39 to 67,
while the sending countries had incr
eased fr
om
29 to 55 (Stalker 2000). However, the majority of
international immigrants were still concentrated in
10
a
few nations. In 2005, 28 countries accounted for
75 per cent. Among them, 11 leading
industrialized countries accounted for 42 per cent
of international migrants, with the United States
receiving 20 per cent. The main countries of
emigration were the Russian Federation, Mexico,
India, Bangladesh, Ukraine, China, the United
Kingdom of Great Britain and Northern Ireland,
Germany, Kazakhstan, Pakistan, the Philippines,
Italy and Turkey (figure 2).
6
An increasing number of people are moving
between developing countries or internally. South-
South migration is nearly as large as South-North
migration. Approximately 74 million or nearly half the
migrants from developing countries reside in other
developing countries. Intraregional and domestic
migration in developing countries is often far more
important than overseas migration in terms of the
number of people involved, especially from rural
areas. Almost 80 per cent of South-South migration
is estimated to take place between countries with
contiguous borders, and most appears to occur
between countries with relatively small differences in
income (Ratha and Shaw 2007, 3-11). Since
benefits tend to be lower and risk of exploitation
greater, interregional migration in developing areas is
likely to have developed as the only option for
people affected by deep poverty, internal conflicts or
natural disasters (ibid, 2).
South-South flows also involve migrant labour
admitted on a temporary basis by rich developing
countries experiencing labour shortages, such as
the oil-rich countries of the Near East
7
or the newly
industrializing economies of South-East Asia.
Although it is impossible to obtain completely
reliable figures related to illegal migration, all
indications asser
t that it is on the rise. A r
ough
estimate of the share of unauthorized immigrants
in the world’s immigrant stock places it at
15-20 per cent of the total, suggesting
30-40 million immigrants. The United States has
the largest number of undocumented immigrants –
10-11 million or 30 per cent of its total for
eign-
born population. In Europe, undocumented
immigrants are estimated at 7-8 million, although
the number fluctuates in accor
dance with
regularization programmes (Papademetriou 2005).
International migrant stock from 1965 to 2005
World migrant stock
(million people)
78
81
87
99
111
1
55
1
65
1
77
191
1965
1970
1975
1980
1985
1
990
1
995
2
000
2005
Year
2.3
2.2
2.1
2.3
2.2
2
.9
2
.9
2
.9
2.9
%
of total
population
Table 1
Regional distribution of international migrants
2000
migrants
(million)
5.0
40.4
58.2
50.3
6.3
16.5
Oceania
North America
Europe
a
Asia
Latin America
and the Caribbean
Africa
Region
Table 2
% of
regional
population
16.3
12.8
8.0
1.4
1.2
2.0
2005
migrants
(million)
5.0
44.5
64.1
53.3
6.6
17.0
% of
regional
population
15.2
13.5
8.8
1.4
1.2
1.9
a
Including former USSR republics.
Source: United Nations (2006b).
Sources: United Nations 2006b.
0
50
100
150
200
1965 1970 1975 1980 1985 1990 1995 2000 2005
Figure 1
International migrant stock from 1965 to 2005
(million people)
Sources: United Nations 2006b.
I
NTERNATIONAL MIGRATION, REMITTANCES AND RURAL DEVELOPMENT
11
1.3 The human face – and the
‘feminization’ – of migration
International migrants include rural and urban
women and men with different socio-economic
profiles and ages. Some are highly educated and
specialized people (whose migration is referred to
as ‘brain drain’). Some are poor people for whom
migration is a subsistence strategy. The United
Nations Population Fund (UNFPA) estimates that
the typical profile of migrants comprises young
women and men from 15 to 35 years of age,
8
generally belonging to medium and low socio-
economic groups, but not to the poorest segments
of society (Hatton and Williamson 2004, 1-30).
Although it is often presumed that the majority of
international migrants are men, women comprise
approximately half (Zlotnik 2003). Moreover, there
is a general trend towards a ‘feminization’ of
international migration. Women’s participation in
migration has been shifting over time, along with a
recognition of the role they play as economic
agents. They have been migrating en masse over
the last 50 years. By the early 1960s, they already
accounted for 46.8 per cent of migrations, but it
was not until recently that their substantial role as
active agents has been acknowledged to a greater
degree (United Nations 2006b; UNFPA 2006).
Women currently constitute 49.6 per cent of global
migratory flows, although the proportion varies
significantly by country and may in some cases be
as high as 70-80 per cent. While there has been no
major overall change in the percentage of women
and men moving internationally, there have been
changes in patterns of migration – with more women
migrating independently and as main income-
earners, instead of following men relatives (United
Nations 2005a). In countries of the Organisation for
Economic Co-operation and Development (OECD),
family reunion still remains the chief vector of female
immigration (50-80 per cent of the total for this
category) (OECD 2002, 8). However, in recent years,
women have for
med an incr
easing pr
opor
tion of
employment-related migration and refugee flows.
The 2000 United States Decennial Census found
that there were more men than women
immigrants from El Salvador, but more women
RUS
Main countries of emigration
(million emigrants)
Figure 2
MEX
IND
BGD
UKR
CHN
GBR
DEU
KAZ
PAK
PHL
ITA
TUR
AFG
MAR
UZB
USA
EGY
POL
12.1
1
0.1
9.1
6.8
5.9
5.8
4.2
4.1
3.6
3.4
3.4
3.3
3.0
2.6
2.6
2.3
2.2
2.2
2.1
Sour
ce: Development Resear
ch Centr
e on Migration, Globalisation
and Poverty (DRC 2007).
12
t
han men immigrants from the Dominican Republic.
Migration from India to the United States is
dominated by men, while immigration from China
and the Republic of Korea to the United States is
dominated by women (Morrison et al. 2007, 1-10).
Since 2000, the number of women migrants has
been surpassing men migrants in East and South-
East Asia (Zlotnik 2003). In Africa and the Middle
East, there are also indications that the number of
women migrants is increasing significantly. In many
parts of Africa, the weakening of traditional values
and authorities is making migration a socially
acceptable way for women to support their families
in a context of declining need for farm labour (Tacoli
2002; Adepoju 2005). In Gulf countries, men
migrants are clearly the overwhelming majority,
although women from Indonesia, the Philippines
and Sri Lanka are increasingly playing important
roles (Lucas 2005, 1-18).
In some countries, the possibility of women
migrating may be influenced by religious and other
sociocultural constraints. A study of Asian migration
demonstrated that while women dominate migration
flows from countries such as the Philippines and
Sri Lanka, sociocultural factors in countries such as
Bangladesh and Pakistan apparently limit female
emigration (Battistella 2003, 1-33).
While highlighting the fact that women migrants may
become ‘empowered’, one also has to keep in
mind that migrating abroad for many women means
facing long working hours, increased financial
obligations (including remittances to relatives left
behind) and new family responsibilities (e.g. raising
their children in the country of settlement or dealing
with guilt and worry for having left their children
behind with relatives), as well as acculturation issues
(including discrimination).
When the men of a household migrate (especially
heads of families), the effects on women relatives
left behind can be negative, in particular for
spouses or par
tners. Even with the ar
rival of
remittances to the village and the growth of the
local economy, women do not always benefit
substantially. Newly created jobs are often primarily
for men, while women tend to be stuck in
traditional forms of employment (Baver 1995, 7).
Often, women have to step in, doing more work
a
nd taking on traditionally male chores. For
example, in the agriculture sector in many Central
American and Caribbean countries, certain
agricultural activities have become female-
dominated.
9
Although the ‘feminization’ of
agriculture in these countries could be seen as a
positive trend, it is important to recognize that rural
women must still carry out household and family
responsibilities in addition to the agricultural chores.
As a result, their daily workload has increased.
10
By the nature of the work they undertake abroad,
women may be particularly vulnerable.
11
To a
greater degree than men, women tend to face
harder and more precarious conditions in receiving
countries, especially if they are illiterate, unfamiliar
with customs and language in the host country,
and lack any marketable skills.
Gender is also a key factor when considering the
likelihood of remittances being sent and received.
A 2004 survey of remittance recipients in the
Dominican Republic demonstrated that 57 per cent
of the remittance recipients were women, while
58 per cent of the remittance senders were
women, thus implying that transfers to a large
extent were made by a woman to a woman
relative (IDB-MIF 2004b). In general, Dominican
women migrants abroad send more remittances to
their relatives than do men migrants.
12
The same conclusion was found in other migrant
populations, such as Tongan and Samoan
migrants in New Zealand and Australia, among
whom non-remitters were much more likely to be
men (Connell and Brown 2004). It is argued that
women throughout the Pacific have a much
better understanding of household needs than
men, and are more likely to respond to those
per
ceived needs. The fact that women ar
e mor
e
reliable senders of remittances can also be
explained by social structures in which women
have greater responsibility for household chores.
1.4 Migration and
transnationalism
Constant and increasing movements of people
across the globe are creating new forms of social
arrangements and organizations and socially
I
NTERNATIONAL MIGRATION, REMITTANCES AND RURAL DEVELOPMENT
13
c
onstructed self-identities. ‘Transnationalism’ is a
concept that is increasingly used to capture the
nature of today’s cross-border movements and
their outcomes.
A growing trend in transnational social
movements is the joint efforts of migrants to
maintain and foster links with their places of
origin through the creation and organization of
‘hometown associations’ (HTAs). HTAs are
established not only in response to the social and
cultural challenges faced by new immigrants in
adjusting to life in a foreign country, but also to
fund small-scale development projects in home
communities through collective remittances.
13
They are philanthropic units formed by
immigrants, who seek to support their places of
origin, maintain relationships with local
communities and retain a sense of community
while they reside in foreign countries (Orozco
2000; Orozco 2003b; Merz 2005).
HTAs are active throughout major migrant
destinations, such as parts of eastern Asia, Europe
and the United States. Although the total number
of such organizations is unknown, as they change
in number annually, there is evidence that they
have multiplied in recent years. For example,
12 formal Senegalese immigrant associations were
identified in France in 1984. Six years later,
195 HTAs from the same country were registered
as non-profit organizations, and by the end of the
1990s, it was estimated that there were more than
400 Senegalese HTAs in France (Daum 1995).
Mexican HTAs number approximately 3,000.
Filipino groups may amount to 1,000, and there
are about 500 Ghanaian HTAs worldwide (Orozco
and Rouse 2007).
H
owever, it must be kept in mind that HTAs are
only one of several options through which
diasporas maintain links with and help their
communities of origin. Immigrant entrepreneurs are
also ‘social actors’, who participate actively in
transnational activities. Several case studies have
examined how small and medium entrepreneurs in
Africa, Asia and Latin America continuously affiliate
with partners or clients in Europe, Saudi Arabia
and the United States, creating social networks
that benefit migrants, as well as the communities
they left behind and the ones they belong to in
receiving countries. For example, in the Dominican
Republic, there are hundreds of small- to medium-
sized transnational enterprises (including small
factories, commercial/retail establishments and
financial agencies). Such ventures are created and
run by former migrants, who have returned to the
Dominican Republic after acquiring capital and
establishing ties with migrant communities in the
United States, thus acquiring clients and investors
abroad. Similar scenarios can be found in other
parts of the world. In Viet Nam, for example,
1,274 projects and businesses have been set up
by overseas Vietnamese, with a registered capital
of US$710 million (for a more in-depth discussion
of transnationalism and HTA, see section 4.5)
14
Migrants send money back to their country of
origin in a variety of ways. Where available, they
may use formal channels such as banks and
money transfer services. In other instances they
may use informal channels, carrying money home
or sending cash and in-kind goods home with
returning migrants. For a variety of reasons,
remittances are extremely difficult to measure. On
the one hand, official figures may underestimate
the size of remittance flows because they fail to
capture informal transfers. However, overcounting
occurs as well, as other types of monetary
transfers – including illicit ones – cannot always be
distinguished from remittances. Moreover,
remittances may also be transferred via a third
country, complicating estimates of remittance data
by the source and destination countries. Thus
remittance figures are general estimates at best,
but new estimates do demonstrate the enormous
impact that remittances from developed countries
and rich countries have on developing countries.
2.1 Remittance trends
The inflow of remittances can be taken as an
indicator of the economic relevance of migration.
Remittances have gr
own at an extraor
dinary pace
over the last decade. According to World Bank
data, global remittances have increased from about
US$30 billion annually in the early 1990s to an
estimated US$318 billion in 2007.
14
Some 75 per cent
of this amount is directed towards lower middle-
income and low-income developing countries.
Recorded remittances constitute nearly two thirds of
foreign direct investment (FDI) flows and more than
double official aid flows to developing countries.
From 2002 to 2007, remittances to developing
countries increased by 107 per cent (table 3). Much
of this increase occurred in low- and middle-income
countries. In 2005 it was estimated that
approximately 500 million people (8 per cent of the
world’s population) were benefiting from remittances.
Latin America and the Caribbean, East Asia and the
Pacific, and South Asia obtain the largest shares of
international remittances. According to 2007
estimates, these regions received, respectively,
25, 24 and 18 per cent of all official international
remittances to developing countries. By contrast,
sub-Saharan Africa received less than 5 per cent of
all official international remittances (Adams 2007, 3).
The strong rise in remittance flows over the past
several years is the result of increased migration,
but can also be explained by increased
competition in the remittances market, lower
transfer costs, more remittances diverted into
formal channels, and an improvement in the
reporting of data in many developing countries.
Worldwide, remittances have become the second
largest capital inflow to developing countries after
FDI and before official development assistance
(ODA) (figure 3). In some countries, remittances
have even surpassed the levels of FDI and ODA.
Accor
ding to the Multilateral Investment Fund (MIF)
of the Inter-American Development Bank (IDB),
remittances to Latin America and the Caribbean
r
eached $66.5 billion in 2007, an incr
ease of
7 per cent over 2006. During a year of economic
growth across the region, migrant workers sent
home one third more than net FDI, and more than
ten times ODA, making 2007 the fifth year in a row
that remittance inflows topped the combined sum
of FDI and ODA to the r
egion (IDB-MIF 2008).
Worldwide remittances
to developing
countries
2
15
In absolute figures, the five top remittance
receivers in 2007 were India (US$27 billion),
China (US$25.7 billion), Mexico (US$25 billion),
the Philippines (US$17 billion) and France
(US$12.5 billion) (figure 4). As with many other
developed countries (e.g. Germany and the United
Kingdom, although to a lesser extent), France
receives a significant amount of remittances from
workers resident in other European countries.
15
For many poor countries remittances are the
largest source of external financing. The remittance
inflow is significant for several countries, and
critical for some, as it makes up a r
elevant
percentage of GNP and export earnings.
According to World Bank data, remittances
represent more than 50 per cent of GDP in Haiti
and 15-20 per cent in El Salvador, Honduras and
Jamaica. In the Dominican Republic, Guatemala
and Nicaragua, remittances make up
10-12 per cent of GDP. The importance of
remittances can also be measured by comparing
them with other private capital flows. In
Guatemala, Honduras, El Salvador and the
Dominican Republic, remittances are equivalent,
respectively, to 14, 4, 3 and 2 times FDI flows.
Even in Colombia and Ecuador, where remittances
ar
e lower in r
elative ter
ms, they r
epr
esent,
r
espectively, 197 and 112 per cent of FDI
(Özden and Schiff 2007, 64).
Remittance flows to developing countries
(US$ billion)
2002
29
14
28
15
24
5
116
East Asia
and the Pacific
Europe and
Central Asia
Latin America
and the
Caribbean
Middle East
and North Africa
South Asia
Sub-Saharan
Africa
Developing
countries
Table 3
Change
2006-2007
(%)
Figures for 2007 are estimates.
Source: Ratha et al. (2007).
2003
35
17
35
20
30
6
144
2004
39
21
41
23
29
8
161
2005
47
29
49
24
33
9
191
2006
53
35
57
27
40
10
221
2007
58
39
60
28
44
11
240
Change
2002-2007
(%)
10
10
6
7
10
5
8
97
175
115
86
81
116
107
16
2.2 Variations in remittance
behaviour
Not all migrants send remittances. In order to
understand the variations in remittance behaviour,
it is useful to consider various characteristics of the
sender, such as age, gender, occupation, length of
stay, and educational and income levels. The
amount depends on the migrants’ family situation
and tends to be higher when ties are closer.
Migrants who remit the most (and most often) are
generally of working age, have children or parents
remaining in their countries of origin and have
stayed in the country of settlement long enough to
earn sufficient income to both support themselves
and be able to remit something (Hugo 1998).
When a migrant is joined by his/her family, the
likelihood of remitting generally decreases. A
study on Senegalese migrants in France noted
that unmarried migrants tend to remit more than
migrants who have their families with them. The
same assessment has been made of immigrant
communities in the United States (DeSipio 2000;
Lanly 2004). Remittances are also dependent on
the educational and salar
y levels of the r
emittance
sender. For example, among Mexican immigrants,
higher education and salary seem to correlate
with a lower likelihood of r
emitting, while migrants
whose incomes incr
ease modestly (earning more
than the lowest earning levels of recently arrived
migrants) are more likely to remit (DeSipio 2000).
A
study on remittances by Tongan and Samoan
nurses from Australia reveals that although they
remit more per capita, they are less generous than
others in terms of the proportion of income
remitted, and this proportion falls steadily as their
income level increases (Connell and Brown 2004).
This may be explained by the fact that once a
migrant has achieved a certain target level of family
support, remittances no longer rise with income.
Visa, residency or citizenship status also influence
remittance behaviour. For example, studies of
Philippine and Vietnamese migrants indicate that
undocumented migrants remit more regularly than
legal ones (Groupe Agence Française de
Développement 2004, annexes 20, 48, 54;
Bagasao et al. 2004, 16-17). Moreover, living
conditions in the host country, as well as the cost
of living, are also important determinants of
remittance behaviour.
The typical amount remitted per transaction by
international migrants ranges from US$100 to
US$1,000 (Sander and Maimbo 2003, 16).
According to the World Bank (2004), the global
average transaction value is US$200.
Migrants make significant sacrifices to send an
average of US$200 eight or more times per year
to their home country. Several studies indicate
that permanent migrants send about 15 per cent
of their salary home, whereas temporary migrants
may remit up to 50 per cent of their income
(USAID 2002, quoted in Sander 2003a, 8). For the
average Latin American or Caribbean migrant in
the United States, who earns less than
US$25,000 per year, remittances may account for
nearly 10 per cent of his or her income (Orozco
2002b, 7). Migrants with low income are often
mor
e committed to sending higher per
centages
than better-off migrants. Thus many of them remain
marginalized in the host country and have limited
possibilities to invest in their own well-being.
Remittances and capital flows
t
o developing countries
Figure 3
3
75
275
175
75
-25
US$ billions
P
rivate debt and
portfolio equity
FDI
Recorded
Remittances
Official
Development
A
ssistance
1990
1991
1992
1993
1994
1995
1996
1997
1998
1999
2000
2001
2002
2003
2004
2005
2006
2007
Figures for 2007 are estimates.
S
orces: Global Economic Prospects 2006: Economic Implications of
Remittances and Migration (World Bank), World Development Indicators 2008
a
nd Global Development Finance 2008.
475
2.3 Formal versus informal
channels for transferring funds
Migrants have various options for sending
remittances: money transfer companies (Western
Union, MoneyGram, etc.) or credit card
companies; regular mail service; financial transfers
through banks, credit unions or the various transfer
options offered by companies (e.g. supermarkets
or through mobile phones); informal channels such
as couriers, or more sophisticated channels such
as the ‘Hawala’ and ‘Hundi’ transfer systems;
1
6
or
hand-carried by migrants themselves.
Where the financial sector is missing, weak or
mistrusted, people tend to use informal money
transfers, while in stronger, liberalized economies,
they trust the formal sector. Despite recent efforts
to convince migrants to use authorized financial
channels, many continue to use informal ones.
Banking the ‘unbanked’ – that is, reaching out to
those who lack ready access to banking services
– is a key factor in any effort to bring about a shift
from informal to formal financial institutions among
remittance senders and receivers (Inter-American
Dialogue 2004, 14).
17
Informal money transfers are very common among
low-income groups in Africa and Asia. The Hundi and
Hawala transfer systems are particularly important
in Bangladesh and the Sudan. Forty per cent of all
remittances are routed through the Hundi system
in Bangladesh, and it has been estimated that the
Hawala system provides up to 85 per cent of
Sudanese remittances. Conversely, Latin American
and Caribbean migrants mainly use formal
channels. Partly due to the rapid growth of the
volume of remittances in the 1990s, services for
transferring remittances have expanded and
diversified (IDB-MIF 2004a, 13-14). This is
especially true in the non-bank financial institution
sector
. Money transfer companies, such as
Western Union, handle the majority of remittances
from the United States to Latin America and the
Caribbean. A 2003 study found that 70 per cent
of all r
emittances wer
e wire transfers, and
only 17 per cent of all remittance senders from
the United States to the Latin American and
Caribbean region use informal channels
(Suro 2003, 6-8).
I
NTERNATIONAL MIGRATION, REMITTANCES AND RURAL DEVELOPMENT
17
India
Top remittance recipient countries, 2007
Figure 4
China
Mexico
Philippines
Spain
Belgium
Germany
U.K.
Romania
Bangladesh
Pakistan
Indonesia
Egypt
Morocco
Lebanon
Poland
Vietnam
Serbia and
Montenegro
Colombia
27.0
25.7
2
5.0
17.0
12.5
8.9
7
.2
7
.0
7.0
6.8
6.4
6.1
6.0
5.9
5.7
5.5
5.0
5.0
4.9
France
Brazil
4.6
Guatemala
4.5
Russia
4.1
Portugal
4.0
El Salvador
3.8
Austria
3.6
Nigeria
3.5
Dominican
Republic
3.3
Ecuador
3.2
3.2
Australia
Source: World Bank (2008, 12).
3.1
18
2.4 Cost of remittance transfers
Globally, the average cost of sending remittances
was about 12 per cent of their value in 2004
(World Bank 2006, 137). However, costs may
range from a low of 0.2 per cent to about
20 per cent, depending on the remitted amount,
type of service used, destination and transfer
location. Costs tend to be highest for small
transactions, since most transfer services charge a
minimum fee.
A comparative study of the transfer costs to
11 low-income countries in Africa, Asia and
Europe demonstrated that banks have become
considerably cheaper than international money
transfer companies over the last several years.
The mean value of remitting through banks was
7 per cent, compared with 12 per cent for
companies such as Western Union (Orozco
2003c, 9). A recent study of the corridors
between France and the Comoros, Mali, Morocco
and Senegal shows that money transfer costs are
still quite high. The cost of transferring
€ 300 varied from € 10 to € 29. Bank transfer
was the cheapest, while transfer through Western
Union was the most costly (BAfD 2007, 27). A
survey of 84 firms offering remittance transfers
from the United States to 14 Latin American
countries shows that the average cost of sending
US$200 in remittances was 7.6 per cent of the
amount transmitted.
18
Average transaction costs
of sending money to Latin America and the
Caribbean have dropped by half since 2000,
largely due to stronger competition and the
adoption of new technologies among service
providers (Suki 2007, 22-23).
Although there has been a general decline in the
cost of remittances, overall they remain grossly
overpriced. In addition to the inter
national money
transfer fee, remittance senders are often faced
with other costs, such as check-cashing and
conversion fees. The cost becomes higher for
r
emittance r
eceivers in rural areas because of the
long distances they have to travel to collect the
money (Orozco 2004a, 15-16). Recipients also
often pay a fee to collect the funds or are faced
with unfavourable exchange rates.
G
overnments, intergovernmental organizations and
community-based organizations are currently
involved in efforts to lower the cost of remittance
transfers. As more banks and credit unions
become involved and extend their services to
migrant communities and their rural communities
of origin, costs will most likely continue to
decrease. However, it is important that migrants
and recipient communities gain a better
understanding of the various options for remitting
and receiving. In particular, migrants and recipient
communities need access to local financial
institutions, not only because of the lower
remittance costs, but also because of the greater
opportunities to initiate or increase their savings
and their access to other financial services such as
housing loans.
New technologies may also help lower the cost of
remittance transfers and allow migrants and their
families at home to send and receive remittances
with greater ease. One of the popular techniques
in the Americas is the use of automatic teller
machine (ATM)/debit card transfer services, which
are being offered by a growing number of private
banks. When migrant workers enrol in such
programmes, they are issued a debit card to be
used by a designated person in the home country.
The cost of this type of transfer can be less than
half the cost of a traditional transfer (Johnson and
Sedaca 2004, 11).
One type of money transfer service that is
expanding quickly uses the Internet, offering
mostly online-to-offline transactions. The sender
processes a transaction over the Internet, using a
credit card or bank account number, while the
recipient collects the payment through traditional
mechanisms: cash payouts, bank accounts or
debit car
d accounts. The r
each of this type of
transfer service will continue to expand, but it is
still limited by access to the Internet and to
financial service infrastructure such as bank
branches or A
TMs.
Mobile phones hold the greatest promise for Africa
and remote corners of Asia and Latin America.
For example, the G-Cash pr
ogramme of GlobeT
el
Communications Corporation (GTel) is a Philippine
I
NTERNATIONAL MIGRATION, REMITTANCES AND RURAL DEVELOPMENT
19
s
ervice using short-message-service (SMS) to
execute transactions and cash centres to pay out
the funds received. Text messages are used both to
initiate transfers and notify senders and recipients
of successful transfers.
19
As of March 2006, there
were 1.3 million registered G-Cash users (USAID
and DFID 2007). The outreach opportunities for
mobile-phone-based transfer and payment
services are rapidly increasing in Africa.
20
Enabling remittances and payments through
technologies such as mobile phones has several
advantages for poor people: it eliminates the need
for costly travel to the nearest bank; it can include
international as well as domestic transactions; it
can reach rural areas; it is a near-instantaneous
transfer mechanism; and it allows transactions in
small denominations. The key impediments to
mobile communications as deliverers of remittance
services, however, are security and regulation.
Governments must be convinced that transaction
processes are secure, both for individual
consumers and for the system overall (USAID and
DFID 2005).
A
n example of how the creation and strengthening
of financial institutions in rural areas can help
reduce the cost of sending and receiving
remittances is the International Remittance
Network (IRnet), a network set up in 2000 by the
World Council of Credit Unions (WOCCU), which
allows members of credit unions to send money
for a fee lower than those of transfer alternatives.
2
1
WOCCU, in collaboration with MoneyGram and
Vigo Remittance, has facilitated transactions
amounting to US$1.5 billion through approximately
300 credit union locations throughout the
United States and 900 rural and urban credit union
locations in Bolivia, Ecuador, El Salvador,
Guatemala, Honduras, Jamaica, Kenya, Mexico
and Nicaragua (Grace 2007).
Table 4 presents key facts and figures on migration
and remittances for developing regions.
22
20
Table 4
Facts and figures on migration and remittances for developing regions
a
Migration Remittances
SUB-SAHARAN AFRICA
Stock of emigrants: 15.9 million or 2.1% of
the population.
Top 10 emigration countries: Mali, Burkina Faso,
Ghana, Eritrea, Nigeria, Mozambique, Zimbabwe,
South Africa, the Sudan, the Democratic Republic of
the Congo.
The prevailing type of migration is intraregional,
although there is also significant international migration
to former European colonial powers, such as France,
England, the Netherlands and Italy, among others.
Identified destinations: high-income OECD countries
(25.2%), high-income non-OECD countries (2.9%),
intraregional (63.2%), other developing countries
(0.2%), unidentified (8.5%).
In 2007 remittance flows to the subregion
approached US$10.8 billion.
Top 10 remittance recipients in 2007 in US$ billion:
Nigeria ($3.3), Kenya ($1.3), the Sudan ($1.2),
Senegal ($0.9), Uganda ($0.9), South Africa ($0.7),
Lesotho ($0.4), Mauritius ($0.2), Togo ($0.2),
Mali ($0.2).
Top 10 remittance recipients in 2006 as percentage of
GDP: Lesotho (24.5%), the Gambia (12.5%), Cape
Verde (12.0%), Guinea-Bissau (9.2%), Uganda (8.7%),
Togo (8.7%), Senegal (7.1%), Kenya (5.3%),
Swaziland (3.7%), Benin (3.6%).
EAST ASIA and the PACIFIC
Stock of emigrants: 19.3 million or 1.0%
of population.
Top 10 emigration countries: China, the Philippines,
Viet Nam, Indonesia, Malaysia, Thailand, the
Democratic Republic of Korea, Myanmar, the Lao
People’s Democratic Republic, Cambodia.
Identified destinations: high-income OECD countries
(50.0%), high-income non-OECD countries (27.3%),
intraregional (13.1%), other developing countries
(1.1%), unidentified (8.5%).
In 2007 the subregion received US$58.0 billion
in remittances.
Top 10 remittance recipients in 2007 in US$ billion:
China ($25.7), the Philippines ($17.0), Indonesia
($6.0), Viet Nam ($5.0), Thailand ($1.7), Malaysia
($1.7), Cambodia ($0.3), Mongolia ($0.2), Fiji ($0.2),
Myanmar ($0.1).
Top 10 remittance recipients in 2006 as percentage of
GDP: Tonga (32.3%), the Philippines (13.0%), Kiribati
(9.9%), Viet Nam (7.9%), Mongolia (6.8%), Solomon
Islands (6.3%), Fiji (5.8%), Cambodia (4.1%), Vanuatu
(2.8%), Indonesia (1.6%).
SOUTH ASIA
Stock of emigrants: 22.1 million or 1.5%
of population.
Top 5 emigration countries: India, Bangladesh,
Pakistan, Afghanistan, Sri Lanka.
Identified destinations: high-income OECD countries
(20.3%), high-income non-OECD countries (25.3%),
intraregional (34.5%), other developing countries
(11.4%), unidentified (8.5%).
In 2007 the subregion received US$43.8 billion in
remittances.
Top 5 remittance recipients in 2007 in US$ billion:
India ($27.0), Bangladesh ($6.4), Pakistan ($6.1),
Sri Lanka ($2.7), Nepal ($1.6).
T
op 5 r
emittance r
ecipients in 2006 as per
centage
of GDP: Nepal (18.0%), Bangladesh (8.8%),
Sri Lanka (8.7%), Pakistan (4.0%), India (2.8%).
Stock of emigrants: 47.6 million or 10.0%
of population.
Top 10 emigration countries: Russian Federation,
Ukraine, Turkey, Kazakhstan, Poland, Serbia and
Montenegro,
c
Uzbekistan, Belar
us, Bosnia and
Herzegovina, Azerbaijan.
In 2007 Europe and Central Asia received
US$38.6 billion in r
emittances.
Top 10 remittance recipients in 2007 in US$ billion:
Romania ($6.8), Poland ($5.0), Serbia and
Montenegr
oc ($4.9), Russian Federation ($4.0),
Bosnia and Herzegovina ($1.9), Bulgaria ($1.9),
Croatia ($1.8), Albania ($1.5), Armenia ($1.3),
T
ajikistan ($1.3).
EUROPE
b
and CENTRAL ASIA
I
NTERNATIONAL MIGRATION, REMITTANCES AND RURAL DEVELOPMENT
21
LATIN AMERICA and the CARIBBEAN
Stock of emigrants: 28.3 million or 5.1%
of population.
Top 10 emigration countries: Mexico, Colombia,
Cuba, Brazil, El Salvador, the Dominican Republic,
Jamaica, Ecuador, Peru, Haiti.
Identified destinations: high-income OECD countries
(79.0%), high-income non-OECD countries (0.6%),
intraregional (11.9%), other developing countries
(0.05%), unidentified (8.5%). Until recently, the United
States was the main destination; however, increasing
migration to Europe and intraregional mobility have
changed this pattern. Italy and Spain are two of the
main destinations in Europe, whereas Argentina,
Costa Rica and the Dominican Republic are the main
intraregional destinations.
In 2007 remittances to the region were estimated at
US$59.9 billion.
d
Top 10 remittance recipients in 2007 in US$ billion:
Mexico ($25.0), Colombia ($4.6), Brazil ($4.5),
Guatemala ($4.1), El Salvador ($3.6), the Dominican
Republic ($3.2), Ecuador ($3.2), Honduras ($2.6),
Jamaica ($2.0), Peru ($2.0).
Top 10 remittance recipients in 2006 as percentage
of GDP: Honduras (25.6%), Guyana (24.3%),
Haiti (21.6%), Jamaica (18.5%), El Salvador (18.2%),
Nicaragua (12.2%), Guatemala (10.3%),
the Dominican Republic (10.0%), Ecuador (7.2%),
Bolivia (5.5%).
MIDDLE EAST and NORTH AFRICA
Stock of emigrants: 12.9 million or 4.2%
of population.
Top 10 emigration countries/territories: Morocco,
Egypt, Algeria, Iraq, Iran (Islamic Republic of), Gaza and
the West Bank, Jordan, Tunisia, Lebanon, Yemen.
Identified destinations: high-income OECD countries
(52.2%), high-income non-OECD countries (21.3%),
intraregional (16.3%), other developing countries
(1.7%), unidentified (8.5%).
In 2007 the Middle East and North Africa received
US$28.5 billion in remittances.
Top 10 remittance recipients in 2007 in US$ billion:
Egypt ($5.9), Morocco ($5.7), Lebanon ($5.5), Jordan
($2.9), Algeria ($2.9), Tunisia ($1.7), Yemen ($1.3),
Iran (Islamic Republic of) ($1.1), the Syrian Arab
Republic ($0.8), Gaza and the West Bank ($0.6).
Top 10 remittance recipients in 2006 as percentage of
GDP: Lebanon (22.8%), Jordan (20.3%), Gaza and
the West Bank (14.7%), Morocco (9.5%), Yemen
(6.7%), Tunisia (5.0%), Egypt (5.0%), Djibouti (3.8%),
the Syrian Arab Republic (2.3%), Algeria (2.2%).
Identified destinations: high-income OECD countries
(28.5%), high-income non-OECD countries (5.3%),
intraregional (57.6%), other developing countries
(0.2%), unidentified (8.5%).
Top 10 remittance recipients in 2006 as percentage of
GDP: Tajikistan (36.2%), the Republic of Moldova
(36.2%), Kyrgyz Republic (27.4%), Armenia (18.3%),
Bosnia and Herzegovina (17.2%), Albania (14.9%),
Serbia and Montenegroc (13.8%), Georgia (6.4%),
Romania (5.5%), Bulgaria (5.4%).
Source: World Bank (2008).
a The designation ‘developing’ regions is intended for statistical convenience and does not necessarily express a judgment about the stage
reached by a particular country or region in the development process.
b Includes: Albania, Bosnia and Herzegovina, Bulgaria, Croatia, Hungary, Latvia, Lithuania, the former Yugoslav Republic of Macedonia, the
Republic of Moldova, Montenegr
o, Poland, Romania, Russian Federation, Serbia, Slovenia, T
urkey and Ukraine.
c Serbia and Montenegro became separate countries in 2006, however, since the historical statistics of the two countries were combined,
the World Bank Factbook reports them jointly.
d Estimates from the Inter-American Development Bank’s Multilateral Investment Fund (MIF) are much higher. According to the MIF, Latin
American and Caribbean migrants sent some US$66.5 billion back to their homelands in 2007, about 7 per cent more than in the previous
year. However, the MIF noted that this is the first time since they started tracking remittances in the year 2000 that the region has not seen
a double-digit yearly increase. According to the MIF, this is mostly because the region’s two top recipients of worker remittances, Mexico
and Brazil, departed significantly fr
om past trends. Remittances to Mexico were virtually unchanged in 2007, rising barely 1 per cent to
US$24 billion, while those to Brazil dr
opped 4 per cent to about US$7.1 billion in 2007. In the case of Mexico, the slowdown in
remittances could be partly attributed to stricter enforcement of immigration laws and a slowing economy in the United States. In Brazil’s
case, increasing economic opportunities at home and a strengthening local currency have reduced the appeal of sending money home for
many Brazilian immigrants in the United States, www
.iadb.org/NEWS/articledetail.cfm?Language=En&parid=2&artType=PR&artid=4459.
International migrants from developing countries
are of both rural and urban origin (ratios vary from
country to country and change over time
according to socio-economic conditions in both
sending and receiving areas). However, we will
focus on the rural factors that motivate vast
sectors of the population to consider migration in
order to improve their lives and diversify their
sources of income. During the last 50 years,
800 million people have migrated from rural to
urban areas, and it is expected that these
migrations will continue to increase.
2
3
Even
though internal and international migrations have
differing characteristics, the motivation for
displacement is similar – the search for new
options to improve the quality of life – and is thus
an indication of limited opportunities.
It has been estimated that more than 800 million
poor people live in rural areas of the developing
world and depend on agriculture and related
activities for their survival. Even in 2025, when the
majority of the world’s population is projected to
live in urban areas, 60 per cent of the poorest
people are expected to remain in rural areas (IFAD
2005), where inequity and pover
ty are greater.
Accor
ding to FAO estimates, agriculture is the only
source of income for close to 70 per cent of the
world’s rural poor population, of which a great part
is made up of small farmers. The growth of
agricultur
e and rural development have a key role in
food security and poverty relief, and they can play a
determining role in economic growth and the
reduction of inequities and migratory pressures.
Evidence has shown that remittance flows to rural
areas are important for all developing regions and
contribute to economic progress in rural areas. The
flow of remittances into rural areas in Asia is among
the highest. This is partly because half of the Asian
countries are 65 per cent rural. In Europe
remittances to rural areas are received in a lower
proportion than in other places of the world. Among
eastern European countries, however, the ratio of
remittances per capita to per capita income is
60 per cent in those communities where the
population is over 35 per cent rural. Some countries
– such as Albania, the Republic of Moldova and
Romania – see over 50 per cent of remittance flows
going to rural areas. Remittances sent to rural
regions in Latin America and the Caribbean
represent about one third of all flows. Many people
from the Near East, whether from the Middle East
or the Caucasus, migrate from rural areas and
remit to their places of origin. For example,
48 per cent of remittances to Georgia go to rural
areas, as do over 60 per cent of remittances to
Azerbaijan. In Africa, a majority of remittances also
go to rural areas and are predominantly related to
intraregional migration, particularly in western and
southern Africa (IFAD 2007b).
3.1 ‘Push factors’ in rural areas
24
The globalization process under way over the last
several decades has led to increased international
trade, higher capital flows, globalized production
processes, and economic integration through the
cr
eation of common markets and bilateral trade
agreements. As a result of this model, world trade
and wealth have grown substantially and
technological br
eakthr
oughs have been achieved.
However, few have been able to take advantage
of the benefits cr
eated by these pr
ocesses. W
ithin
22
3
Poverty and inequities:
Key determinants of current
outmigration from rural areas
this context, social and economic inequalities
between and within countries have not only
remained but they have increased substantially. In
1975, per capita GDP in high-income countries
used to be 41 times higher than in countries with
low income, and 8 times higher than in middle-
income countries. Today, high-income countries
have per capita GDPs that are 66 times higher than
those of countries with low incomes, and 14 times
higher than those of countries with middle incomes
(GCIM 2005).
The United Nations Development Programme
(UNDP 2005b, 20) documents that the poorest
40 per cent of the world’s population, that is, the
2.5 billion people who live on less than two dollars
a day, account for 5 per cent of the world’s
income, while the richest 10 per cent, most of
them living in high-income countries, account for
54 per cent of the world’s income.
When assessing global poverty, it is important to
keep in mind that inequalities are not just intrinsic
to differences in income between countries or
between groups and individuals within a country.
The levels of opulence on display in our age are
unprecedented in history, and they are present
within a global context of noticeable deprivation,
misery and repression. The economist Amartya
Sen has consistently pinpointed the intricate
connection between equity and development,
stressing that the one is not possible without the
other and that any development practitioner must
be constantly awar
e of the new and old pr
oblems
that plague the world:
… persistent pover
ty and extensive unmet
basic needs, famine and the problem of hunger,
the violation of essential political freedoms, as
well as of basic freedoms, the lack of attention to
the interests and needs of women and the
worsening of the threats that loom over our
environment and over the preservation of our
economic and social existence (Sen 1999, 382).
The biggest losers have been the most vulnerable
and disadvantaged groups in society, especially
rural women and men in developing countries.
Three out of four poor people in developing
countries live in rural areas, and most depend on
agriculture or related activities for their livelihoods.
According to a World Bank country rating study, in
agriculture-based countries – those where
agriculture contributes an average of 32 per cent
of GDP growth – 70 per cent of poor people live in
rural areas. In transforming countries, where
agriculture is no longer a main source of economic
growth, contributing on average only 7 per cent to
GDP growth, 82 per cent of all poor people live in
rural areas. In urbanized countries, where
agriculture directly contributes only an average of
5 per cent to economic growth and where poverty
is mostly urban, rural areas are still home to
45 per cent of poor people. (World Bank 2007, 24)
While important differences exist among various
regions and countries, some common features
are present in the rural context of developing
countries. Traditionally, lack of access to
fundamental assets and to productive services and
inputs – such as land, water
, cr
edit, extension,
market information and technical innovations – has
prevented smallholders in developing countries
fr
om capitalizing on their agricultural enterprises
and increasing their productivity.
23