METHODS IN INDUSTRIAL BIOTECHNOLOGY FOR CHEMICAL ENGINEERS pot
Bạn đang xem bản rút gọn của tài liệu. Xem và tải ngay bản đầy đủ của tài liệu tại đây (2.47 MB, 126 trang )
Biotechnology - Cover:Layout 1 7/17/2008 2:06 PM Page 1
METHODS IN INDUSTRIAL
BIOTECHNOLOGY FOR
CHEMICAL ENGINEERS
W. B. Vasantha Kandasamy
e-mail:
web: />
www.vasantha.net
Florentin Smarandache
e-mail:
INFOLEARNQUEST
Ann Arbor
2008
2
This book can be ordered in a paper bound reprint from:
Books on Demand
ProQuest Information & Learning
(University of Microfilm International)
300 N. Zeeb Road
P.O. Box 1346, Ann Arbor
MI 48106-1346, USA
Tel.: 1-800-521-0600 (Customer Service)
/>
Peer reviewers:
Prof. Ion Goian, Department of Algebra, Number Theory and Logic, State
University of Kishinev, R. Moldova.
Prof. Zhang Wenpeng, Department of Mathematics, Northwest University,
Xi’an, Shaanxi, P.R.China.
Prof. Mircea Eugen Selariu,
Polytech University of Timisoara, Romania.
Copyright 2008 by InfoLearnQuest and authors
Cover Design and Layout by Kama Kandasamy
Many books can be downloaded from the following
Digital Library of Science:
/>
ISBN-10: 1-59973-034-0
ISBN-13: 978-1-59973-034-9
EAN: 9781599730349
Standard Address Number: 297-5092
Printed in the United States of America
3
CONTENTS
Preface
5
Chapter One
INTRODUCTION 7
Chapter Two
BIOTECHNOLOGY IN CHEMICAL INDUSTIRES 11
2.1 Description of waste CKD in cement kiln 13
2.2 Monitoring and control of the system using FCT and
improvement of burning zone and combustion 16
2.3 Determination of gas volume setpoint and
temperature set point for CKD processing 26
2.4 Finding the MIX of raw materials in
proper proportion and minimize the waste
dust using fuzzy neural network 35
4
Chapter Three
DETERMINATION OF TEMPERATURE
SET POINTS FOR CRUDE OIL 47
3.1 Introduction 47
3.2 Description of Crude Oil Refineries 48
3.3 Determination of Temperature Set-Point
of Kerosene Resulting in Better
Distillation Using Fuzzy Control Theory 52
3.4 Determination of Temperature Set Point of
Naphtha Resulting in Better Distillation
using Fuzzy Control Theory 61
3.5 Determination of Temperature Set-Point of
Gasoil Resulting in Better Distillation using
Fuzzy Control Theory 69
3.6 Conclusions 78
Chapter Four
STUDY OF FLOW RATES IN
CHEMICAL PLANTS 79
4.1 Use of FRE in Chemical Engineering 79
4.2 Fuzzy neural networks to estimate velocity of
flow distribution in a pipe network 85
4.3 Fuzzy neural networks to estimate three stage
counter current extraction unit 86
Chapter Five
MINMIZATION OF WASTE GAS FLOW IN
CHEMICAL INDUSTRIES
89
5
Chapter Six
USE OF NEUTROSOPHIC RELATIONAL
EQUATIONS IN CHEMICAL ENGINEERING
103
6.1 Introduction to Neutrosophic relation
and their properties 103
6.2 Use of NRE in Chemical engineering 114
FURTHER READING 117
INDEX 123
ABOUT THE AUTHORS 125
6
PREFACE
Industrial Biotechnology is an interdisciplinary topic to which
tools of modern biotechnology are applied for finding proper
proportion of raw mix of chemicals, determination of set points,
finding the flow rates etc., This study is significant as it results
in better economy, quality product and control of pollution. The
authors in this book have given only methods of industrial
biotechnology mainly to help researchers, students and chemical
engineers. Since biotechnology concerns practical and diverse
applications including production of new drugs, clearing up
pollution etc. we have in this book given methods to control
pollution in chemical industries as it has become a great health
threat in India. In some cases, the damage due to environmental
pollution outweighs the benefits of the product.
This book has six chapters. First chapter gives a brief
description of biotechnology. Second chapter deals will proper
proportion of mix of raw materials in cement industries to
minimize pollution using fuzzy control theory. Chapter three
gives the method of determination of temperature set point for
crude oil in oil refineries. Chapter four studies the flow rates in
chemical industries using fuzzy neutral networks. Chapter five
gives the method of minimization of waste gas flow in chemical
industries using fuzzy linear programming. The final chapter
suggests when in these studies indeterminancy is an attribute or
concept involved, the notion of neutrosophic methods can be
adopted. The authors feel that the reader should be well versed
with fuzzy models like neural networks, fuzzy relational
equations, fuzzy control theory, fuzzy linear programming and
neutrosophic fuzzy models like NRE together with a knowledge
of the technical functioning of chemical industries.
The authors are deeply indebted to Dr. Kandasamy, Kama
and Meena for their sustained cooperation.
W.B.VASANTHA KANDASAMY
FLORENTIN SMARANDACHE
7
Chapter One
INTRODUCTION
In keeping with the definition that “biotechnology is really no
more than a name given to a set of techniques and processes”,
the authors apply some set of fuzzy techniques to chemical
industry problems such as finding the proper proportion of raw
mix to control pollution, to study flow rates, to find out the
better quality of products. We use fuzzy control theory, fuzzy
neural networks, fuzzy relational equations, genetic algorithms
to these problems for solutions.
When the solution to the problem can have certain concepts
or attributes as indeterminate, the only model that can tackle
such a situation is the neutrosophic model. The authors have
also used these models in this book to study the use of
biotechnology in chemical industries.
The new biotechnology revolution began in the 1970s and
early 1980s when scientists learned to precisely alter the genetic
constitution of living organisms by processes out with
traditional breeding practices. This “genetic engineering” has
had a profound impact on almost all areas of traditional
biotechnology and further permitted breakthroughs in medicine
and agriculture, in particular those that would be impossible by
traditional breeding approaches.
8
There are evidences to show that historically biotechnology
was an art rather than a science, exemplified in the manufacture
of wines, beers, cheeses etc. It is well comprehended by one and
all that biotechnology is highly multi disciplinary, it has its
foundations in many fields including biology, microbiology,
biochemistry, molecular biology, genetics, chemistry and
chemical and process engineering. It is further asserted that
biotechnology will be the major technology of the twenty first
century.
The newly acquired biological knowledge has already made
very important contributions to health and welfare of human
kind.
Biotechnology is not by itself a product or range of
products; it should be regarded as a range of enabling
technologies that will find significant application in many
industrial sectors.
Traditional biotechnology has established a huge and
expanding world market and in monetary terms, represents a
major part of all biotechnology financial profits. ‘New’ aspects
of biotechnology founded in recent advances in molecular
biology genetic engineering and fermentation process
technology are now increasingly finding wide industrial
application.
In many ways, biotechnology is a series of embryonic
technologies and will require much skilful control of its
development but the potentials are vast and diverse and
undoubtedly will play an increasingly important part in many
future industrial processes.
It is no doubt an interaction between biology and
engineering. The developments of biotechnology are proceeding
at a speed similar to that of micro-electronics in the mid 1970s.
Although the analogy is tempting any expectations that
biotechnology will develop commercially at the same
spectacular rate should be tempered with considerable caution.
While the potential of new biotechnology cannot be doubted a
meaningful commercial realization is now slowly occurring and
will accelerate as we approach the end of the century. New
biotechnology will have a considerable impact across all
industrial uses of the life sciences. In each case the relative
9
merits of competing means of production will influence the
economics of a biotechnological route. There is no doubt that
biotechnology will undoubtedly have great benefits in the long
term in all sectors. The growth in awareness of modern
biotechnology parallels the serious worldwide changes in the
economic climate arising from the escalation of oil prices since
1973.
Biotechnology has been considered as one important means
of restimulating the economy whether on a local, regional
national or even global basis using new biotechnological
methods and new raw materials. Much of modern biotechnology
has been developed and utilized by large companies and
corporations.
However many small and medium sized companies are
realizing that biotechnology is not a science of the future but
provides real benefits to their industry today. In many industries
traditional technology can produce compounds causing
environmental damage whereas biotechnology methods can
offer a green alternative promoting a positive public image and
also avoiding new environmental penalties.
Biotechnology is high technology par excellence. Science
has defined the world in which we live and biotechnology in
particular will become an essential and accepted activity of our
culture. Biotechnology offers a great deal of hope for solving
many of the problems our world faces!. As stated in the
Advisory Committee on Science and Technology Report
Developments in Biotechnology, public perception of
biotechnology will have a major influence on the rate and
direction of developments and there is growing concern about
genetically modified products. Associated with genetic
manipulation are diverse question of safety, ethics and
welfare.
Public debate is essential for new biotechnology to grow up
and undoubtedly for the foreseeable future, biotechnology will
be under scrutiny. We have only given a description of the
biotechnology and the new biotechnology. We have highly
restricted ourselves from the technical or scientific analysis of
the biotechnologies as even in the countries like USA only less
than 10% of the population are scientifically literate, so the
10
authors have only described it non-abstractly and in fact we are
not in anyway concerned to debate or comment upon it as we
acknowledge the deep and dramatic change the world is facing
due to biotechnology and new biotechnology.
For more of these particulars please refer [1, 2, 13, 15, 17].
11
Chapter Two
BIOTECHNOLOGY IN CHEMICAL
INDUSTRIES
The chemical industries have become a great threat in India. For
the problems they cause on environmental pollution is much
more than the benefit derived by their product. Some of them
damage other living organisms like fishes, plants and animals;
some cause health hazards to people living around the industries
like respiratory ailments, skin problems and damage to nervous
systems. So we have chosen to illustrate the minimization of
pollution by CKD in cement Industries. Most of these problems
can be controlled provided one takes the proper proportion of
the mix of raw materials, which would minimize the pollution.
Cement kiln dust (CKD) emits nitrogen, carbon etc., that are
pollutants of the atmosphere and the waste dust affects the
smooth kiln operation of the cement industry system and it
reduces the production of clinker quality. Hence the
minimization of waste CKD in kiln is an important one in the
cement industry. The control of the waste CKD in a kiln is an
uncertainty. Researchers approach this problem by
mathematical methods and try to account the waste CKD in a
cement kiln. But, most of their methods do not properly yield
results about the waste CKD in kiln. Further, the control of the
waste CKD in kiln is a major problem for this alone can lead to
the minimization of atmospheric pollution by the cement
12
industry. So in this chapter we minimize the waste CKD in kiln
and account for the waste CKD in kiln using fuzzy control
theory and fuzzy neural networks.
In this chapter fuzzy control theory (FCT) is used to study
the cement kiln dust (CKD) problem in cement industries.
Using fuzzy control method this chapter tries to minimize the
cement kiln dust in cement industries. Cement industries of our
country happens to be one of the major contributors of dust. The
dust arising in various processing units of a cement plant varies
in composition. In 1990 the national average was 9 tons of CKD
generated for every 100 tons of clinker production. The control
of cement kiln dust is a very important issue, because of the
following reasons : 1. CKD emits nitrogen, carbon etc., which
are pollutants of the atmosphere, 2. The waste dust affects the
smooth kiln operation of the cement industry system and it
reduces the production of clinker quality. The following creates
mainly this waste dust in three ways in cement industries : (a)
Cement kiln dust when not collected in time and returned into
the kiln, cause air pollution, (b) Process instability and
unscheduled kiln shutdowns and (c) Mixing of raw materials.
The data obtained from Graft R. Kessler [12] is used in this
chapter to test the result. After using the data from Kessler [12]
this chapter tries to minimize the CKD in cement factory. The
minimization of CKD plays a vital role in the control of
pollution in the atmosphere.
W.Kreft [21] used the interruption of material cycles
method for taking account and further utilization of the waste
dust in the cement factory. But this method does not properly
account the waste CKD. Kesslar [12] has used volatile analysis
to reduce CKD. In the volatile analysis method the alkali ratio is
used to indicate the waste amount of CKD in clinker.
Kesslar [12] classifies the raw data under investigation in
four ways :
I. Monitor and control of the system
II. Burning zone and fuel combustion improvements
III. CKD reprocessing
IV. Find the mix of raw materials in proper proportion.
The ratio of alkali should be lying between 0.5 to 1.5 in
Kiln load material. But in this method the CKD was
13
approximately estimated up to 40%. He has not exactly
mentioned the percentage of CKD according to the alkali ratio
in an online process. So this method has affected largely the kiln
system.
In this chapter, in order to account for the waste CKD, the
variables are expressed in terms of membership grades. This
chapter considers all the four ways of waste CKD mentioned by
Kesslar [12] and converts it into a fuzzy control model. This
chapter consists of five sections. In section 1 we describe the
cement kiln system and the nature of chemical waste dust which
pollutes the atmosphere. In section 2 we adopt the fuzzy control
theory to monitor and control the system and give suggestion
for the improvement of burning and combustion zone. Section 3
deals with the determination of gas volume set point and
temperature set point for CKD reprocessing which is vital for
the determination of percentage of net CKD. The amount of
waste dust depends largely on the mix of raw materials in
proper proportion of raw material mix is shown in section 4.
The final section deals with results and conclusion obtained
from our study.
2.1 Description of waste CKD in cement kiln
The data available from any cement industry is used as the
information and also as the knowledge about the problem. This
serves as the past experience for our study for adapting the
fuzzy control theory in this section. This chapter analysis the
data via membership functions of fuzzy control method and
minimizes the waste CKD in cement industries. Since the
cement industry, emits the cement kiln dusts into the
atmosphere, this waste dust pollutes the atmosphere.
This analysis not only estimates the cement kiln dust in
cement industries but also gives condition to minimize the
waste CKD so that the industry will get maximum profit by
minimizing the waste CKD in cement industry.
CKD is particulate matter that is collected from kiln exhaust
gases and consist of entrained particles of clinker, raw materials
and partially calcined raw materials. The present pollution in
14
environment is generated by CKD along with potential future
liabilities of stored dust and this should make CKD reduction a
high priority. Here we calculate and minimize the net CKD in
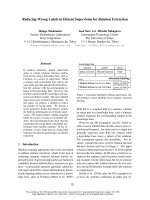
kiln system. This chapter tackles the problem of minimizing
waste CKD in kiln system in four stages. At the first stage we
monitor and control the system. In the second stage we adopt
time-to- time improved techniques in burning zone and
combustion. At the third stage CKD reprocessing is carried out
and in the fourth stage we optimize the mix of raw materials in
proper proportion using fuzzy neutral network. The above stage-
by-stage process is shown in the following figure 2.1.1. Fuzzy
control theory and fuzzy neutral network (FNN) is used in this
chapter for the above – described method to minimize the CKD
in kiln system.
The fuzzy controller is composed of linguistic control rule,
which are conditional linguistic statements of the relationship
between inputs and outputs. One of the attractive properties of
fuzzy controller is its ability to emulate the behaviour of a
human operator. Another important characteristic of a fuzzy
controller is its applicability to systems with model uncertainty
or even to unknown model systems. The use of fuzzy control
CKD
Reduction
Final Step
Step 1: Monitor
and control of the
system
Step 2: Burning
zone and
combustion
improvement
Step 3: CKD
Reprocessing
Step 4: Optimize
and mix the raw
material in proper
proportion
FIGURE 1: CKD Reduction using fuzzy control
15
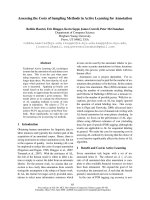
applications has expanded at an increasing rate in recent years.
In this chapter we use fuzzy control to monitor waste dust in
cement kiln system and CKD reprocessing. The fuzzy control in
kiln system is described in the figure 2.1.2. We use fuzzy neural
network method and tries to find a proper proportion of material
mix in cement industries.
The authors aim to achieve a desired level of lime saturation
factor (LSF), silica modulus (SM) and alumina modulus (AM)
of the raw mix, to produce a particular quality of the cement by
controlling the mix proportions of the raw materials. To achieve
an appropriate raw mix proportion is very difficult, due to the
inconsistency in the chemical composition ratio given for the
raw materials.
Fuzzy neural network model is used to obtain a desired
quality of clinker. The raw mix as per the norms of cement
industries should maintain the ranges like LSF 1.02 to 1.08, SM
2.35 to 2.55 and AM 0.95 to 1.25, which are the key factors for
the burnability of clinker to obtain a good quality of cement.
Fuzzy control theory method is used to minimize waste cement
kiln dust. Fuzzy control theory allows varying degrees of set
membership based on a membership function defined over a
range of values. The membership function usually varies from 0
to 1.
Dust
Collector
Fuzzy
Control
Kiln
Net
CKD
Gross CKD
Recycled CKD
Gross CKD
Recycled CKD
Burning zone
Clinker
Raw materials
FIGURE 2: Fuzzy control in kiln system
16
2.2 Monitoring and control of the system using FCT
and improvement of burning zone and combustion
Monitoring and control of the system is the most effective
method towards CKD reduction in environment. CKD consists
mainly of raw materials, which contain volatile compounds,
therefore, tracking and control of the volatile compounds
throughout the system often allows for the minimal CKD. The
initial step in our plan towards CKD reduction is to identify the
amount of the CKD. Here the indirect weighing method is
applied to identify the amount of the CKD. Calculating
sulphur/alkali ratio is a good indication of a possible imbalance.
This ratio is calculated as the molar ratio of SO
3
/(K
2
O)+Na
2
O)
in kiln load material.
CKD VOLATILE ANALYSIS
Volatile Molecular Weight
Na
2
O 62
K
2
O 94.2
SO
3
80
Ratio of alkali = SO
3
/K
2
O + Na
2
O = 80/156.2 = 0.512
This ratio should be between the values 0.5 to 1.5 in Kiln
load material. The industry knows upto 40% of CKD exits,
when the alkali ratio is between the values 0.5 to 1.5. But they
cannot say exactly how much percentage of CKD waste comes
from kiln by using the ratio of alkali in the online process. If
industry knows this correct percentage of CKD in the online
process, they can change some condition in the kiln and thus
reduce the CKD in the online process. We adopt fuzzy control
to estimate the percentage of CKD by using the ratio of alkali.
The alkali ratio, kiln load material in tons and percentage of
CKD are measured from the past happening process in kiln on a
scale from 0.5 to 1.5, 5 to 25 tons and 0 to 40% respectively.
17
That is we assign the sulphur/alkali ratio shortly termed as alkali
ratio, alkali ratio to be approximately low (L) when its value is
0.5, medium (M) when its value is 1 high (H) when its value is
1.5. In a similar way we give kiln load material ≅ {5 tons [first
stage (FS)], 15 tons [second stage (SS)] and 25 tons [third stage
(TS)]}. Percentage of CKD ≅ {0 [very less (VL)], 10 [less (L)],
20 [medium (M)], 30 [high (H)] and 40 [very high (VH)]}. (‘≅’
Denotes approximately equal). The terms of these parameters
are presented in figures 2.2.1, 2.2.2 and 2.2.3.
0.5 1 1.5
1
L M H
M
S
G
X Alkali ratio
Legend
MSG – Membership grade
L-low, M-medium, H-high
FIGURE 2.2.1: Alkali ratio- input parameter
5 15 25
1
FS SS TS
M
S
G
Y Kiln load material in tons
Legend
MSG – Membership grade
FS- First stage, SS-Second
stage, TS- Third Stage
FIGURE 2.2.2: Kiln load material in tons-output parameter
18
For the terms of alkali ratio, kiln load material in tons and
percentage of CKD we give the following membership
functions:
()
L
M
alkali ratio
H
(X) (1 X) 0.5 0.5 X 1
(X 0.5) 0.5 0.5 X 1
X(X)
(1.5 X) 0.5 1 X 1.5
(X) (X 1) 0.5 1 X 1.5
μ=− ≤≤
⎧
⎪
−
≤≤
⎧
⎪
μ=μ=
⎨⎨
−≤≤
⎩
⎪
⎪
μ=− ≤≤
⎩
(2.2.1)
()
(
)
()
()
FS
kiln
SS
ratio in tons
TS
Y (15 Y) 10 5 Y 15
(Y 5) 10 5 Y 15
YY
(25 Y) 10 15 Y 25
Y (Y 15) 10 15 Y 25
⎧
μ=− ≤≤
⎪
−≤≤
⎧
⎪
μ=μ=
⎨⎨
−
≤≤
⎩
⎪
⎪
μ=− ≤≤
⎩
(2.2.2)
0 10 20 30 40
1
VL L M H VH
M
S
G
Z Percentage of CKD
Legend
MSG – Membership grade
VL- very less, L-low, M-medium,
H-high, VH- very high
FIGURE 2.2.3: Percentage of CKD – output parameter
19
()
(
)
()
()
()
()
VL
L
percentage
M
of CKD
H
VH
Z (10 Z) 10 0 Z 10
Z 10 0 Z 10
Z
(20 Z) 10 10 Z 20
(Z 10) 10 10 Z 20
Z
Z
(30 Z) 10 20 Z 30
(Z 20) 10 20 Z 30
Z
(40 Z) 10 30 Z 40
Z (Z 30) 10 30 Z 40
⎧μ = − ≤ ≤
⎪
≤≤
⎧
μ=
⎨
−≤≤
⎩
−≤≤
⎧
μ=
μ=
⎨
⎨
−≤≤
⎩
−
≤≤
⎧
μ=
⎨
−
≤≤
⎩
μ=− ≤≤
⎪
⎪
⎪
⎪
⎪
⎪
⎪
⎪
⎪
⎩
(2.2.3)
By applying the “if … and … then” rules [refer 11] to the three-
membership functions μ(X), μ(Y) and μ(Z) we get the
following table of rules.
The rules given in Table 2.2.1 read as follows :
Table 2.2.1
Y
X
FS SS TS
L VL M H
M L M H
H M H VH
For example :
If alkali ratio is L and kiln load material in tons is FS then
percentage of CKD is VL. If alkali ratio is H and kiln load
material in tons is TS then percentage of CKD is VH; and so on.
Rules of evaluation using the membership functions defined
by the equation (2.2.1) and (2.2.2), if alkali ratio is 1.2 and kiln
load material is 17 tons we get the fuzzy inputs as μ
M
(1.2) = 0.6,
μ
H
(1.2) = 0.4, μ
SS
(17) = 0.8 and μ
TS
(17) = 0.2. Induced decision
table for percentage of CKD is as follows.
20
Table 2.2.2
Y
X
0
μ
SS
(17) = 0.8 μ
TS
(17) = 0.2
0 0 0 0
μ
M
(1.2)=0.6
0
μ
M
(Z) μ
H
(Z)
μ
H
(1.2)=0.4
0
μ
H
(Z) μ
VH
(Z)
Conflict resolutions of the four rules is as follows:
Rule 1 : If X is M and Y is SS then Z is M
Rule 2 : If X is M and Y is TS then Z is H
Rule 3 : If X is H and Y is SS then Z is H
Rule 4 : If X is H and Y is TS then Z is VH
Now, using Table 2.2.2 we calculate the strength values of the
four rules as 0.6, 0.2, 0.4 and 0.2. Control output for the
percentage of CKD is given in table 2.2.3.
Table 2.2.3
Y
X
0
μ
SS
(17) = 0.8 μ
TS
(17) = 0.2
0 0 0 0
μ
M
(1.2)=0.6
0
min{[0.6, μ
M
(Z)]} min{[0.2, μ
H
(Z)]}
μ
H
(1.2)=0.4
0
min{[0.4, μ
H
(Z)]} min{[0.2, μ
VH
(Z)]}
To find the aggregate(agg) of the control outputs, we obtain
the maximum of the minimum. This is given by the following
figure 2.2.4, that is μ
agg
(Z) = max {min {[0.6, μ
M
(Z)] min {[0.4,
μ
H
(Z)],)], min [0.2, μ
vH
(Z)]}. By applying the mean of
maximum method for defuzzification that is the intersection
points of the line μ = 0.6 with the triangular fuzzy number
μ
M
(Z) in equation (2.2.3) we get the crisp output to be 20%.
21
Rules of evaluation using the membership function defined by
the equation (1) and (2), if alkali ratio is 0.5 and kiln load
material is 5 tons we get the fuzzy inputs as μ
L
(0.5) = 1, μ
H
(0.5)
= 0, μ
rs
(5) = 1 and μ
ss
(5) = 0. Induced decision table for
percentage of CKD is as follows.
Table 2.2.4
Y
X
μ
FS
(5) = 1 μ
SS
(5) = 0
0
μ
L
(0.5) = 1 μ
VL
(Z) μ
M
(Z )
0
μ
M
(0.5 )= 0 μ
L
(Z) μ
M
(Z )
0
0 0 0 0
Conflict resolutions of the four rules is as follows:
Rule 1 : If X is L and Y is FS then Z is VL
Rule 2 : If X is L and Y is SS then Z is M
Rule 3 : If X is M and Y is FS then Z is L
Rule 4 : If X is M and Y is SS then Z is M.
Now, using Table 2.2.4 we calculate the strength values of
the four rules as 1, 0, 0 and 0. Control output for the percentage
of CKD is given in Table 2.2.5.
0 10 20 30 40
1
VL L M H VH
M
S
G
Z Percentage of CKD
FIGURE 2.2.4: Aggregated output and defuzzificztion for
the percentage of CKD
22
Table 2.2.5
Y
X
μ
FS
(5) = 1 μ
SS
(5) = 0
0
μ
L
(0.5) = 1 min {[1, μ
VL
(Z)]} min {[0, μ
M
(Z)]}
0
μ
H
(0.5) = 0 min {[0, μ
L
(Z)]} min {[0, μ
M
(Z)]}
0
0 0 0 0
To find the aggregate of the control outputs, we obtain the
maximum of the minimum. This is given by the following
figure 2.2.5 that is μ
agg
(Z) = {min {l, μ
VL
(Z)]}, min{[0,
μ
M
(Z)]}, min {[0, μ
L
(Z)]}. By applying the mean of maximum
method for defuzzification that is the intersection points of the
line μ =1 with the triangular fuzzy number μ
VL
(Z) in equation
(3) and get the crisp output to be 0%.
Rules of evaluation using the membership function defined
by the equations (1) and (2), if alkali ratio is 1 and kiln load
material is 15 tons we get the fuzzy inputs as μ
L
(1) = 0, μ
H
(1) =
0 and μ
m
(1) = 1, μ
FS
(15) = 0, μ
SS
(15) = 1, μ
TS
(15) = 0, Induced
decision table for percentage of CKD is as follows.
0 10 20 30 40
1
VL L M H VH
M
S
G
Z Percentage of CKD
FIGURE 2.2.5: Aggregated output and defuzzificztion for
the percentage of CKD
23
Table 2.2.6
Y
X
μ
FS
(15) = 0 μ
SS
(15) = 1 μ
TS
(15) = 0
μ
L
(1) = 0 μ
VL
(Z) μ
M
(Z ) μ
H
(Z )
μ
M
(1) = 1 μ
L
(Z) μ
M
(Z ) μ
H
(Z )
μ
H
(1) = 0 μ
M
(Z ) μ
H
(Z ) μ
VH
(Z )
Conflict resolutions of the nine rules is as follows :
Rule 1 : If X is L and Y is FS then Z is VL
Rule 2 : If X is L and Y is SS then Z is M
Rule 3 : If X is L and Y is TS then Z is H
Rule 4 : If X is M and Y is FS then Z is L.
Rule 5 : If X is M and Y is SS then Z is M.
Rule 6 : If X is M and Y is TS then Z is H.
Rule 7 : If X is H and Y is FS then Z is L.
Rule 8 : If X is H and Y is SS then Z is M.
Rule 9 : If X is H and Y is TS then Z is H.
Now, using Table 2.2.6 we calculate the strength values of the
nine rules as 0, 0, 0, 0, 1, 0, 0, 0, 0. Control output for the
percentage of CKD is given in Table 2.2.7.
Table 2.2.7
Y
X
μ
FS
(15) = 0 μ
SS
(15) = 1 μ
TS
(15) = 1
μ
L
(1)=0 min{[0,μ
VL
(Z)]} min{[0,μ
M
(Z)]} min{[0,μ
H
(Z)]}
μ
M
(1)=1 min{[0,μ
L
(Z)]} min{[0,μ
M
(Z)]} min{[0,μ
H
(Z)]}
μ
H
(1)=0 min{[0,μ
M
(Z)]} min{[0,μ
H
(Z)]} min{[0,μ
H
(Z)]}
To find the aggregate of the control outputs, we obtain the
maximum of the minimum. This is given by the following
figure 2.2.6, that is μ
agg
(Z) = max {min {0, μ
VL
(Z)]}, min{[0,
μ
M
(Z)]}, min {[0, μ
L
(Z)]}, {min {l, μ
H
(Z)]}, min{[0, μ
VH
(Z)]}.
By applying the mean of maximum method for defuzzification
that is the intersection points of the line μ =1 with the triangular
24
fuzzy number μ
VL
(Z) in equation (2.2.3) and get the crisp output
to 20%.
Rules of evaluation using the membership function defined by
the equations (2.2.1) and (2.2.2), if alkali ratio is 1.5 and kiln
load material is 25 tons we get the fuzzy inputs as μ
M
(1.5) = 0,
μ
H
(1.5) = 1, μ
SS
(25) = 0 and μ
TS
(25) = 1. Induced decision
table for percentage of CKD is as follows.
Table 2.2.8
Y
X
0
μ
SS
(25) = 0 μ
TS
(25) = 1
0 0 0 0
μ
M
(1.5) = 0
0
μ
M
(Z) μ
H
(Z )
μ
H
(1.5) = 1
0
μ
H
(Z) μ
VH
(Z )
Conflict resolutions of the four rules is as follows :
Rule 1 : If X is M and Y is SS then Z is M
Rule 2 : If X is M and Y is TS then Z is H
Rule 3 : If X is H and Y is SS then Z is H
Rule 4 : If X is H and Y is TS then Z is VH.
0 10 20 30 40
1
VL L M H VH
M
S
G
Z Percentage of CKD
FIGURE 2.2.6: Aggregated output and defuzzification for
the percentage of CKD