ANNALS OF THE NEW YORK ACADEMY OF SCIENCES - Full cost accounting for the life cycle of coal potx
Bạn đang xem bản rút gọn của tài liệu. Xem và tải ngay bản đầy đủ của tài liệu tại đây (610.23 KB, 26 trang )
Ann. N.Y. Acad. Sci. ISSN 0077-8923
ANNALS OF THE NEW YORK ACADEMY OF SCIENCES
Issue: Ecological Economics Reviews
Full cost accounting for the life cycle of coal
Paul R. Epstein,
1
Jonathan J. Buonocore,
2
Kevin Eckerle,
3
Michael Hendryx,
4
Benjamin M. Stout III,
5
Richard Heinberg,
6
Richard W. Clapp,
7
Beverly May,
8
Nancy L. Reinhart,
8
Melissa M. Ahern,
9
Samir K. Doshi,
10
and Leslie Glustrom
11
1
Center for Health and the Global Environment, Harvard Medical School, Boston, Massachusetts.
2
Environmental Science and
Risk Management Program, Department of Environmental Health, Harvard School of Public Health, Boston, Massachusetts.
3
Accenture, Sustainability Services, Philadelphia, Pennsylvania.
4
Department of Community Medicine, West Virginia
University, Morgantown, West Virginia.
5
Wheeling Jesuit University, Wheeling, West Virginia.
6
Post Carbon Institute, Santa
Rosa, California.
7
Boston University School of Public Health, Boston, Massachusetts.
8
Kentuckians for the Commonwealth,
London, Kentucky
9
Department of Pharmacotherapy, Washington State University, Spokane, Washington.
10
Gund Institute for
Ecological Economics, University of Vermont, Burlington, Vermont.
11
Clean Energy Action, Boulder, Colorado
Address for correspondence: Paul R. Epstein, M.D., M.P.H., Center for Health and the Global Environment, Harvard Medical
School, Landmark Center, 401 Park Drive, Second Floor, Boston, Massachusetts 02215.
Each stage in the life cycle of coal—extraction, transport, processing, and combustion—generates a waste stream
and carries multiple hazards for health and the environment. These costs are external to the coal industry and are
thus often considered “externalities.” We estimate that the life cycle effects of coal and the waste stream generated are
costing the U.S. public a third to over one-half of a trillion dollars annually. Many of these so-called externalities are,
moreover, cumulative. Accounting for the damages conservatively doubles to triples the price of electricity from coal
per kWh generated, making wind, solar, and other forms of nonfossil fuel power generation, along with investments
in efficiency and electricity conservation methods, economically competitive. We focus on Appalachia, though coal
is mined in other regions of the United States and is burned throughout the world.
Keywords: coal; environmental impacts; human and wildlife health consequences; carbon capture and storage; climate
change
Preferred citation: Paul R. Epstein, Jonathan J. Buonocore, Kevin Eckerle, Michael Hendryx, Benjamin M. Stout III, Richard
Heinberg, Richard W. Clapp, Beverly May, Nancy L. Reinhart, Melissa M. Ahern, Samir K. Doshi, and Leslie Glustrom. 2011.
Full cost accounting for the life cycle of coal in “Ecological Economics Reviews.” Robert Costanza, Karin Limburg & Ida
Kubiszewski, Eds. Ann. N.Y. Acad. Sci. 1219: 73–98.
Introduction
Coal is currently the predominant fuel for electric-
ity generation worldwide. In 2005, coal use gener-
ated 7,334 TWh (1 terawatt hour = 1 trillion watt-
hours, a measure of power) of electricity, which was
then 40% of all electricity worldwide. In 2005, coal-
derived electricity was responsible for 7.856 Gt of
CO
2
emissions or 30% of all worldwide carbon
dioxide (CO
2
) emissions, and 72% of CO
2
emis-
sions from power generation (one gigaton = one
billion tons; one metric ton = 2,204pounds.)
1
Non–
power-generation uses of coal, including industry
(e.g., steel, glass-blowing), transport, residential ser-
vices, and agriculture, were responsible for another
3.124 Gt of CO
2
, bringing coal’s total burden of
CO
2
emissions to 41% of worldwide CO
2
emissions
in 2005.
1
By 2030, electricity demand worldwide is pro-
jected to double (from a 2005 baseline) to 35,384
TWh, an annual increase of 2.7%, with the quantity
of electricity gener ated from coal growing 3.1% per
annum to 15,796 TWh.
1
In this same time period,
worldwide CO
2
emissions are projected to grow
1.8% per year, to 41.905 Gt, with emissions from
the coal-power electricity sector projected to grow
2.3% per year to 13.884 Gt.
1
In the United States, coal has produced approx-
imately half of the nation’s electricity since 1995,
2
and demand for electricity in the United States is
projected to grow 1.3% per year from 2005 to 2030,
to 5,947 TWh.
1
In this same time period, coal-
derived electricity is projected to grow 1.5% per year
to 3,148 TWh (assuming no policy changes from the
present).
1
Other agencies show similar projections;
the U.S. Energy Information Administration (EIA)
doi: 10.1111/j.1749-6632.2010.05890.x
Ann. N.Y. Acad. Sci. 1219 (2011) 73–98
c
2011 New York Academy of Sciences. 73
Full cost accounting for the life cycle of coal Epstein et al.
projects that U.S. demand for coal power will grow
from 1,934 TWh in 2006 to 2,334 TWh in 2030, or
0.8% growth per year.
3
To address the impact of coal on the global cli-
mate, car bon capture and storage (CCS) has been
proposed. The costs of plant construction and the
“energy penalty” from CCS, whereby 25–40% more
coal would be needed to produce the same amount
of energy, would increase the amount of coal mined,
transported, processed, and combusted, as well as
the waste generated, to produce the same amount of
electricity.
1,4
Construction costs, compression, liq-
uefaction and injection technology, new infrastruc-
ture, and the energy penalty would nearly double
the costs of electricity generation from coal plants
using current combustion technology (see Table 2).
5
Adequate energy planning requires an accurate
assessment of coal reserves. The total recoverable
reserves of coal worldwide have been estimated to
be approximately 929 billion short tons (one short
ton = 2,000 pounds).
2
Two-thirds of this is found in
four countries: U.S. 28%; Russia 19%; China 14%,
and India 7%.
6
In the United States, coal is mined in
25 states.
2
Much of the new mining in Appalachia
is projected to come from mountaintop removal
(MTR).
2
Box 1.
Peak Coal?
With 268 billion tons of estimated recoverable
reserves (ERR) reported by the U.S. Energy In-
formation Administration (EIA), it is often esti-
mated that the United States has “200 years of
coal” supply.
7
However, the EIA has acknowledged
that what the EIA terms ERR cannot technically be
called “reserves” because they have not been ana-
lyzed for profitability of extraction.
7
As a result, the
oft-repeated claim of a “200 year supply” of U.S.
coal does not appear to be grounded on thorough
analysis of economically recoverable coal supplies.
Reviews of existing coal mine lifespan and eco-
nomic recoverability reveal serious constraints on
existing coal production andnumerous constraints
facing future coal mine expansion. Depending on
the resolution of the geologic, economic, legal, and
transportation constraints facing future coal mine
expansion, the planning horizon for moving be-
yond coal may be as short as 20–30 years.
8–11
Recent multi-Hubbert cycle analysis estimates
global peak coal production for 2011 and U.S. peak
coal production for 2015.
12
The potential of “peak
coal” thus raises questions for investments in coal-
fired plants and CCS.
Worldwide, China is the chief consumer of coal,
burning more than the United States, the European
Union, and Japan combined. With worldwide de-
mand for electricity, and oil and natural gas inse-
curities growing, the price of coal on global mar-
kets doubled from March 2007 to March 2008: from
$41 to $85 per ton.
13
In 2010, it remained in the
$70+/ton range.
Coal burning produces one and a half times the
CO
2
emissions of oil combustion and twice that
from burning natural gas (for an equal amount
of energy produced). The process of converting
coal-to-liquid (not addressed in this study) and
burning that liquid fuel produces especially high
levels of CO
2
emissions.
13
The waste of energy
due to inefficiencies is also enormous. Energy spe-
cialist Amory Lovins estimates that after mining,
processing, transporting and burning coal, and
transmitting the electricity, only about 3% of the en-
ergy in the coal is used in incandescent light bulbs.
14
Thus, in the United States in 2005, coal produced
50% of the nation’s electricity but 81% of the CO
2
emissions.
1
For 2030, coal is projected to produce
53% of U.S. power and 85% of the U.S. CO
2
emis-
sions from electricity generation. None of these fig-
ures includes the additional life cycle greenhouse
gas (GHG) emissions from coal, including methane
from coal mines, emissions from coal transport,
other GHG emissions (e.g., particulates or black
carbon), and carbon and nitrous oxide (N
2
O) emis-
sions from land transformation in the case of MTR
coal mining.
Coal mining and combustion releases many more
chemicals than those responsible for climate forc-
ing. Coal also contains mercury, lead, cadmium, ar-
senic, manganese, beryllium, chromium, and other
toxic, and carcinogenic substances. Coal crushing,
processing, and washing releases tons of particulate
matter and chemicals on an annual basis a nd con-
taminates water, harming community public health
and ecological systems.
15–19
Coal combustion also
results in emissions of NO
x
, sulfur dioxide (SO
2
),
74 Ann. N.Y. Acad. Sci. 1219 (2011) 73–98
c
2011 New York Academy of Sciences.
Epstein et al. Full cost accounting for the life cycle of coal
the particulates PM
10
and PM
2.5
,andmercury;all
of which negatively affect air quality and public
health.
20–23
In addition, 70% of rail traffic in the United States
is dedicated to shipping coal, and rail transport is
associated with accidents and deaths.
20
If coal use
were to be expanded, land and transpor t infrastruc-
ture would b e further stressed.
Summary of methods
Life cycle analysis, examining all stages in using a re-
source, is central to the full cost accounting needed
to guide public policy and private investment. A
previous study examined the life cycle stages of oil,
but without systematic quantification.
24
This pa-
per is intended to advance understanding of the
measurable, quantifiable, and qualitative costs of
coal.
In order to rigorously examine these different
damage endpoints, we examined the many stages
in the life cycle of coal, using a framework of en-
vironmental externalities, or “hidden costs.” Exter-
nalities occur when the activity of one agent affects
the well-being of another agent outside of any type
of market mechanism—these are often not taken
into account in decision making and when they are
not accounted for, they can distort the decision-
making process and reduce the welfare of society.
20
This work strives to derive monetary values for these
externalities so that they can be used to inform
policy making.
This paper tabulates a wide range of costs as-
sociated with the full life cycle of coal, separating
those that are quantifiable and monetizable; those
thatarequantifiable,butdifficulttomonetize;and
those that are qualitative.
A literature review was conducted to consolidate
all impacts of coal-generated electricity over its life
cycle, monetize and tabulate those that are mon-
etizable, quantify those that are quantifiable, and
describe the qualitative impacts. Since there is some
uncertainty in the monetization of the damages,
low, best, and high estimates are presented. The
monetizable impacts found are damages due to cli-
mate change; public health damagesfrom NO
x
,SO
2
,
PM
2.5
, and mercury emissions; fatalities of mem-
bers of the public due to rail accidents during coal
transport; the public health burden in Appalachia
associated with coal mining; government subsidies;
and lost value of abandoned mine lands. All values
are presented in 2008 US$. Much of the research we
draw upon represented uncertainty by presenting
low and/or high estimates in addition to best esti-
mates. Low a nd high values can indicate both un-
certainty in parameters and different assumptions
about the parameters that others used to calculate
their estimates. Best estimates are not weighted av-
erages, and are derived differently for each category,
as explained below.
Climate impacts were monetized using estimates
of the social cost of carbon—the valuation of the
damages due to emissions of one metric ton of car-
bon, of $30/ton of CO
2
equivalent (CO
2
e),
20
with
low and high estimates of $10/ton and $100/ton.
There is uncertainty around the total cost of climate
change and its present value, thus uncertainty con-
cerning the social cost of carbon derived from the
total costs. To test for sensitivity to the assumptions
about the total costs, low and high estimates of the
social cost of carbon were used to produce low and
high estimates for climate damage, as was done in
the 2009 National Research Council (NRC) report
on the “Hidden Costs of Energy.”
20
To be consistent
with the NRC report, this work uses a low value of
$10/ton CO
2
e and a high value of $100/ton CO
2
e.
All public health impacts due to mortality were
valued using the value of statistical life (VSL). The
value most commonly used by the U.S. Environ-
mental Protection Agency (EPA), and used in this
paper, is the central estimate of $6 million 2000 US$,
or $7.5 million in 2008 US$.
20
Two values for mortality risk from exposure to
air pollutants were found and differed due to differ-
ent concentration-response functions—increases in
mortality risk associated with exposure to air pol-
lutants. The values der ived using the lower of the
two concentration-response functions is our low
estimate, and the higher of the two concentration-
response functions is our best and high estimate,
for reasons explained below. The impac ts on cog-
nitive development and cardiovascular disease due
to mercury exposure provided low, best, and high
estimates, and these are presented here.
Regarding federal subsidies, two different esti-
mates were found. To provide a conservative best
estimate, the lower of the two values represents our
low and best estimate, and the higher represents our
high estimate. For the remaining costs, one point
estimate was found in each instance, representing
our low, best, and high estimates.
Ann. N.Y. Acad. Sci. 1219 (2011) 73–98
c
2011 New York Academy of Sciences. 75
Full cost accounting for the life cycle of coal Epstein et al.
The monetizable impacts were normalized to per
kWh of electricity produced, based on EIA estimates
of electricity produced from coal, as was done in the
NRC report tabulating externalities due to coal.
2,20
Some values were for all coal mining, not just for the
portion emitted due to coal-derived electricity. To
correct for this, the derived values were multiplied
by the proportion of coal that was used for electrical
power, which was approximately 90% in all years
analyzed. The additional impacts from nonpower
uses of coal, however, are not included in this anal-
ysis but do add to the assessment of the complete
costs of coal.
To validate the findings, a life cycle assessment
of coal-derived electricity was also performed us-
ing the Ecoinvent database in SimaPro v 7.1.
25
Health-related impact pathways were monetized us-
ing the value of disability-adjusted life-years from
ExternE,
26
and the social costs of carbon.
20
Due to
data limitations, this method could only be used to
validate damages due to a subset of endpoints.
Box 2.
Summary Stats
1. Coal accounted for 25% of global energy con-
sumption in 2005, but generated 41% of the
CO
2
emissions that year.
2. In the United States, coal produces just over
50% of the electri city, but generates over 80%
of the CO
2
emissions from the utility sector.
2
3. Coal burning produces one and a half times
more CO
2
emissions than does burning oil
and twice that from burning natural gas (to
produce an equal amount of energy).
4. The energy penalty from CCS (25–40%)
would increase the amount of coal mined,
transported, processed, and combusted, and
the waste generated.
4
5. Today, 70% of rail traffic in the United States
is dedicated to shipping coal.
20
Land and
transport would be further stressed with
greater dependence on coal.
Lifecycleimpactsofcoal
The health and environmental hazards associated
with coal stem from extr action, processing, trans-
portation and combustion of coal; the aerosolized,
solid, and liquid waste stream associated with min-
ing, processing, and combustion; and the health,
environmental, and economic impacts of climate
change (Table 1).
Underground mining and occupational health
The U.S. Mine Safety and Health Administration
(MSHA) and the National Institute for Occupa-
tional Safety and Health (NIOSH) track occupa-
tional injuries and disabilities, chronic illnesses, and
mortality in miners in the United States. From 1973
to 2006 the incidence rate of all nonfatal injuries de-
creased from 1973 to 1987, then increased dramat-
ically in 1988, then decreased from 1988 to 2006.
27
Major accidents still occur. In January 2006, 17 min-
ers died in Appalachian coal mines, including 12 at
the Sago mine in West Virginia, and 29 miners died
at the Upper Big Branch Mine in West VA on April
5, 2010. Since 1900 over 100,000 have been killed in
coal mining accidents in the United States.
14
In China, underground mining accidents cause
3,800–6,000 deaths annually,
28
though the number
of mining-related deaths has decreased by half over
the past decade. In 2009, 2,631 coal miners were
killed by gas leaks, explosions, or flooded tunnels,
according to the Chinese State Administration of
Work Sa f e ty.
29
Black lung disease (or pneumoconiosis), leading
to chronic obstructive pulmonary disease, is the pri-
mary illness in underground coal miners. In the
1990s, over 10,000 former U.S. miners died from
coal workers’ pneumoconiosis and the prevalence
has more than doubled since 1995.
30
Since 1900 coal
workers’ pneumoconiosis has killed over 200,000 in
the United States.
14
These deaths and illnesses are
reflected in wages and workers’ comp, costs con-
sidered internal to the coal industry, but long-term
support often depends on state and federal funds.
Again, the use of “coking” coal used in indus-
try is also omitted from this analysis: a study per-
formed in Pittsburgh demonstrated that rates of
lung cancer for those working on a coke oven
went up two and one-half times, and those work-
ing on the top level had the highest (10-fold)
risk.
31
Mountaintop removal
MTR is widespread in eastern Kentucky, West Vir-
ginia, and southwestern Virginia. To expose coal
seams, mining companies remove forests and frag-
ment rock with explosives. The rubble or “spoil”
76 Ann. N.Y. Acad. Sci. 1219 (2011) 73–98
c
2011 New York Academy of Sciences.
Epstein et al. Full cost accounting for the life cycle of coal
then sits precariously along edges and is dumped
in the valleys below. MTR has been completed
on approximately 500 sites in Kentucky, Virginia,
West Virginia, and Tennessee,
32
completely alter-
ing some 1.4 million acres, burying 2,000 miles of
streams.
33
In Kentucky, alone, there are 293 MTR
sites, over 1,400 miles of streams damaged or de-
stroyed, and 2,500 miles of streams polluted.
34–36
Valley fill and other sur face mining practices asso-
ciated with MTR bury headwater streams and con-
taminate surface and groundwater with carcinogens
and heavy metals
16
and are associated with reports
of cancer clusters,
37
a finding that requires further
study.
The deforestation and landscape changes asso-
ciated with MTR have impacts on carbon storage
and water cycles. Life cycle GHG emissions from
coal increase by up to 17% when those from defor-
estation and land transformation by MTR are in-
cluded.
38
Fox and Campbell estimated the resulting
emissions of GHGs due to land use changes in the
Southern Appalachian Forest, which encompasses
areas of southern West Virginia, eastern Kentucky,
southwestern Virginia, and portions of eastern
Tennessee, from a baseline of existing forestland.
38
They estimated that each year, between 6 and 6.9
million tons of CO
2
e are emitted due to removal of
forest plants and decomposition of forest litter, and
possibly significantly more from the mining “spoil”
and lost soil carbon.
The fate of soil car bon and the fate of mining
spoil, which contains high levels of coal fragments,
termed “geogenic organic carbon,” are extremely
uncertain and the results depend on mining prac-
tices at particular sites; but they may represent sig-
nificant emissions. The Fox and Campbell
38
analysis
determined that the worst-case scenario is that all
soil carbon is lost and that a ll carbon in mining
spoil is emitted—representing emissions of up to
2.6 million tons CO
2
efromsoiland27.5million
tons CO
2
e from mining spoil. In this analysis, the 6
million tons CO
2
e from forest plants and forest lit-
ter represents our low and best estimates for all coal
use, and 37 million tons CO
2
e (the sum of the high
bound of forest plants and litter, geogenic organic
carbon, and the forest soil emissions) represents our
high, upper bound estimate of emissions for all coal
use. In the years Fox and Campell studied, 90.5% of
coal was used for electricity, so we attribute 90.5%
of these emissions to coal-derived power.
2
To m on -
etize and bound our estimate for damages due to
emissions from land disturbance, our point esti-
mate for the cost was calculated using a social cost
of carbon of $30/ton CO
2
e and our point estimate
for emissions; the high-end estimate was calculated
using the high-end estimate of emissions and a so-
cial cost of carbon of $100/ton CO
2
e; and the low
estimate was calculated using the point estimate for
emissions and the $10/ton low estimate for the so-
cial cost of carbon.
20
Our best estimate is therefore
$162.9 million, with a range from $54.3 million and
$3.35 billion, or 0.008¢/kWh, ranging from 0.003
¢/kWh to 0.166 ¢/kWh.
The physical vulnerabilities for communities near
MTR sites include mudslides and dislodged boul-
ders and trees, and flash floods, especially following
heavy rain events. With climate change, heavy rain-
fall events (2, 4, and 6 inches/day) have increased in
the continental United States since 1970, 14%, 20%,
and 27% respectively.
39,40
Blasting to clear mountain ridges adds an addi-
tional assault to surrounding communities.
16
The
blasts can damage houses, other buildings, and in-
frastructure, and there are numerous anecdotal re-
ports that the explosions and vibrations are taking
a toll on the mental health of those living nearby.
Additional impacts include losses in prop-
erty values, timber resources, crops (due to wa-
ter contamination), plus harm to tourism, cor-
rosion of buildings and monuments, dust from
mines and explosions, ammonia releases (with for-
mation of ammonium nitrate), and releases of
methane.
41
Methane
In addition to being a heat-trapping gas of high
potency, methane adds to the risk of explosions,
and fires at mines.
20,42
As of 2005, global atmo-
spheric methane levels were approximately 1,790
parts per billion (ppb), which is an 27 ppb increase
over 1998.
43
Methane is emitted during coal min-
ing and it is 25 times more potent than CO
2
dur-
ing a 100-year timeframe (this is the 100-year global
warming potential, a common metric in climate sci-
ence and policy used to normalize different GHGs
to carbon equivalence). When methane decays, it
can yield CO
2
, an effec t that is not fully assessed in
this equivalency value.
43
According to the EIA,
2
71,100,000 tons CO
2
e
of methane from coal were emitted in 2007 but
Ann. N.Y. Acad. Sci. 1219 (2011) 73–98
c
2011 New York Academy of Sciences. 77
Full cost accounting for the life cycle of coal Epstein et al.
Table 1. The life cycle impact of the U.S. coal industry
Economic Human health Environment Other
Underground
coal mining
1. Federal and state
subsidies of coal
industry
1. Increased mortality
and morbidity in coal
communities due to
mining pollution
1. Methane emissions
from coal leading
to climate change
2. Threats remaining
from abandoned mine
lands
2. Remaining damage
from abandoned
mine lands
MTR mining 1. Tourism loss 1. Contaminated streams 1. Loss of biodiversity
2. Significantly lower
property values
2. Direct trauma in
surrounding
communities
2. Sludge and slurry
ponds
3. Cost to taxpayers of
environmental
mitigation and
monitoring (both
mining and
disposal stages)
3. Additional mortality
and morbidity in coal
communities due to
increased levels of air
particulates associated
with MTR mining (vs.
underground mining)
3. Greater levels of air
particulates
4. Population declines 4. Higher stress levels 4. Loss and
contamination of
streams
Coal mining 1. Opportunity costs
of bypassing other
types of economic
development
(especially for
MTR mining)
1. Workplace fatalities
and injuries of coal
miners
1. Destruction of
local habitat and
biodiversity to
develop mine site
1. Infrastructure
damage due to
mudslides
following MTR
2. Federal and state
subsidies of coal
industry
2. Morbidity and
mortality of mine
workers resulting from
air pollution (e.g.,
black lung, silicosis)
2. Methane emissions
from coal leading
to climate change
2. Damage to
surrounding
infrastructure from
subsidence
3. Economic boom
and bust cycle in
coal mining
communities
3. Increased mortality
and morbidity in coal
communities due to
mining pollution
3. Loss of habitat and
streams from valley
fill (MTR)
3. Damages to
buildings and other
infrastructure due
to mine blasting
4. Cost of coal
industry litigation
4. Increased morbidity
and mortality due to
increased air
particulates in
communities
proximate to MTR
mining
4. Acid mine drainage 4. Loss of recreation
availability in coal
mining
communities
Continued
78 Ann. N.Y. Acad. Sci. 1219 (2011) 73–98
c
2011 New York Academy of Sciences.
Epstein et al. Full cost accounting for the life cycle of coal
Table 1. Continued
Economic Human health Environment Other
5. Damage to
farmland and crops
resulting from coal
mining pollution
5. Hospitalization costs
resulting from
increased morbidity in
coal communities
5. Incomplete
reclamation
following mine use
5. Population losses
in abandoned
coal-mining
communities
6. Local health impacts
of heavy metals in coal
slurry
6. Water pollution
from runoff and
waste spills
6. Loss of income
from small scale
forest gathering
and farming (e.g.,
wild ginseng,
mushrooms) due
to habitat loss
7. Health impacts
resulting from coal
slurry spills and water
contamination
7. Remaining damage
from abandoned
mine lands
7. Loss of tourism
income
8. Threats remaining
from abandoned mine
lands; direct trauma
from loose boulders
andfelledtrees
8. Air pollution due
to increased
particulates from
MTR mining
8. Lost land required
for waste disposal
9. Mental health impacts
9. Lower property
values for
homeowners
10. Dental health impacts
reported, possibly
from heavy metals
10. Decrease in
mining jobs in
MTR mining areas
11. Fungal growth after
flooding
Coal transporta-
tion
1. Wear and tear on
aging railroads and
tracks
1. Death and injuries
from accidents during
transport
1. GHG emissions
from transport
vehicles
1. Damage to rail
system from coal
transportation
2. Impacts from
emissions during
transport
2. Damage to
vegetation
resulting from air
pollution
2. Damage to
roadways due to
coal trucks
Coal
combustion
1. Federal and state
subsidies for the
coal industry
1. Increased mortality
and morbidity due to
combustion pollution
1. Climate change due
to CO
2
and NO
x
derived N
2
O
emissions
1. Corrosion of
buildings and
monuments from
acid rain
2. Damage to
farmland and crops
resulting from coal
combustion
pollution
2. Hospitalization costs
resulting from
increased morbidity in
coal communities
2. Environmental
contamination as a
result of heavy
metal pollution
(mercury,
selenium, arsenic)
2. Visibility
impairment from
NO
x
emissions
Continued
Ann. N.Y. Acad. Sci. 1219 (2011) 73–98
c
2011 New York Academy of Sciences. 79
Full cost accounting for the life cycle of coal Epstein et al.
Table 1. Continued
Economic Human health Environment Other
3. Higher frequency of
sudden infant death
syndrome in areas
with high quantities of
particulate pollution
3. Impacts of acid
rain derived from
nitrogen oxides
and SO
2
4. See Levy et al.
21
4. Environmental
impacts of ozone
and particulate
emissions
5. Soil contamination
from acid rain
6. Destruction of
marine life from
mercury pollution
and acid rain
7. Freshwater use in
coal powered
plants
Waste disposal 1. Health impacts of
heavy metals and other
contaminants in coal
ash and other waste
1. Impacts on
surrounding
ecosystems from
coal ash and other
waste
2. Health impacts,
trauma and loss of
property following
coal ash spills
2. Water pollution
from runoff and fly
ash spills
Electricit y
transmission
1. Loss of energy in
the combustion
and transmission
phases
1. Disturbance of
ecosystems by
utility towers and
rights of way
1. Vulnerability of
electrical gr id to
climate change
associated disasters
only 92.7% of this coal is going toward electric-
ity. This results in estimated damages of $2.05 bil-
lion, or 0.08¢/kWh, with low and high estimates of
$684 million and $6.84 billion, or 0.034¢/kWh, and
0.34¢/kWh, using the low and high estimates for the
social cost of carbon.
20
Life cycle assessment results,
based on 2004 data and emissions from a subset of
powerplants, indicated 0.037 kg of CO
2
e of methane
emitted per kWh of elect ricity produced. With the
best estimate for the social cost of carbon, this leads
to an estimated cost of $2.2 billion, or 0.11¢/kWh.
The differences are due to differences in data, and
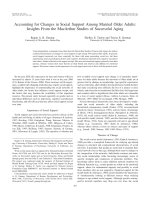
data from a different years. (See Fig. 1 for summary
of external costs per kWh.)
Impoundments
Impoundments are found all along the periphery
and at multiple elevations in the areas of MTR sites;
adjacent to coal processing plants; and as coal com-
bustion waste (“fly ash”) ponds adjacent to coal-
fired power plants.
47
Their volume and composi-
tion have not been calculated.
48
For Kentucky, the
number of known waste and slurry ponds along-
side MTR sites and processing plants is 115.
49
These
80 Ann. N.Y. Acad. Sci. 1219 (2011) 73–98
c
2011 New York Academy of Sciences.
Epstein et al. Full cost accounting for the life cycle of coal
Figure 1. This graph shows the best estimates of the external-
ities due to coal, along with low and high estimates, normal-
ized to ¢ per kWh of electricity produced. (In color in Annals
online.)
sludge, slurry and coal combustion waste (CCW)
impoundments are considered by the EPA to be sig-
nificant contributors to water contamination in the
United States. This is especially true for impound-
ments situated atop previously mined and poten-
tially unstable sites. Land above tunnels dug for
long-haul and underground mining are at risk of
caving. In the face of heavier precipitation events,
unlined containment dams, or those lined with
dried slurry are vulnerable to breaching and col-
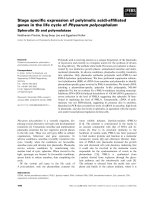
lapse (Fig. 2).
Processing plants
After coal is mined, it is washed in a mixture of
chemicals to reduce impurities that include clay,
non-carbonaceous rock, and heavy metals to pre-
pare for use in combustion.
50
Coal slurry is the by-
product of these coal refining plants. In West Vir-
ginia, there are currently over 110 billion gallons of
coal slurry permitted for 126 impoundments.
49,51
Between 1972 and 2008, there were 53 publicized
coal slurry spills in the Appalachian region, one of
the largest of which was a 309 million gallon spill
that occurred in Martin County, KY in 2000.
48
Of
the known chemicals used and generated in pro-
cessing coal, 19 are known cancer-causing agents,
24 are linked to lung and heart damage, and several
remain untested as to their health effects.
52,53
Figure 2. Electric power plants, impoundments (sludge and
slurry ponds, CCW, or “fly ash”), and sitesslated for reclamation
in West Virginia.
44–46
(In color in Annals online.) Source: Hope
Childers, Wheeling Jesuit University.
Coal combustion waste or fly ash
CCW or fly ash—composed of products of combus-
tion and other solid waste—contains toxic chemi-
cals and heavy metals; pollutants known to cause
cancer, birth defects, reproductive disorders, neuro-
logical damage, learning disabilities, kidney disease,
and diabetes.
47,54
A vast majority of the over 1,300
CCW impoundment ponds in the United States are
poorly constructed, increasing the risk that waste
may leach into groundwater supplies or nearby bod-
ies of water.
55
Under the conditions present in fly
ash ponds, contaminants, particularly arsenic, an-
timony, and selenium (all of which can have seri-
ous human health impacts), may readily leach or
migrate into the water supplied for household and
agricultural use.
56
According tothe EPA,annual production of CCW
increased 30% per year between 2000 and 2004, to
130 million tons, and is projected to increase to over
170 million tons by 2015.
57
Based on a series of state
estimates, approximately 20% of the total is injected
into abandoned coal mines.
58
In Kentucky, alone, there are 44 fly ash ponds
adjacent to the 22 coal-fired plants. Seven of these
ash ponds have been characterized as “high hazard”
Ann. N.Y. Acad. Sci. 1219 (2011) 73–98
c
2011 New York Academy of Sciences. 81
Full cost accounting for the life cycle of coal Epstein et al.
by the EPA, meaning that if one of these impound-
ments spilled, it would likely cause significant prop-
erty damage, injuries, illness, and deaths. Up to 1
in 50 residents in Kentucky, including 1 in 100 chil-
dren, living near one of the fly ash ponds are at
risk of developing cancer as a result of water- and
air-borne exposure to w aste.
47
Box 3.
Tennessee Valley Authority Fly Ash Pond Spill
On December 2, 2008 an 84-acre CCW contain-
ment area spilled when the dike ruptured at the
Tennessee Valley Authority Kingston Fossil Plant
CCW impoundment, following heavy rains. Over
one billion gallons of fly ash slurry spilled across
300 acres.
Local water contamination
Over the life cycle of coal, chemicals are emitted
directly and indirectly into water supplies from
mining, processing, and power plant operations.
Chemicals in the waste stream include ammonia,
sulfur, sulfate, nitrates, nitric acid, tars, oils, fluo-
rides, chlorides, and other acids and metals, includ-
ing sodium, iron, cyanide, plus additional unlisted
chemicals.
16,50
Spath and colleagues
50
found that these emis-
sions are small in comparison to the air emissions.
However, a more recent study performed by Koorn-
neef and colleagues
59
using up-to-date data on
emissions and impacts, found that emissions and
seepage of toxins and heavy metals into fresh and
marine water were significant. Elevated levels of ar-
senic in drinking water have been found in coal
mining areas, along with ground water contamina-
tion consistent with coal mining activity in areas
near coal mining facilities.
16,17,60,61
In one study of
drinking water in four counties in West Virginia,
heavy metal concentrations (thallium, selenium,
cadmium, beryllium, barium, antimony, lead, and
arsenic) exceeded drinking water standards in one-
fourth of the households.
48
This mounting evidence
indicates that more complete coverage of water sam-
pling is needed throughout coal-field regions.
Carcinogen emissions
Data on emissions of carcinogens due to coal min-
ing and combustion are available in the Ecoin-
vent database.
25
The eco-indicator impact assess-
ment method was used to estimate health damages
in disability-adjusted life years due to these emis-
sions,
25
and were valued using the VSL-year.
26
This
amounted to $11 billion per year, or 0.6 ¢/kWh,
though these may be significant underestimates of
the cancer burden associated with coal.
Of the emissions of c arcinogens in the life cycle
inventory (inventory of all environmental flows) for
coal-derived power, 94% were emitted to water, 6%
to air, and 0.03% were to soil, mainly consisting
of arsenic and cadmium (note: these do not sum
to 100% due to rounding).
25
This number is not
included in our totalcost accountingto avoid double
counting since these emissions may be responsible
for health effects observed in mining communities.
Mining and community health
A suite of studies of county-level mortality rates
from 1979–2004 by Hendryx found that all-cause
mortality rates,
62
lung cancer mortality rates,
60
and
mortality from heart, respiratory, and kidney dis-
ease
17
were highest in heavy coal mining areas of
Appalachia, less so in light coal mining areas, lesser
still in noncoal mining areas in Appalachia, and low-
est in noncoal mining areas outside of Appalachia.
Another study performed by Hendryx and Ahern
18
found that self-reports revealed elevated rates of
lung, cardiovascular and kidney diseases, and di-
abetes and hypertension in coal-mining areas. Yet,
another study found that for pregnant women, re-
siding in coal mining areas of West Virginia posed
an independent risk for low birth weight (LBW) in-
fants, raising the odds of an LBWs infant by 16%
relative to women residing in counties without coal
mining.
63
LBW and preterm births are elevated,
64
and children born with extreme LBW fare worse
than do children with normal birth weights in al-
most all neurological assessments;
65
as adults, they
have more chronic diseases, including hypertension
and diabetes mellitus.
66
Poor birth outcomes are
especially elevated in areas with MTR mining as
compared with areas with other forms of mining.
67
MTR mining has increased in the areas studied, and
is occurring close to population centers.
62
The estimated excess mortality found in coal
mining areas is translated into monetary costs us-
ing the VSL approach. For the years 1997–2005,
excess age-adjusted mortality rates in coal min-
ing areas of Appalachia compared to national rates
82 Ann. N.Y. Acad. Sci. 1219 (2011) 73–98
c
2011 New York Academy of Sciences.
Epstein et al. Full cost accounting for the life cycle of coal
Figure 3. Areas of highest biological diversity in the continental United States. Source: The Nature Conservancy, Arlington, VA.
(In color in Annals online.)
outside Appalachia translatesto 10,923 excess deaths
every year, with 2,347 excess deaths every year
after, adjusting for other soci-oeconomic factors,
including smoking rates, obesity, poverty, and ac-
cess to health care. These socio-economic factors
were statistically significantly worse in coal-mining
areas.
18,62,68
Using the VSL of $7.5 million,
20
the unadjusted
mortality rate,and the estimate that91% of coal dur-
ing these years was used for electricity,
2
this trans-
lates to a total cost of $74.6 billion, or 4.36¢/kWh.
In contrast, the authors calculated the direct (mon-
etary value of mining industry jobs, including em-
ployees and proprietors), indirect (suppliers and
others connected to the coal industry), and in-
duced (ripple or multiplier effects throughout the
economies) economic benefits of coal mining to Ap-
palachia, and estimated the benefits to be $8.08 bil-
lion in 2005 US$.
Ecological impacts
Appalachia is a biologically and geologically rich
region, known for its variety and striking beauty.
There is loss and degradation of habitat from MTR;
impacts on plants and wildlife (species losses and
species impacted) from land and water contami-
nation, and acid rain deposition and altered stream
conductivity; and the contributions of deforestation
and soil disruption to climate change.
16,20
Globally, the rich biodiversity of Appalachian
headwater streams is second only to the tropics.
69
For example, the southern Appalachian mountains
harbor the greatest diversity of salamanders glob-
ally, with 18% of the known species world-wide
(Fig. 3).
69
Imperiled aquatic ecosystems
Existence of viable aquatic communities in val ley fill
permit sites was first elucidated in court testimony
leading to the “Haden decision.”
70
An interagency
study of 30 streams in MTR mining-permit areas fo-
cused on the upper, unmapped reaches of headwa-
ter streams in West Virginia and Kentucky.
71
In per-
forming this study, the researchers identified 71 gen-
era of aquatic insects belonging to 41 families within
eight insect orders. The most widely distributed
taxa in 175 samples were found in abundance in
30 streams in five areas slated to undergo MTR.
Ann. N.Y. Acad. Sci. 1219 (2011) 73–98
c
2011 New York Academy of Sciences. 83
Full cost accounting for the life cycle of coal Epstein et al.
Electrical conductivity (a measure of the concen-
tration of ions) is used as one indicator of stream
health.
72
TheEPArecommendsthatstreamconduc-
tivity not exceed 500 microsiemens p er cm (uS/cm).
In areas with the most intense mining, in which 92%
of the watershed had been mined, a recent study re-
vealed levels of 1,100 uS/cm.
72
Meanwhile, even levels below 500 uS/cm were
shown to significantly affect the abundance and
composition of macroinvertebrates, such as mayflies
and caddis flies.
73
“Sharp declines” were found in
some stream invertebrates where only 1% of the
watershed had been mined.
74,75
Semivoltine aquatic insects (e.g., many stoneflies
and dragonflies)—those that require multiple years
in the larval stage of development—were encoun-
tered in watersheds as small as 10–50 acres. While
many of these st reams become dry during the late
summer months, the y continue to harbor perma-
nent resident taxonomic groups capable of with-
standing summer dry conditions. Salamanders, the
top predatory vertebrates in these fishless headwa-
ter streams, depend on permanent streams for their
existence.
Mussels are a sensitive indicator species of stream
health. Waste from surface mines in Virginia and
Tennessee running off into the Clinch and Pow-
ell Rivers are overwhelming and killing these fil-
ter feeders, and the populations of mussels in these
rivers has declined dramatically. Decreases in such
filter feeders also affect the quality of drinking water
downstream.
76
In addition, stream dwelling larval stages of
aquatic insects are impossible to identify to the
species level without trapping adults or rearing lar-
vae to adults.
77
However, no studies of adult stages
are conducted for mining-permit applications.
The view that—because there are so many
small streams and brooks in the Appalachians—
destroying a portion represents a minor threat to
biodiversity is contrary to the science. As the planet’s
second-oldest mountain range, geologically recent
processes in Appalachia in the Pleistocene epoch
(from 2.5 million to 12,000 years ago) have created
conditions for diversification, resulting in one of the
U.S. biodiversity “hotspots” (Fig . 3).
Thus, burying an entire 2,000 hectare w atershed,
including the mainstream and tributaries, is likely
to eliminate species of multiple taxa found only in
Appalachia.
Researchers have concluded that many unknown
species of aquatic insects have likely been buried un-
der valley fills and affected by chemically contami-
nated waterways. Today’s Appalachian coal mining
is undeniably resulting in loss of aquatic species,
many of which will never be known. Much more
study is indicated to appreciate the full spectrum of
the ecological effects of MTR mining.
78
Transport
There are direct hazards from transport of coal. Peo-
ple in mining communities report that road hazards
and dust levels a re intense. In many cases dust is so
thick that it coats the skin, and the walls and fur-
niture in homes.
41
This dust presents an additional
burden in terms of respiratory and cardiovascular
disease, some of which may have been captured by
Hendryx and colleagues.
17–19,60,62,67,68,79
With 70% of U.S. rail traffic devoted to transport-
ing coal, there are strains on the railroad cars and
lines, and (lost) opportunity costs, given the great
need for public transport throughout the nation.
20
The NRC report
20
estimated the number of rail-
road fatalities by multiplying the proportion of
revenue-ton miles (the movement of one ton of
revenue-generating commodity over one mile) of
commercial freight activity on domestic railroads
accounted for by coal, by the number of public fa-
talities on freight railroads (in 2007); then multi-
plied by the proportion of transported coal used for
electricity generation. The number of coal-related
fatalities was multiplied by the VSL to estimate the
total costs of fatal accidents in coal transportation. A
total of 246 people were killed in rail accidents dur-
ing coal transportation; 241 of these were members
of the public and five of these were occupational
fatalities. The deaths to the public add an additional
cost of $1.8 billion, or 0.09¢/kWh.
Social and employment impacts
In Appalachia, as levels of mining increase, so do
poverty rates and unemployment rates, while ed-
ucational attainment rates and household income
levels decline.
19
While coal production has been steadily increas-
ing (from 1973 to 2006), the number of employees
at the mines increased dramatically from 1973 to
1979, then decreased to levels below 1973 employ-
ment levels.
27
Between 1985 and 2005 employment
in the Appalachian coal mining industry declined by
56% due to increases in mechanization for MTR and
84 Ann. N.Y. Acad. Sci. 1219 (2011) 73–98
c
2011 New York Academy of Sciences.
Epstein et al. Full cost accounting for the life cycle of coal
other surface mining.
19,27
There are 6,300 MTR and
surface mining jobs in West Virginia, representing
0.7–0.8% of the state labor force.
2
Coal companies
are also employing more people through temporary
mining agencies and populations are shifting: be-
tween 1995 and 2000 coal-mining West Virginian
counties experienced a net loss of 639 people to mi-
gration compared with a net migration gain of 422
people in nonmining counties.
19,80
Combustion
The next stage in the life cycle of coal is combus-
tion to generate energy. Here we focus on coal-
fired electricity-generating plants. The by-products
of coal combustion include CO
2
, methane, partic-
ulates and oxides of nitrogen, oxides of sulfur, mer-
cury, and a wide range of carcinogenic chemicals
and heavy metals.
20
Long-range air pollutants and air quality. Data
from the U.S. EPA’s Emissions & Generation Re-
source Integrated Database (eGRID)
81
and National
Emissions Inventory (NEI)
82
demonstrates that coal
power is responsible for much of the U.S. power
generation-related emissions of PM
2.5
(51%), NO
x
(35%), and SO
2
(85%). Along with primary emis-
sions of the particulates, SO
2
and NO
x
contribute
to increases in airborne particle concentrations
through secondary transformation processes.
20,21,83
Studies in New England
84
find that, although
populations within a 30-mile radius of coal-fired
power plants make up a small contribution to ag-
gregate respiratory illness, on a per capita basis, the
impacts on those nearby populations are two to five
times greater than those living at a distance. Data in
Kentucky suggest similar zones of high impact.
The direct health impac ts of SO
2
include res-
pirator y illnesses—wheezing and exacerbation of
asthma, shortness of breath, nasal congestion, and
pulmonary inflammation—plus heart arrhythmias,
LBW, and increased risk of infant death.
The nitrogen-containing emissions (from burn-
ing all fossil fuels and from agriculture) cause dam-
ages through several pathways. When combined
with volatile organic compounds, they can form
not only particulates but also ground-level ozone
(photochemical smog). Ozone itself is corrosive to
the lining of the lungs, and also acts as a local heat-
trapping gas.
Epidemiology of air pollution. Estimates of non-
fatal health endpoints from coal-related pollutants
vary,but are substantial—including 2,800 from lung
cancer, 38,200 nonfatal heart attacks and tens of
thousands of emergency room visits, hospitaliza-
tions, and lost work days.
85
Areview
83
of the epi-
demiology of airborne particles documented that
exposure to PM
2.5
is linked with all-cause prema-
ture mortality, cardiovascular and cardiopulmonary
mortality, as well as respiratory illnesses, hospital-
izations, respiratory and lung function symptoms,
and school absences. Those exposed to a higher
concentration of PM
2.5
were at higher risk.
86
Par-
ticulates are a cause of lung and heart disease,
and premature death,
83
and increase hospitaliza-
tion costs. Diabetes mellitus enhances the health
impacts of particulates
87
and has been implicated
in sudden infant death syndrome.
88
Pollution from
two older coal-fired power plants in the U.S. North-
east was linked to approximately 70 deaths, tens
of thousands of asthma attacks, and hundreds of
thousands of episodes of upper respiratory illnesses
annually.
89
A reanalysis of a large U.S. cohort study on the
health effects of air pollution, the Harvard Six Cities
Study,by Schwartz et al.
90
used year-to-year changes
in PM
2.5
concentrations instead of assigning each
city a constant PM
2.5
concentration. To construct
one composite estimate for mortality risk from
PM
2.5
, the reanalysis also allowed for yearly lags in
mortality effects from exposure to PM
2.5
,andre-
vealed that the relative risk of mortality increases
by 1.1 per 10 g/m
3
increase in PM
2.5
the year of
death,butjust1.025per10g/m
3
increase in PM
2.5
the year before death. This indicates that most of
the increase in risk of mortality from PM
2.5
expo-
sure occurs in the same year as the exposure. The
reanalysis also found little evidence for a threshold,
meaning that there may be no “safe” levels of PM
2.5
and that all levels of PM
2.5
pose a risk to human
health.
91
Thus, prevention strategies should be focused on
continuous reduction of PM
2.5
rather than on peak
days, and that air quality improvements will have ef-
fect almost immediately upon implementation. The
U.S. EPA annual particulate concentration standard
issetat15.0g/m
3
, arguing that there is no evi-
dence for harm below this level.
92
The results of the
Schwartz et al.
90
study directly contradict this line
of reasoning.
Ann. N.Y. Acad. Sci. 1219 (2011) 73–98
c
2011 New York Academy of Sciences. 85
Full cost accounting for the life cycle of coal Epstein et al.
Risk assessment. The risk assessment performed
by the NRC,
20
found aggregate damages of $65 bil-
lion, including damages to public health, property,
crops, forests, foregone recreation, and visibility due
to emissions from coal-fired power plants of PM
2.5
,
PM
10
,SO
2
,NO
x
, volatile organic compounds, and
ozone. The public health damages included mor-
tality cases, bronchitis cases, asthma cases, hospital
admissions related to respiratory, cardiac, asthma,
coronary obstructive pulmonary disease, and is-
chemic heart disease problems, and emergency
room visits related to asthma. On a plant-by-plant
basis after being normalized to electricity produced
by each plant, this was 3.2 ¢/kWh. Plant-by-plant
estimates of the damages ranged from 1.9 ¢/kWh
to 12 ¢/kWh. P lant-to-plant variation was largely
due to controls on the plant, characteristics of the
coal, and the population downwind of the plant.
Emissions of SO
2
were the most damaging of the
pollutants affecting air quality, and 99% of this was
due to SO
2
in the particle form.
20
The NRC study
found that over 90% of the damages due to air qual-
ity are from PM
2.5
-related mortality, which implies
that these damages included approximately 8,158
excess mortality cases.
20
For the state of Kentucky
alone, for each ton of SO
2
removed from the stack,
the NRC (2009)
20
calculated a public health savings
of $5,800. Removing the close to 500,000 tons emit-
ted in Kentucky would save over $2.85 billion annu-
ally. The life cycle analysis found that damages from
air quality public health impacts, monetized using
methods from ExternE
26
are approximately $70.5
billion, which is roughly in line with this number.
The NRC’s estimate is likely an underestimate,
since the NRC used the concentration-response
curve from Pope and Dockery,
83
which provides
a low estimate for increases in mortality risk with
increases in PM
2.5
exposure and is an outlier when
compared to other studies examining the PM
2.5
–
mortality relationship.
6,87
Had they used the result
of the more recent study by Schwartz et al .,
90
which
was used in a similar study by Levy et al .,
21
or
the number from Dockery et al.,
93
the value they
calculated would have been approximately three
times higher,
20
therefore implying 24,475 excess
deaths in 2005, w ith a cost of $187.5 billion, or
9.3¢/kWh. As the Schwartz et al . study is more re-
cent, uses elabor a te statistical techniques to derive
the concentration-response function for PM
2.5
and
mortality, and is now widely accepted,
21,94
we use it
here to derive our best and high estimate, and the
Pope and Dockery ,
83
estimate to derive our low. Our
best and high estimates for the damages due to air
quality detriment impacts are both $187.5 billion,
and our low is $65 billion. On a per-kWh basis, this
is an average cost of 9.3 ¢/kWh with a low estimate
of 3.2 ¢/kWh.
Atmospheric nitrogen deposition. In addition to
the impacts to air quality and public health, nitrogen
causes ecological harm via eutrophication. Eutroph-
ication, caused by excess nitrogen inputs to coastal
river zones, is the greatest source of water quality
alteration in the United States and atmospheric de-
position is one of the dominant sources of nitrogen
inputs.
95
In an analysis by Jaworkski et al.,
95
pre-
pared for the EPA, 10 benchmark watersheds in the
U.S. Northeast that flowed into the Atlantic coastal
zone with good historical data were analyzed in con-
junction with emissions data and reconstructed his-
torical emissions. They found that the contribution
to riverine nitrogen from nitrogen deposited from
the air ranged from 36% to 80%, with a mean of
64%.
The other primary sources of nitrogen are fertiliz-
ers from point (e.g., river) discharges and nonpoint
(e.g., agricultural land) sources, and other point
sources including sewage from cities and farm ani-
mals, especially concentrated animal feeding oper-
ations.
95
Anthropogenic contributions of nitrogen
are equal to the natural sources, doubling this form
of fertilization of soils and water bodies.
96
Harmful algal blooms and dead zones
Ocean and water changes are not usually associated
with coal. But nitrogen deposition is a by-product
of combustion and the EPA
97
has reached consen-
sus on the link between aquatic eutrophication and
harmful algal blooms (HABs), and concluded that
nutrient over-fertilization is one of the reasons for
their expansion in the United States and other na-
tions. HABs are characterized by discolored water,
dead and dying fish, and respiratory irritants in the
air, and have impacts including illness and death,
beach closures, and fish, bird, and mammal die-offs
from exposure to toxins. Illnesses in humans in-
clude gastroenteritis, neurological deficits, respira-
tory illness, and diarrheic, paralytic, and neurotoxic
shellfish poisonings.
N
2
O from land clearing is a heat-trapping gas
38,42
and adds to the nitrogen deposited in soils and water
86 Ann. N.Y. Acad. Sci. 1219 (2011) 73–98
c
2011 New York Academy of Sciences.
Epstein et al. Full cost accounting for the life cycle of coal
bodies. The nitrogen is also a contributor to fresh
and sea water acidification.
98–100
Other factors in-
clude the loss of wetlands that filter discharges.
98–100
The economic losses from HABs are estimated
to be over $82 million/year in the United States,
based on the most prominent episodes.
101,102
The
full economic costs of HABs include public health
impacts and health care costs, business interrup-
tions of seafood and other allied industries (such as
tourism and recreation, unemployment of fin- and
shellfish fisherman and their families), and disrup-
tions of international trade.
98–100
The overfertilization of coastal zones worldwide
has also led to over 350 “dead zones” with hypoxia,
anoxia, and death of living mar ine organisms. Com-
mercial and recreational fisheries in the Gulf of Mex-
ico generate $2.8 billion annually
103
and losses from
the heavily eutrophied Gulf of Mexico dead zone
put the regional economy at risk.
Acid precipitation. In addition to the health im-
pacts of SO
2
, sulfates contribute to acid rain, de-
creased visibility, and have a greenhouse cooling
influence.
20
The long-term Hubbard Brook Ecosystem
Study
104
has demonstrated that acid rain (from sul-
fates and nitrates) has taken a toll on stream and
lake life, and soils and forests in the United States,
primarily in the Northeast. The leaching of calcium
from soils is widespread and, unfortunately, the re-
covery time is much longer than the time it takes
for calcium to become depleted under acidic condi-
tions.
105
No monetized values of costs were found but
a value for the benefits of improvements to the
Adirondack State Park from acid rain legislation was
produced by Resources for the Future, and found
benefits ranging from $336 million to $1.1 billion
per year.
106
Mercury. Coal combustion in the U.S. releases ap-
proximately 48 tons of the neurotoxin mercury
each year.
54
The most toxic form of mercury is
methylmercury, and the primary route of human
exposure is through consumption of fin- and shell-
fish containing bioaccumulated methylmercury.
107
Methylmercury exposure, both dietary and in utero
through maternal consumption, is associated with
neurological effects in infants and children, in-
cluding delayed achievement of developmental
milestones and p oor results on neurobehavioral
tests—attention, fine motor function, language,
visual-spatial abilities, and memory. Seafood con-
sumption has caused 7% of women of childbear-
ing age to exceed the mercury reference dose set
by the EPA, and 45 states have issued fish consump-
tion advisories.
107
Emission controls specific to mer-
cury are not available, though 74–95% of emitted
mercury is captured by existing emissions control
equipment. More advanced technologies are being
developed and tested.
107
Direct costs of mercury emissions from coal-fired
power plants causing mental retardation and lost
productivity in the form of IQ detriments were es-
timated by Trasande et al.
22,23
to be $361.2 mil-
lion and $1.625 billion, respectively, or 0.02¢/kWh
and 0.1¢/kWh, respectively. Low-end estimates for
these values are $43.7 million and $125 million, or
0.003¢/kWh and 0.007¢/kWh; high-end estimates
for these values are $3.3 billion and $8.1 billion, or
0.19¢/kWh and 0.48¢/kWh.
There are also epidemiological studies suggest-
ing anassociation between methylmercuryexposure
and cardiovascular disease.
108
Rice et al.
109
mone-
tized the benefits of a 10% reduction in mercury
emissions for both neurological development and
cardiovascular health, accounting for uncertainty
that the relationship between cardiovascular disease
and methylmercury exposure is indeed causal. Ap-
plying these results for the cardiovascular benefits
of a reduction in methylmercury to the 41% of to-
tal U.S. mercury emissions from coal
22,23
indicates
costs of $3.5 billion, with low and high estimates
of $0.2 billion and $17.9 billion, or 0.2 ¢/kWh,
with low and high estimates of 0.014 ¢/kWh and
1.05 ¢/kWh.
Coal’s contributions to climate change
The Intergovernmental Panel on Climate Change
(IPCC) reported that annual global GHG emissions
have—between 1970 and 2004—increased 70% to
49.0 Gt CO
2
-e/year.
109
The International Energy
Agency’s Reference Scenario estimates that world-
wide CO
2
emissions will increase by 57% between
2005 and 2030, or 1.8% each year, to 41,905 Mt.
1
In the same time period, CO
2
emissions from coal-
generated power are projected to increase 76.6% to
13,884 Mt.
1
In 2005, coal was responsible for 82% of the U.S.’s
GHG emissions from power generation.
110
In ad-
dition to direct stack emissions, there are methane
Ann. N.Y. Acad. Sci. 1219 (2011) 73–98
c
2011 New York Academy of Sciences. 87
Full cost accounting for the life cycle of coal Epstein et al.
emissions from coal mines, on the order of 3% of the
stack emissions.
110
There a re also additional GHG
emissions from the other uses of coal, approximately
139 Mt CO
2
.
1
Particulate matter (black carbon or soot) is also
a heat-trapping agent, absorbing solar radiation,
and, even at great distances, decreasing reflectiv-
ity (albedo) by settling in snow and ice.
111–113
The
contribution of particulates (from coal, diesel, and
biomass burning) to climate change has, until re-
cently, been underestimated. Though short-lived,
the global warming potential per volume is 500
times that of CO
2
.
111
Climate change
Since the 1950s, the world ocean has accumulated 22
times as much heat as has theatmosphere,
114
and the
pattern of warming is unmistakably attributable to
the increase in GHGs.
115
Via this o cean repository
and melting ice, global warming is changing the
climate: causing warming, altered weather patterns,
and sea level rise. Climate may change gradually
or nonlinearly (in quantum jumps). The release of
methane from Arctic seas and the changes in Earth’s
ice cover (thus albedo), are two potential amplifying
feedbacks that could accelerate the rate of Earth’s
warming.
Just as we have underestimated the rate at which
theclimatewouldchange,wehaveunderestimated
the pace of health and environmental impacts. Al-
ready the increases in asthma, heat waves, clusters of
illnesses after heavy rain events and intense storms,
and in the distr ibution of infectious diseases are
apparent.
116,117
Moreover, the unfolding impacts of
climate instability hold yet even more profound
impacts for public health, as the changes threaten
the natural life-supporting systems upon which we
depend.
The EIA
2
estimated that 1.97 billion tons of CO
2
and 9.3 million tons CO
2
eofN
2
O were emitted di-
rectly from coal-fired power plants. Using the social
cost of carbon, this resulted in a total cost of $61.7
billion, or 3.06 ¢/kWh. Using the low and high es-
timates of the social cost of carbon results in cost
of $20.56 billion to $205.6 billion, or 1.02 ¢/kWh to
10.2 ¢/kWh.
Black carbon emissions were also calculated us-
ing data from the EPA’s eGRID database
81
on elec-
tricity produced from lignite. The low, mean, and
high energy density values for lignite
5
was then used
to calculate the amount of lig nite consumed. The
Cooke et al.
118
emissions factor was used to estimate
black carbon emissions based on lignite use and the
Hansen et al.
111
global temperature potential was
used to convert these emissions to CO
2
e. This re-
sulted in an estimate of 1.5 million tons CO
2
e being
emitted in 2008, with a value of $45.2 million, or
0.002¢/kWh. Using our low and high estimates for
the social cost of carbon and the high and low values
for the energy density of lignite produced values of
$12.3 million to $161.4 million, or 0.0006 ¢/kWh to
0.008¢/kWh.
One measure of the costs of climate change is
the rising costs of extreme weather events, though
these are also a function of and real estate and in-
surance values. Overall, the costs of weather-related
disasters rose 10-fold from the 1980s to the 1990s
(from an average of $4 bn/year to $40 bn/year) and
jumped again in the past decade, reaching $225
bn in 2005.
119
Worldwide, Munich Re—a company
that insures insurers—reports that, in 2008, with-
out Katrina-level disasters, weather-related “catas-
trophic losses” to the global economy were thethird-
highest in recorded history, topping $200 billion,
including $45 billion in the United States.
120
The total costs of climate change damages from
coal-derived power, including black carbon, CO
2
and N
2
O emissions from combustion, land distur-
bance in MTR, and methane leakage from mines, is
$63.9 billion dollars, or 3.15 ¢/kWh, with low and
high estimates of $21.3 billion to $215.9 billion, or
1.06 ¢/kWh to 10.71 ¢/kWh. A broad examination
of the costs of climate change
121
projects global eco-
nomic losses to between 5 and 20% of global gross
domestic product ($1.75–$7 tr illion in 2005 US$);
the higher figure based on the potential collapse of
ecosystems,suchascoralreefsandwidespreadfor-
est and crop losses. With coal contr ibuting at least
one-third of the heat-trapping chemicals, these pro-
jections offer a sobering perspective on the evolving
costs of coal; costs that can be projected to rise (lin-
early or nonlinearly) over time.
Carbon capture and storage
Burning coal with CO
2
CCS in terrestrial, ocean,
and deep ocean sediments are proposed methods
of deriving “clean coal.” But—in addition to the
control technique not altering the upstream life cy-
cle costs—significant obstacles lie in the way, in-
cluding the costs of construction of suitable plants
88 Ann. N.Y. Acad. Sci. 1219 (2011) 73–98
c
2011 New York Academy of Sciences.
Epstein et al. Full cost accounting for the life cycle of coal
Table 2. MIT cost estimates for some representative CCS systems.
5
Subcritical PC Supercritical PC Ultra-supercritical PC SC PC-Oxy IGCC
No capture Capture No capture Capture No capture Capture Capture No capture Capture
CCS perfor-
mance
Coal feed (kg/hr) 208,000 284,000 184,894 242,950 164,000 209,000 232,628 185,376 228,115
CO
2
emitted (kg/hr) 466,000 63,600 414,903 54,518 369,000 46,800 52,202 415,983 51,198
CO
2
captured at 90%,
(kg/h)
0 573.000 0 490662 0 422000 469817 0 460782
CO
2
emitted (g/kWh) 931 127 830 109 738 94 104 832 102
CCS costs $/kWh 1,280 2,230 1,330 2,140 1,360 2,090 1,900 1,430 1,890
Total $, assuming 500
MW plant
$640,000,
000
$1,115,000,
000
$665,000,
000
$1,070,000,
000
$680,000,
000
$1,045,000,
000
$950,000,
000
$715,000,
000
$945,000,
000
Inv. Charce ¢/kWh @
15.1%
2.6 4.52 2.7 4.34 2.76 4.24 3.85 2.9 3.83
Fuel ¢/kWh @
$1.50/MMBtu
1.49 2.04 1.33 1.75 1.18 1.5 1.67 1.33 1.64
O&M ¢/kWh 0.75 1.6 0.75 1.6 0.75 1.6 1.45 0.9 1.05
COE ¢/kWh 4.84 8.16 4.78 7.69 4.69 7.34 8.98 5.13 6.52
Cost of CO
2
avoided vs.
same technology w/o
capture ($/ton)
41.3 40.4 41.1 30.3 19.3
Cost of CO
2
avoided vs.
supercritical
technology w/o
capture ($/ton)
48.2 40.4 34.8 30.3 24
Energy penalty 1,365,
384,615
1,313,
996,128
1,274,
390,244
1,230,
553,038
and underground storage facilities, and the “energy
penalty” requiring that coal consumption per unit
of energy produced by the power plant increase by
25–40% depending on the technologies used.
4,42
Retrofitting old plants—the largest source of CO
2
in the United States—may exact an even larger en-
ergy penalty. The energy penalty means that more
coal is needed to produce the same quantity of elec-
tricity, necessitating more mining, processing, and
transporting of coal and resulting in a larger waste
stream to produce the same amount of electricity.
Coal-fired plants would still require locally pollut-
ing diesel trucks to deliver the coal, and generate
CCW ponds that can contaminate ground water.
Given current siting patterns, such impacts often
fall disproportionately on economically disadvan-
taged communities. The energy penalty combined
with other increased costs of operating a CCS plant
would nearly double the cost of generating electric-
ity from that plant, depending on the technology
used (see Table 2).
5
The U.S. Department of Energy estimates that an
underground volume of 30,000 km
2
will be needed
per year to reduce the CO
2
emissions from coal by
20% by 2050 (the total land mass of the continental
U.S. (48 states) is 9,158,960 km
2
).
122
The safety and ensurability of scaling up the stor-
age of the billion tons of CO
2
generated each year
into the foreseeable future are unknown. Extrapolat-
ing from localized experiments, injecting fractions
of the volumes that will have to be stored to make
a significant difference in emissions, is fraught with
numerous assumptions. Bringing CCS to scale raises
additional risks, in terms of pressures underground.
In addition to this, according to the U.S. Govern-
ment Accountability Office (2008) there are regu-
latory, legal and liability uncertainties, and there is
“significant cost of retrofitting existing plants that
are single largest source of CO
2
emissions in the
United States” (p. 7).
123
Health and environmental risks of CCS
The Special IPCC Report on Carbon Dioxide Cap-
ture and Storage
42
lists the following concerns for
CCS in underground terrestrial sites:
1. Storing compressed and liquefied CO
2
under-
ground can acidify saline aquifers (akin to
ocean acidification) and leach heavy metals,
such as arsenic and lead, into ground water.
42
2. Acidification of ground water increases fluid-
rock interac tions that enhance calcite dissolu-
tion and solubility, and can lead to fractures in
Ann. N.Y. Acad. Sci. 1219 (2011) 73–98
c
2011 New York Academy of Sciences. 89
Full cost accounting for the life cycle of coal Epstein et al.
limestone (CaCO
3
) and subsequent releases of
CO
2
in high concentrations.
124
3. Increased pressures may cause leaks and re-
leases from previously drilled (often un-
mapped) pathways.
4. Increased pressures could destabilize under-
ground faults and lead to earthquakes.
5. Large leaks and releases of concentrated CO
2
are toxic to plants and animals.
42
a. The 2006 Mammoth Mountain, CA release
left dead stands of trees.
124
6. Microbial communities may be altered, with
release of other gases.
42
The figures in Table 2 represent costs for new
construction. Costs for retrofits (wh ere CCS is in-
stalled on an active plant) and rebuilds (where CCS
is installed on an active plant and the combustion
technology is upgraded) are highly uncertain be-
cause they a re extremely dependent on site condi-
tions and precisely what technolog y the coal plant is
upgraded to.
5
It does appear that complete rebuilds
are more economically attractive than retrofits, and
that “carbon-capture ready” plants are not econom-
ically desirable to build.
5
Subsidies
In Kentucky, coal brings in an estimated $528 mil-
lion in state revenues, but is responsible for $643
million in state expenditures. The net impact, there-
fore, is a loss of $115 million to the state of Ken-
tucky.
126
These figures do not include costs of health
care, lost productivity, water treatment for siltation
and water infrastructure, limited development po-
tential due to poor air quality, and social expendi-
tures associated with declines in employment and
related economic hardships of coal-field communi-
ties.
126
The U.S. Federal Government provides subsides
for electricity and mining activities, and these have
been tallied by both the EIA and the Environmen-
tal Law Institute.
2,127,128
The EIA estimate is $3.17
billion of subsidies in 2007, or 0.16¢/kWh, and the
Environmental Law Institute estimate is $5.37 bil-
lion for 2007, or 0.27¢/kWh.
Abandoned mine lands
Abandoned mine lands (AML) are those lands and
waters negatively impacted by surface coal mining
and left inadequately reclaimed or abandoned prior
to August 3, 1977.
129
There are over 1,700 old aban-
Figure 4. Current high-priority abandoned mine land recla-
mation sites from Alabama to Pennsylvania.
129
(In color in An-
nals online.) Source: Hope Childers, Wheeling Jesuit University.
doned mines in Pennsylvania, alone.
14
In some—
like that in Centralia, PA—fires burn for decades,
emitting carbon monoxide, and other fumes. The
ground above others can open, and se veral people
die each year falling into them. Still others flood
andleadtocontaminatedgroundwater.Previous
coal mining communities lie in the shadow of these
disturbed areas. Officials in Pennsylvania estimate
that it will take $15 billion over six decades to clean
Pennsylvania’s abandoned mines.
Since the passage of the Surface Mining Control
and Reclamation Act of 1977, active mining opera-
tions have been required to pay fees into the Aban-
doned Mine Reclamation Fund that are then used
to finance reclamation of these AMLs.
129
Despite
the more than $7.4 billion that has been collected as
of September 30, 2005, there is a growing backlog
of unfunded projects.
51
Data on the number and
monetary value of unfunded AML projects remain-
ing at the end of 2007 for the nation were collected
directly from the Abandoned Mine Land Inventory
System
129
and amounted to $8.8 billion 2008 US$,
or 0.44¢/kWh (Fig . 4).
Results
The tabulation of the externalities in total and con-
verted to 2008 US$ is given in Table 3 and normal-
ized to cents per kWh of coal-generated electr icity
90 Ann. N.Y. Acad. Sci. 1219 (2011) 73–98
c
2011 New York Academy of Sciences.
Epstein et al. Full cost accounting for the life cycle of coal
Table 3. The complete costs of coal as reviewed in this report in 2008 US$.
Monetized life cycle assessment results
(2008 US$)
Monetized estimates from literature (2008 US$)
IPCC 2007, U.S. U.S. Hard Coal
Low Best High Hard Coal Eco-indicator
Land disturbance $54,311,510 $162,934,529 $3,349,209,766
Methane emissions from
mines
$684,084,928 $2,052,254,783 $6,840,849,276 $2,188,192, 405
Carcinogens (mostly to
water from waste)
$11,775,544, 263
Public health burden of
communities in
Appalachia
$74,612,823,575 $74,612,823,575 $74,612,823,575
Fatalities in the public
due to coal transport
$1,807,500,000 $1,807,500,000 $1,807,500,000
Emissions of air
pollutants from
combustion
$65,094,911,734 $187,473,345,794 $187,473,345,794 $71,011,655, 364
Lost productivity from
mercury emissions
$125,000,000 $1,625,000,000 $8,125,000,000
Excess mental retardation
cases from mercury
emissions
$43,750,000 $361,250,000 $3,250,000,000
Excess cardiovascular
disease from mercury
emissions
$246,000,000 $3,536,250,000 $17,937,500,000
Climate damages from
combustion emissions
of CO
2
and N
2
O
$20,559,709,242 $61,679,127,726 $205,597,092,419.52 $70,442,466, 509
Climate damages from
combustion emissions
of black carbon
$12,346,127 $45,186,823 $161,381,512.28 $3,739,876, 478
Environmental Law
Institute estimate 2007
$5,373, 963,368
EIA 2007 $3,177,964,157 $3,177, 964,157
AMLs $8,775,282,692 $8,775, 282,692 $8,775, 282,692
Climate total $21,310,451,806 $63,939,503,861 $215,948,532,974
Total $175,193,683,964 $345,308,920,080 $523,303,948,403
A 2010 Clean Air Task Force
56
(CATF) report, with Abt Associates consulting, lists 13,000 premature deaths due to
air pollution from all electricity generation in 2010, a decrease in their estimates from previous years. They attribute
the drop to 105 scrubbers installed since 2005, the year in which we based our calculations. We were pleased to see
improvements reported in air quality and health outcomes. There is, however, considerable uncertainty regarding the
actual numbers. Using the epidemiology from the “Six Cities Study” implies up to 34,000 premature deaths in 2010.
Thus, our figures are mid-range while those of the CATF represent the most conservative of estimates.
in Table 4. Our best estimate for the externalities
related to coal is $345.3 billion (range: $175.2 bn to
$523.3 bn). On a per-kWh basis this is 17.84¢/kWh,
ranging from 9.42 ¢/kWh to 26.89 ¢/kWh.
Limitations of this analysis
While we have based this analysis on the best avail-
able data that are used by a wide range of organi-
zations, this review is limited by the omission of
many environmental, community, mental health,
and economic impacts that are not easily quantifi-
able. Another limitation is the placing of numbers
on impacts that are difficult to quantify or mon-
etize, including the VSL, a crude estimate of the
benefits of reducing the number of deaths used by
economists, and the social cost of carbon, based on
the evolving impacts of climate change. We have in-
cluded ranges, reflecting the numerous sets of data
and studies in this field (all of which have their own
Ann. N.Y. Acad. Sci. 1219 (2011) 73–98
c
2011 New York Academy of Sciences. 91
Full cost accounting for the life cycle of coal Epstein et al.
Table 4. Total costs of coal normalized to kWh of electricity produced.
Monetized estimates from Monetized life cycle assessment results
literature in ¢/kWh of in ¢/kWh of electricity (2008 US$)
electricity (2008 US$)
IPCC 2007, U.S. U.S. Hard Coal
Low Best High Hard Coal Eco-indicator
Land disturbance 0.00 0.01 0.17
Methane emissions from
mines
0.03 0.08 0.34 0.11
Carcinogens (mostly to
water from waste)
0.60
Public health burden of
communities in
Appalachia
4.36 4.36 4.36
Fatalities in the public due
to coal transport
0.09 0.09 0.09
Emissions of air pollutants
from combustion
3.23 9.31 9.31 3.59
Lost productivity from
mercury emissions
0.01 0.10 0.48
Excess mental retardation
cases from mercury
emissions
0.00 0.02 0.19
Excess cardiovascular
disease from mercury
emissions
0.01 0.21 1.05
Climate damage from
combustion emissions
of CO
2
and N
2
O
1.02 3.06 10.20 3.56
Climate damages from
combustion emissions
of black carbon
0.00 0.00 0.01 0.19
Environmental Law
Institute estimate 2007
0.27
EIA 2007 0.16 0.16
AMLs 0.44 0.44 0.44
Climate total 1.06 3.15 10.7 3.75 1.54
Total 9.36 17.84 26.89
uncertainties), varying assumptions in data sets and
studies, and uncertainties about future impacts and
the costs to society.
Some of the issues raised apply only to the re-
gion discussed. Decreased tourism in Appalachia,
for example, affects regional economies; but may
not affect the overall economy of the United States,
as tourists may choose other destinations.
Studies in Australian coal mining communi-
ties illustrate the cycle of economic boom dur-
ing construction and opera tion, the economic and
worker decoupling from the fortunes of the mines;
then the eventual closing.
130
Such communities
experience high levels of depression and poverty,
and increases in assaults (particularly sexual as-
saults), motor vehicle accidents, and crimes against
92 Ann. N.Y. Acad. Sci. 1219 (2011) 73–98
c
2011 New York Academy of Sciences.
Epstein et al. Full cost accounting for the life cycle of coal
property, until the culture shifts to allow
for development of secondary industries. Addi-
tional evidence documents that mining-dependent
economies tend to be weak economies,
131
and weak
economic conditions in turn are powerful predic-
tors of social and health disadvantages.
130,132
Some values are also difficult to interpret, given
the multiple baselines against which the y must be
compared. In assessing the “marginal” costs of en-
vironmental damages, we have assumed the diverse,
pristine, hardwood forest that still constitutes the
majority of the beautiful rich and rolling hills that
make up the Appalachian Mountain range.
Ecological and health economic analyses are also
affected by the discount rate used in such evalua-
tions. Discount rates are of great value in assess-
ing the worth of commodities that deteriorate over
time. But they are of questionable value in assessing
ecological, life-supporting systems that have value
if they are sustained. Ecological economists might
consider employing a negative discount rate—or
an accrual rate—in assessing the true impacts
of environmental degradation and the value of
sustainability.
Finally, the costs reported here do not include a
wide range of opportunity costs, including lost op-
portunities to construct wind farms and solar power
plants, begin manufacture of wind turbines and so-
lar technologies, develop technologies for the smart
grid and transmission, and for economic and busi-
ness development unrelated to the energy sector.
Conclusions
Theelectricityderivedfromcoalisanintegralpartof
our daily lives. However,coal carries a heavy burden.
The yearly and cumulative costs stemming from the
aerosolized, solid, and water pollutants associated
with the mining, processing, transport, and com-
bustion of coal affect individuals, families, commu-
nities, ecological integ rity, and the global climate.
The economic implications go far beyond the prices
we pay for electricity.
Our comprehensive review finds that the best es-
timate for the total economically quantifiable costs,
based on a conservative weighting of many of the
study findings, amount to some $345.3 billion,
adding close to 17.8¢/kWh of electricit y generated
from coal. The low estimate is $175 billion, or over
9¢/kWh, while the true monetizable costs could be
as much as the upper bounds of $523.3 billion,
adding close to 26.89¢/kWh. These and the more
difficult to quantify externalities are borne by the
general public.
Still these figures do not represent the full societal
and environmental burden of coal. In quantifying
the damages, we have omitted the impacts of toxic
chemicals and heavy metals on ecological systems
and diverse plants and animals; some ill-health end-
points (morbidity) aside from mortality related to
air pollutants released through coal combustion that
are still not captured; the direct risks and hazards
posed by sludge, slurry, and CCW impoundments;
the full contributions of nitrogen deposition to eu-
trophication of fresh and coastal sea water; the pro-
longed impacts of acid rain and acid mine dr ainage;
many of the long-term impacts on the physical and
mental health of those living in coal-field regions
and nearby MTR sites; some of the health impacts
and climate forcing due to increased tropospheric
ozone formation; and the full assessment of impacts
due to an increasingly unstable climate.
The true ecological and health costs of coal are
thus far greater than the numbers suggest. Account-
ing for the many external costs over the life cycle
for coal-derived electricity conservatively doubles
to triples the price of coal per kWh of electricity
generated.
Our analysis also suggests that the proposed mea-
sure to address one of the emissions—CO
2
,via
CCS—is costly and carries numerous health and
environmental risks, which would be multiplied if
CCS were deployed on a wide scale. The combina-
tion of new technologies and the “energy penalty”
will, conservatively, almost double the costs to op-
erate the utility plants. In addition, questions about
the reserves of economically recoverable coal in the
United States carry implications for future invest-
ments into coal-related infrastructure.
Public policies, including the Clean Air Act and
New Source Performance Review, are in place to help
control these externalities; however, the actual im-
pacts and damages remain substantial. These costs
must be accounted for in formulating public poli-
cies and for guiding private sector practices, includ-
ing project financing and insurance underwriting of
coal-fired plants with and without CCS.
Recommendations
1. Comprehensive comparative analyses of life
cycle costs of all electricity generation
Ann. N.Y. Acad. Sci. 1219 (2011) 73–98
c
2011 New York Academy of Sciences. 93
Full cost accounting for the life cycle of coal Epstein et al.
technologies and pra ctices are needed to guide
the development of future energy policies.
2. Begin phasing out coal and phasing in cleanly
powered smart grids, using place-appropriate
alternative energy sources.
3. A healthy energy future can include electric
vehicles, plugged into cleanly powered smart
grids; and healthy cities initiatives, includ-
ing green buildings, roof-top gardens, public
transport, and smart growth.
4. Alternative industrial and farming policies are
needed for coal-field regions, to suppor t the
manufacture and installation of solar, wind,
small-scale hydro, and smart grid technolo-
gies. Rural electric co-ops can help in meeting
consumer demands.
5. We must end MTR mining, reclaim all MTR
sites and abandoned mine lands, and ensure
that local water sources are safe for consump-
tion.
6. Funds are needed for clean enterprises, recla-
mation, and water treatment.
7. Fund-generating methods include:
a. maintaining revenues from the workers’
compensation coal tax;
b. increasing coal severance tax rates;
c. increasing fees on coal haul trucks and
trains;
d. reforming the structure of credits and taxes
to remove misaligned incentives;
e. reforming federal and state subsidies to in-
centivize clean technology infrast ructure.
8. To transform our energy infrastructure, we
must realign federal and state rules, regula-
tions, and rewards to stimulate manufacturing
of and mar kets for clean and efficient energy
systems. Such a transformation would be ben-
eficial for our health, for the environment, for
sustained economic health, and would con-
tribute to stabilizing the global climate.
Acknowledgments
The authors would like to acknowledge Amy Larkin
of Greenpeace, who commissioned Kevin Eckerle,
then an independent consultant, to perform work
similar to this that is currently unpublished, and
subsequently gave permission to make use of their
work for this report. We would also like to thank
James Hansen, Mark Jacobson, Jonathan Levy, John
Evans, and Joel Schwartz for their helpful comments
throughout the course of this work. The genesis for
this paper was a Conference—“The True Costs of
Coal: Building a Healthy Energy Future”—held Oc-
tober 15–16, 2009 in Washington, DC, supported by
the Energy Foundation and the Rockefeller Family
Fund.
Conflicts of interest
The authors declare no conflicts of interest.
References
1. International Energy Agency. 2007. Wor ld Energy Out-
look 2007: China and India Insights. International Energy
Agency. Paris, France.
2. Energy Information Administration. 2010. U.S. Energy
Information Administration. www.eia.doe.gov (accessed
December 9, 2010).
3. Energy Information Administration. 2009. Annual Energy
Outlook 2009, with Projections to 2030. 227 pp. U.S. De-
partment of Energy. Washington, DC.
4. House, K.Z., C.F. Harvey, M.J.Aziz& D.P. Schrag. 2009.The
energy penalty of post-combustion CO2 capture & storage
and its implications for retrofitting the U.S. installed base.
Energy & Environmental Science 2: 193.
5. Katzer, J., E.J. Moniz, J. Deutch, et al. 2007. The fu-
ture of coal: an interdisciplinary MIT study. Technical re-
port, Massachusetts Institute of Technology, Cambridge,
MA.
6. Energy Information Administration. 2010. Energy Infor-
mation’s Outlook Through 2035. From the Annual Energy
Outlook 2010, Diane Kearney, Energy Information Admin-
istration, U.S. Department of Energy, Surface Transporta-
tion Board, March 23, 2010, Washington, DC.
7. Energy Information Administration. 2008. Annual
Coal Report. />acr
sum.html (accessed December 9, 2010).
8. Glustrom, L. 2009. Coal: Cheap and Abundant Or Is It?
/>Supply Constraints CEA 021209.pdf (accessed December
9, 2010).
9. Heinberg, R. 2009. Blackout: Coal, Climate and the
Last Energy Crisis. Clairview Books. East Sussex, UK.
208pp.
10. Luppens, J. A. et al . 2008. Assessment of Coal Geology, Re-
sources, and Reserves in the Gillette Coalfield, Powder River
Basin, Wyoming: U.S. Geological Survey Open-File Report
2008–1202.
11. Ruppert, L.F, M.A. Kirschbaum, P.D. Warwick, et al. 2002.
The US Geological Survey’s national coal resource assess-
ment: the results. Internat. J. Coal Geo. 50: 247–274.
12. Patzek, T.W. & G.D. Croft. 2010. A global coal produc-
tion forecast with multi-Hubbert cycle analysis. Energy 35:
3109–3122.
13. Krauss, C. 2008. An export in solid supply. New York Times.
14. Goodell, J. 2006. Big Coal: The Dirty Secret Behind America’s
Energy Future . Houghton Mifflin. NY.
94 Ann. N.Y. Acad. Sci. 1219 (2011) 73–98
c
2011 New York Academy of Sciences.
Epstein et al. Full cost accounting for the life cycle of coal
15. Ghose, M. 2007. Gener ation and quantification of haz-
ardous dusts from coal mining in the Indian context. Env-
iron. Monit. Assess. 130: 35–45.
16. Palmer, M.A., E.S. Bernhardt, W.H. Schelsinger, et al.
2010. Science and regulation. Mountaintop mining con-
sequences. Science 327: 148–149.
17. Hendryx, M. 2009. Mortality from heart, respiratory, and
kidney disease in coal mining areas of Appalachia. Int.
Arch. Occup. Environ. Health 82: 243–249.
18. Hendryx, M. & M. Ahern. 2008. Relations between health
indicators and residential proximity to coal mining in West
Virginia. Am. J. of Public Health 98: 669–671.
19. Hendryx, M. & M. Ahern. 2009. Mortality in Appalachian
coal mining regions: the value of statistical life lost. Public
Health Rep. 124: 541–550.
20. National Research Council. 2009. The Hidden Costs of En-
erg y: Unpriced Consequences of Energy Production.Wash-
ington, DC.
21. Levy, J., L. Baxter & J. Schwartz. 2009. Uncertainty and
variability in health-related damages from coal-fired power
plants in the United States. Risk A nalysis 29: 1000–
1014.
22. Trasande, L., P. Landrigan & C. Schechter. 2005. Public
health and economic consequences of m ethyl mercury tox-
icity to the developing brain. Environ. Health Perspect. 113:
590–596.
23. Trasande, L., C. Schechter, K. Haynes & P. Landrigan. 2006.
Mental retardation and prenatal methylmercury toxicity.
Am.J.Ind.Med.49: 153–158.
24. Epstein, P.R & J. Selber. 2002. Oil: A Life Cycle Analy-
sis of its Health and Environmental Impacts.TheCenter
for Health and the Global Environment. Harvard Medical
School. Boston, MA.
25. Pr
´
e Consultants. 2008. SimaPro 7.1. />(accessed December 9, 2010).
26. Bickel, P. & R. Friedrich. Eds. 2004. ExternE: Externalities of
Energy. Methodology 2005 Update. European Commission.
Luxembourg.
27. Mine Safety and Health Administration. 2008.
(accessed December 9, 2010).
28. Yardley, J. 2008. As most of China celebrates New Years,
a scramble continues in coal country. New York Times,
February 9.
29. Jacobs, A. 2010. Rescuers in China struggle to free 153
trapped miners. NewYorkTimes, March 29.
30. National Institute for Occupational Safety and Health.
2008. What’s New in the CWHSP. NIOSH Coal
Worker’s Health Surveillance Program. .
gov/niosh/topics/surveillance/ords/pdfs/CWHSP-News-
Fall2008.pdf (accessed December 9, 2010).
31. Lloyd, J. W. 1971. Long-term mortality study of steelwork-
ers V. Respiratory Cancer in coke plant workers. J. Occ.
Med. 12: 151–157.
32. Zeller, T.A. 2010. A battle in mining country pits coal
against wind. NewYorkTimes, August 14.
33. U.S. Environmental Protection Agency. 2010. EPA
Makes Announcement on Two Proposed West
Virginia Mountaintop Coal Mines. News Release.
http:// yosemite.epa.gov/opa/admpress.nsf/bd4379a92
ceceeac8525735900400c27/84636183a97ced24852576a200
69961a!OpenDocument (accessed December 9,
2010).
34. Kentucky Division of Water. 2008. Integrated Re-
port to Congress on Water Quality in Kentucky.
(accessed
December 9, 2010).
35. Office of Surface Mining. 2008.
Final Environmental Impact
Statement: Excess Spoil Minimization, Stream Buffer Zones.
Washington, DC. />(accessed December 17, 2010).
36. U.S. Environmental Protection Agency. 2002. Affected
Environment and Consequences of Mountain-top Re-
moval and Valley Fill Practices. Environmental Impact
Statement. Washington, DC />mtntop/pdf/III
affected-envt-consequences.pdf (accessed
December 17, 2010).
37. Epstein, P.R., W.Moomaw & C. Walker. 2008. Healthy solu-
tions for the low carbon economy: guidelines for inv estors,
insurers, and policy makers. The Center for Health and
the Global Environment. Harvard Medical School. Boston,
MA.
38. Fox, J.F. & J.E. Campbell. 2010. Terrestrial carbon dis-
turbance from mountaintop mining increases lifecycle
emissions for clean coal. Environ. Sci. Technol. 44: 2144–
2149.
39. Groisman, P.Y., R.W.Knight, T.R.Karl, et al. 2004. Contem-
porary changes of the hydrological cycle over the contigu-
ous United States: trends derived from in situ observations.
Journal of Hydrometeorology 5: 64–85.
40. Groisman, P.Y. & R.W. Knight. 2008. Prolonged dry
episodes over the conterminous United States: new ten-
dencies emerging during the last 40 years. BAMS 21: 1850–
1862.
41. Reinhart, N. 2010. Personal communication.
42. Intergovernmental Panel on Climate Change, United Na-
tions Environment Programme. Technology and Eco-
nomics Assessment Panel. 2005. IPCC specialreport on car-
bon dioxide capture and storage: summary for policymak-
ers. 25 pp. Geneva, Switzerland. />special-reports/srccs/srccs˙wholereport.pdf (accessed De-
cember 17, 2010).
43. Forster, P., V. Ramaswamy, P. Artaxo, et al. 2007. Changes
in Atmospheric Constituents and in Radiative Forcing. Cli-
mate Change 2007: The Physical Science Basis. Contribution
of Working Group I to the Fourth Assessment Report of the
Intergovernmental Panel on Climate Change 1–106.
44. West Virginia Department of Environmental Protection.
2010. (accessed
December 9, 2010).
45. U.S. Environmental Protection Agency. 2010.
EPA Facilities Registry. />html/fii/fii
query java.html (accessed December 9, 2010).
46. Dewan, S. 2009. Hundreds of coal ash dumps lack regula-
tion. NewYorkTimes, January 6.
47. Environmental Integrity Project. 2009. Coming Clean:
What the EPA Knows About the Dangers of Coal
Ash. A Summar y of the United States Environmental
Protection Agency’s 2007 Human and Ecological Risk
Ann. N.Y. Acad. Sci. 1219 (2011) 73–98
c
2011 New York Academy of Sciences. 95
Full cost accounting for the life cycle of coal Epstein et al.
Assessment of Coal Combustion Wastes. http://www.
environmentalintegrity.org/news
reports/news 09 05 07.
php (accessed December 9, 2010).
48. Stout, B.M. & M.E. Cassidy. 2009. Personal communica-
tion.
49. Wheeling Jesuit University. 2006. Kentucky Coal Im-
poundment Location and Information System. http://
www.coalimpoundment.org/locate/list.asp (accessed De-
cember 9, 2010).
50. Spath, P., M. Mann & D. Kerr. 1999. Life cycle a ssess-
ment of coal-fired power production. Dept. of Energy, Oak
Ridge, TN. />(accessed December 9, 2010).
51. Stout, B.M. & M.E. Cassidy. 2006. Environmental and
social-economic impacts of electrical generation from the
fossil fuel cycle in the Mid-Atlantic Highlands (unpub-
lished). 1–25.
52. U.S. Department of Energy, U.S. Depar tment of Health
and Human Services, U.S. Environmental Protection
Agency. 1980. Health effects of coal technologies: research
needs. Washington, D C. />viewrecord.php?requester=gs&collection=TRD&recid=20
070430115163CE&q=Health+effects+of+coal+technolo-
gies%3A+research+needs.&uid=790182396&setcookie=yes
(accessed December 17, 2010).
53. U.S. Department of Energy. 1986. Effects of Coal Rank and
the Chemical Composition and Toxicological Activ ity of Coal
Liquefaction Materials. Washington, DC.
54. U.S. Environmental Protection Agency. 2009. Clean
Air Mercury Rule. />basic.htm (accessed December 9, 2010).
55. Kentucky Department of Fish and Wildlife Re-
sources. 2009. Fish Consumption Advisories. http://www.
fw.ky.gov/fishadvisory.asp (accessed December 9, 2010).
56. Clean Air Task Force. Power Plant Pollution Lo-
cator. 2010. />sector/
power
plant emissions/pollution locator/ (accessed De-
cember 9, 2010).
57. U.S. Environmental Protection Agency Clean Air Mar-
kets Division. 2004. Memorandum: Economic and energy
analysis of the proposed interstate air quality rulemak-
ing. (accessed
December 17, 2010).
58. Keating, M., L. Evans, B. Dunham & J. Stant. 2009.
Waste Deep: Filling Mines with Coal Ash is Profit for
Industry, But Poison for People. thjustice.
org/news/press/2009/new-report-documents-unseen-
threat-from-toxic-coal-ash (accessed December 9, 2010).
59. Koornneef, J., T. Van Keulen, A. Faaij & W. Turken-
burg. 2008. Life cycle assessment of a pulverized coal
power plant with post-combustion capture, transport and
storage of CO2. Int. J.Greenhouse Gas Control 2: 448–
467.
60. Hendr yx, M., K. O’Donnell & K. Horn. 2008. Lung cancer
mortality i s elevated in coal-mining areas of Appalachia.
Lung Cancer 62: 1–7.
61. Shiber, J. 2005. Arsenic in domestic well water and health
in central Appalachia, USA. Water, Air, Soil Pollut. 160:
327–341.
62. Hendryx, M. 2008. Mortality rates in Appalachian coal
mining counties: 24 years behind the nation. Environ. Jus-
tice 1: 5–11.
63. Ahern, M., M. Mullett, K. MacKay & C. Hamil-
ton. 2010. Residence in coal-mining areas and
low-birth-weight-outcomes. Maternal Child Health J.
Epub ahead of print. doi: 10.1007/s10995-009-0555-
1/ (ac-
cessed D ecember 9, 2010).
64. Ahern, M., K. MacKay, D. Carpenter & M. Hendryx.
Low birth weight and pre-term birth outcomes in coal
mining areas of the United States. J. Environ. Health
DOI: 10.1007/s10995-009-0555-1/ .
nih.gov/pubmed/20091110 (accessed December 17, 2010).
65. Tyson, J.E. & S. Saigal. 2005. Outcomes for extremely low-
birth-weight infants: disappointing news. JAMA 294: 371–
373.
66. Curhan, G. C. et al. 1996. Birth weight and adult hyperten-
sion, diabetes mellitus, and obesity in U.S. men. Circulation
94: 3426–3250.
67. Hendryx, M. & M. Ahern. 2010. Appalachian Coal Mining
& Human Health. Spring 2010 Symposium, Mountaintop
Coal Mining: Human Health and Ecological Concerns.Pre-
sentation available upon request.
68. Hendryx, M. 2010. Personal communication.
69. Morse, J.C., B.P. Stark & W.P. McCafferty. 1993. South-
ern Appalachian streams at risk: implications for mayflies,
stoneflies, caddisflies, and other aquatic biota. Aqua. Con-
ser v.: Marine Freshwater Ecosys. 3: 293–303.
70. Bragg, E.A. 1999. Civil Action No. 2:98–0636. United
States District Court Southern District of West Vir-
ginia Civil Action No. 2:98–0636. United States District
Court Southern District of West Virginia. http://
www.publicjustice.net/Repository/Files/Bragg%20district
%20court%20PI%20decision.pdf (accessed December 9,
2010).
71. Stout, B. & B. Wallace. 2005. A Survey of Eight Ma-
jor Aquatic Insect Orders Associated with Small Head-
water Streams Subject to Valley Fills from Mountain-
top Mining. 1–13. />pdf/appendices/d/StoutWallaceMacroinvertebrate.pdf (ac-
cessed D ecember 17, 2010).
72. Gilbert, N. 2010. Mountain mining damages streams. Na-
ture 466: 806.
73. Kirk, E.J., R.A. Johnston & R. Maggard. 2010. An
evaluation of the mayfly abundances and WV-SCI
scores compared to levels of conductivity in se veral
streams in southern West Virginia. 2010 West Vir-
ginia Surface Mine Drainage Task Force Symposium
Papers, Morgantown, WV, March 30-31. Confer-
ence: />Paper: />REIC-Argus-Mayfly-Conductivity-Paper.doc (accessed
December 17, 2010).
74. Pond, G.J. 2010. Patterns of Ephemeroptera taxa
loss in Appalachian headwater streams (Kentucky,
USA). Hydrobiologica />content/b1w1153363782687/ (accessed December 17,
2010).
96 Ann. N.Y. Acad. Sci. 1219 (2011) 73–98
c
2011 New York Academy of Sciences.
Epstein et al. Full cost accounting for the life cycle of coal
75. Pond, G.J., M. E. Passmore, F.A. Borsuk, et al. 2008. Down-
stream effects of mountaintop coal mining: comparing bi-
ological conditions using family- and genus-level macroin-
vertabrate bioassessment tools. J. N. Am. Benthol. Soc. 27:
717–737.
76. Anon. 2007. Conservation: mines vs. mussels. Nat. Geo.
Magazine 212.
77. Merritt, R.W. & K.W. Cummins. 1996. An Introduction to
the Aquatic Insects of North America. Kendall/Hunt Pub-
lishing Company. Dubuque, IA.
78. Palmer, M.A., E.S. Bernhardt, E.A. Chornesky, et al . 2005.
Ecological science and sustainability for the 21st century.
Frontiers Ecol. Environ. 3: 4–11.
79. Hendr yx, M. & K.J. Zullig. 2009. Higher coronary heart
disease and heart attack morbidity in Appalachian coal
mining regions. Preven. M ed. 49: 355–359.
80. U.S. Census Bureau. 2000. Net migration for the popula-
tion 5 years and over for the United States, regions, states,
counties, New England minor civil divisions, metropolitan
areas, and Puerto Rico. Washington, DC.
81. U.S. Environmental Protection Agency. 2009. Emissions
& Generation Resource Integrated Database. http://
www.epa.gov/cleanenergy/energy-resources/egrid/index.
html (accessed December 9, 2010).
82. U.S. Environmental Protection Agency. 2009 Na-
tional Emissions Inventory. />neidb.html (accessed December 9, 2010).
83. Pope, C.A. & D.W. Dockery. 2006. Health effects of fine
particulate air pollution: lines that connect. J. Air & Waste
Manage. Assoc. 56: 709–742.
84. Levy, J. & J. Spengler. 2002. Modeling the benefits of power
plant emission controls in Massachusetts. J. Air & Waste
Manage. Assoc. 52: 5–18.
85. Schneider, C. & M. Padian. 2004. Dirt y Air, Dirty Power:
Mortality and Health Damage Due to Air Pollution from
Power Plants. Clean Air Task Force. Boston, MA.
86. Levy, J., J. Hammitt & J.Spengler. 2000. Estimating themor-
tality impacts of particulate matter: What can be lear ned
from between-study variability? Environ. Health Perspect.
108: 109–117.
87. O’Neill, M.S., A. Veves, A. Zanobetti, et al. 2005. Dia-
betes enhances vulnerability to particulate air pollution-
associated impairment in vascular reactivity and endothe-
lial function. Circulation 111: 2913–2920.
88. Ritz, B., M. Wilhelm & Y. Zhao. 2006. Air pollution and
infant death in southern California, 1989–2000. Pediatr ics
118: 493–502.
89. Levy, J.I., J.D. Spengler, D. Hlinka & D. Sullivan. 2000.
Estimated Public Health Impacts of Criteria Pollutant Air
Emissions from the Salem Harbor and Brayton Point Power
Plants. Harvard School of Public Health. Boston, MA.
90. Schwartz, J., B. Coull, F. Laden & L. Ryan. 2007. The effect
of dose and timing of dose on the association between
airborne particles and survival. Environ. Health Perspect.
116: 64–69.
91. Schwartz, J., 2010. Personal communication.
92. U.S. Environmental Protection Agency. 2009. Na-
tional Ambient Air Quality Standards. http://www.
epa.gov/air/criteria.html (accessed December 9, 2010).
93. Dockery, D.W. et al. 1993. An association between air pol-
lution and mortality in six U.S. cities. Engl. J. Med. 329:
1753–1759.
94. Roman, H., K.D. Walker, T.L. Walsh, et al. 2008. Expert
judgment assessment of the mor t ality impact of changes
in ambient fine particulate matter in the US. Environ. Sci.
Technol 42: 2268–2274.
95. Jaworski, N., R. Howarth & L. Hetling. 1997. Atmospheric
deposition of nitrogen oxides onto the landscape con-
tributes to coastal eutrophication in the northeast United
States. Environ. Sci. Tech. 31: 1995–2004.
96. Townsend,A.R.,W.Howarth,F.A.Bazzaz,
et al. 2003. Hu-
man health effectsof a changing global nitrogen cycle. Fron-
tiers Ecol. Environ. 1: 240–246.
97. Heisler, J. et al . 2008. Eutrophication and harmful algal
blooms: a scientific consensus. Harmful A lgae 8: 3–13.
98. Kirkpatrick, B., L.E. Fleming, D. Squicciarini, et al .
2004. Literature review of Florida red tide: implica-
tions for human health effects. Harmful Algae 3: 99–
115.
99. Shumway, S. 1990. A review of the effects of algal blooms
on shellfish and aquaculture. J. World Aquacul. Soc. 21:
65–104.
100. Wang, J. & J. Wu. 2009. Occurrence and potential risks
of harmful algal blooms in the East China Sea. Sci. Total
Environ. 407: 4012–4021.
101. National Centers for Ocean Coastal Science. 2009.
Economic Impacts of Harmful Algal Blooms. http://
www.cop.noaa.gov/stressors/extremeevents/hab/current/
econimpact
08.pdf (accessed December 9, 2010).
102. Hoagland, P. & S. Scatasta. 2006. The Economic Effects
of Harmful Algal Blooms. Springer-Verlag. Dordrecht, the
Netherlands.
103. Carlisle, E. 2009. The Gulf of Mexico Dead Zone
and Red Tides. />envirobio/enviroweb/DeadZone.htm (accessed December
9, 2010).
104. Driscoll, C.T., G.B. Lawrence, A.J. Bulger, et al . 2001. Acid
rain revisited: advances in scientific understandingsincethe
passage of the 1970 and 1990 Clean Air Act Amendments.
Hubbard Brook Research Foundation. Science Links’ Pub-
lication.Vol.1,no.1,Hanover,NH.
105. Yanai, R.D., T.G. Siccama, M.A. Arthur, et al . 1999. Accu-
mulation and depletion of base cations in forest floors in
the northeastern US. Ecology 80: 2774–2787.
106. Banzhaf, H., D. Burtraw, D. Evans & A. Krupnick.
2004. Valuation of natural resource improvements in
the Adirondacks. Resources for the Future, Washington,
DC. 40 pp />Adirondacks.pdf (accessed December 17, 2010).
107. Northeast States for Coordinated Air Use Management.
2003. Mercury emissions from coal-fired power plants:
the case for regulatory action. NESCAUM, Boston,
MA. www.nescaum.org/documents/rpt031104mercury.pdf/
(accessed December 9, 2010).
108. Rice, G.E., J.K. Hammitt & J.S. Evans. 2010. A probabilistic
characterization of the health benefits of reducing methyl
mercury intake in the United States. Environ. Sci. Tech. 44:
5216–5224.
Ann. N.Y. Acad. Sci. 1219 (2011) 73–98
c
2011 New York Academy of Sciences. 97