City clusters in China: air and surface water pollution ppt
Bạn đang xem bản rút gọn của tài liệu. Xem và tải ngay bản đầy đủ của tài liệu tại đây (6.55 MB, 34 trang )
C
hina has experienced unprecedented economic
growth over the past two decades, accompanied by
the development of large-scale industries and services. In
the course of this expansion, medium-sized cities and
small towns have sprung up around the larger cities, form-
ing city clusters, often with similar or interdependent
economies.
The development of city clusters in China is somewhat
similar to the formation of the megalopolis in the United
States, as described by Gottmann (1961). However, there
are some differences in terms of the number of cities in an
area, their infrastructure, and the services they provide to
the region, as compared to the US. City clusters in China
tend to be much more concentrated and densely popu-
lated, with little room for natural areas; for example, the
distance between cities is often less than 10 km in the
Pearl River delta. In the city of Guangzhou, spacing
between residential buildings is so restricted that they are
often referred to as “handshaking” buildings. Also, there
is no clear, functional division of infrastructures among
the cities, due to a lack of coordination between city
planners. Cities within a cluster often compete for avail-
353
© The Ecological Society of America www.frontiersinecology.org
REVIEWS REVIEWS REVIEWS
City clusters in China: air and surface water
pollution
Min Shao, Xiaoyan Tang*, Yuanhang Zhang, and Wenjun Li
City clusters are made up of groups of large, nearly contiguous cities with many adjoining satellite cities and
towns. Over the past two decades, such clusters have played a leading role in the economic growth of China,
owing to their collective economic capacity and interdependency. However, the economic boom has led to a
general decline in environmental quality. This paper will review the development and current status of the
major environmental problems caused by city clusters, focusing on water and air pollution, and suggest possi-
ble strategies for solving these problems. Currently, deteriorating water quality is of major concern to the pub-
lic and decision makers alike, and more than three-quarters of the urban population are exposed to air quality
that does not meet the national ambient air quality standards of China. Furthermore, this pollution is charac-
terized by high concentrations of both primary and secondary pollutants. Environmental pollution issues are
therefore much more complex in China than in western countries. China is expected to quadruple its GDP by
2020 (using 2000 as the base year for comparison) and, consequently, will face even more serious environmen-
tal challenges. Improving energy efficiency and moderating the consumption of natural resources are essential
if China is to achieve a balance between economic development and environmental health.
Front Ecol Environ 2006; 4(7): 353–361
In a nutshell:
• The emergence of city clusters, large groups of cities and towns
in close proximity to one another, has contributed to China’s
rapid economic growth over the past 20 years
• However, environmental quality has deteriorated within and
around these clusters, with pollution issues becoming widespread
•
Air pollution, especially increasing levels of fine particles and
ground-level ozone, is a growing environmental problem in city clus-
ters, and a multi-objective strategy is necessary for effective control
• China must improve its energy efficiency and resource con-
sumption in order to achieve environmentally friendly eco-
nomic development and a sustainable society
Authors’ contact details are on p361
able natural resources, investment, and regional funding
for infrastructure development and improvement. For
example, five separate international airports have been
constructed in recent years in the Pearl River delta
(including Hong Kong and Macau). Better intercity
cooperation could avoid such wasteful redundancy in the
future, resulting in a more efficient regional economy
(Bao 2005).
If, as expected, such rapid development continues over
the next several decades, demographic trends suggest that
China will experience an even greater rate of urbaniza-
tion. Population in urban areas has already increased
from 20.0% of the total population in 1980 to 36.1% in
2000 (National Bureau of Statistics 2001a), and reached
37.8 % in 2003 (Li and Ji 2003). Despite this rapid pace
of urbanization, current levels are still far below the
global average (48.3% in 2003; United Nations
Population Division 2004). There is still great potential
for further urbanization, therefore, particularly as the
urbanization process catches up with the pace of industri-
alization, which is often just as fast in villages (National
Bureau of Statistics 1999).
The combination of rapid economic growth and urban-
Environmental pollution and city clusters M Shao et al.
ization has resulted in substantial environ-
mental problems throughout China, but
nowhere more so than in city clusters. A
considerable part of China’s GDP was
achieved at the cost of over-consumption
of energy and other natural resources. The
Pearl River delta, for example, although
accounting for only about 20% of
Guangdong province, consumed 67% of
the coal and 85% of the oil for the entire
region. Due to the close proximity of the
cities and the large number of emissions
sources, ambient concentrations of SO
2
and NO
2
in the Pearl River delta region
were 2–3 times the level found in other
parts of the province (CESPKU and GIES
2004). Pollutants from various cities in
the area tend to mix and spread over the
entire region (Wang SL et al. 2005).
There is an urgent need to incorporate
environmental issues into planning
China’s urban areas, in order to reduce the
risks of further environmental degrada-
tion. This paper briefly describes the role
of city clusters in China’s economic devel-
opment, and describes the regional air and
watershed pollution that has developed as
a result of the rapid economic growth
within these city clusters. We also propose
possible solutions to these environmental
problems, taking into account the social
and economic plans for medium- and
long-term development in China.
Economic growth in city clusters
Urbanization in China has occurred most rapidly in the
coastal areas, due to the stronger economic base and more
developed infrastructure, as well as the greater abundance
of natural resources. As a result, several city clusters have
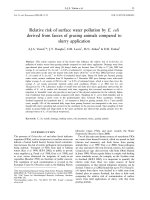
arisen in coastal areas and nearby regions (Figure 1). For
several reasons, the formation of city clusters often acts as
a catalyst for economic growth and enhances the compet-
itiveness of the region as a whole. The central govern-
ment has therefore developed long-term plans to support
rapid coastal urbanization, followed by efforts to increase
urbanization, in the central part of the country, thereby
aiding economic development (National Bureau of
Statistics 2001b). In essence, the three largest city clus-
ters – the Beijing–Tianjin–Bohai Bay, Yangtze River
delta, and Pearl River delta regions – have become the
forerunners of modernization in China.
At present, the Yangtze River delta and Pearl River delta
areas are the most fully developed, followed by the
Beijing–Tianjin–Bohai Bay cluster and the recently initi-
ated Northeast cluster (Table 1). The Pearl River delta city
cluster has expanded rapidly since the 1980s, due primarily
354
www.frontiersinecology.org © The Ecological Society of America
Figure 1. The distribution of city clusters in eastern China. The closed dots
indicate cities, sized according to urban population size; the dashed circles indicate
city clusters, sized according to GDP. Details of the Northeast plains, Beijing–
Tianjin–Bohai Bay area, Yangtze River delta, and Pearl River delta are given in
Table 1; the other city clusters are generally development zones around one large
city. Central-China plains, Guanzhong, Wuhan, and Changsha are used as
names of city clusters near the cities of Zhengzhou, Xi’an, Wuhan, and Changsha
cities, respectively. Redrawn from Zhang (2004).
Mid China Plain
Northeast Plain
Guanzhong
Wuhan
Beijing–Tianjin–Bohai
Changsha
Pearl River delta
Yangtze River delta
Legend
City City cluster
P > 10 M
5M–10M
1M–5M
0.5M–1M
< 0.5M
Large
Medium
Small
M Shao et al. Environmental pollution and city clusters
to former political leader
Deng Xiaoping’s policy of
creating “special economic
zones”, designated regions
where governmental policy
fosters a market economy
instead of a planned econ-
omy. Similarly, the exponen-
tial economic growth of
Shanghai in the 1990s led
rapidly to accelerated growth
among cities in its neighbor-
hood. The Beijing–Tianjin–
Bohai Bay area is a unique
city cluster that formed spon-
taneously around the twin
megacities of Beijing and
Tianjin.
The Northeast plains cluster, the former national cen-
ter for heavy industry from the 1950s and throughout the
1980s, is now facing major challenges in maintaining its
economic strength, following the exhaustion of its once
abundant natural resources, especially coal, oil, and iron
ore. Industrial restructuring and rehabilitation are mak-
ing the Northeast cluster China’s fourth economic pillar
(Table 1). While these four regions make up less than 3 %
of China’s territory, and encompass only about 12% of the
country’s total population, they account for nearly half of
the national GDP (47% in 2001; National Bureau of
Statistics 2002).
Although the government has also supported increased
urbanization of small towns (Bai 2002), it is the large city
clusters that are expected to drive economic develop-
ment for the foreseeable future (Li and Ji 2003). Even so,
it is widely predicted that millions of people will migrate
from rural areas to adjacent urban areas over the next sev-
eral decades, leading to the widespread growth of small
and medium-sized cities, some of which are likely to
become part of future city clusters. For instance, Henan
Province, formerly a relatively poor agricultural province
but with the largest population of any of China’s
provinces, has since grown to become the fifth largest
provincial economy in China, based on GDP (2004 sta-
tistics; Zhang 2005). This economic expansion was due
primarily to urban migrations and a subsequent shift in
the economic base, from agricultural to industrial.
Meanwhile, the Central-China plains city cluster in the
same province is also growing very quickly. These devel-
opments are seen as a rejuvenation of economic strength
in central China.
The city clusters have major advantages in terms of
regional economic development: the drop in GDP due to
environmental pollution resulting from such rapid eco-
nomic growth has largely been ignored. In 1997, a World
Bank report indicated that economic losses caused by
environmental pollution in China ranged from 3–8 % of
GDP, which attracted the attention of both policy makers
and academics (World Bank 1997). Although later esti-
mates provided different numbers, by the end of the 20th
century, economic losses due to environmental pollution
were probably around 4–5% of GDP, which is comparable
to the 5% estimated for the US in the mid-1970s and the
3–5% estimated for the European Union in the mid-
1980s (Xu 1998). However, there are no truly reliable
estimates of the impact that pollution from city clusters
has on GDP, despite the importance of the issue.
Watershed pollution
China has insufficient water resources. The amount of
fresh water available per capita is about one-quarter of
the global average of 8513 m
3
per year (2002 statistics;
World Bank 2003). In a survey of more than 600 Chinese
cities, two-thirds had inadequate water supplies, while
1 in 6 experienced severe water shortages (Li 2003).
Water pollution caused by rapid urbanization and the for-
mation of city clusters has exacerbated the lack of acces-
sible drinking water. While levels of industrial wastewater
discharge have largely stabilized, domestic wastewater has
increased considerably. While the total amount of
released industrial wastewater fluctuated around 22 bil-
lion tons from 1995 to 2004, the domestic sewage dis-
charge increased from 13.1 billion tons in 1995 to
22.1 billion tons in 2000, and up to 26.1 billion tons in
2004 (State Environmental Protection Administration
[SEPA] 1995–2004). This was due primarily to the enact-
ment of more stringent controls on industrial sources of
wastewater; in 2003, 91% of industrial wastewater was
treated, in contrast to only 32% of urban domestic sewage
(National Bureau of Statistics 2004).
As a consequence, surface water quality has become an
issue of great concern in China. A national survey of
seven major rivers in China, carried out in 2004, revealed
that water quality measurements in 28% of 412 moni-
tored sections were below grade V, the worst grade in the
national standard for water quality in China. These
results indicate that, for these sections of river at least,
355
© The Ecological Society of America www.frontiersinecology.org
Table 1. The contribution to national GDP from the four major city clusters in 2002
GDP per capita Percentage
Number Area Population (1000 yuan in national
City clusters of cities Megacities (1000 km
2
) (million) person
–1
) GDP (%)
Pearl River 25 Guangzhou,
delta Shenzhen 41.7 23.0 35.7 11.4
Yangtze River 43 Shanghai, 99.6 75.3 22.5 23.7
delta Nanjing,
Hangzhou
Beijing–Tianjin– Beijing,Tianjin,
Bohai Bay 9 Tangshan 55.3 35.1 14.2 7.0
Northeast plain 17 Shenyang,
Dalian 77.1 27.0 13.5 5.1
National Bureau of Statistics (2002)
Environmental pollution and city clusters M Shao et al.
the water supply is virtually of no practical or functional
use, even for agricultural irrigation. For the Haihe River,
which provides the cities of Beijing and Tianjin with the
bulk of their drinking water, this figure was as high as
57%, and for the Liaohe River, which supplies water to
Northeast China, it was 38% (see Figure 2 for the loca-
tions of these rivers). Overall, more than 90% of the river
sections that flowed through urban areas showed a water
quality of grade V or worse (SEPA 1995–2004). The
higher the grade, the worse the water quality; only water
with a grade lower than III is drinkable. The same survey
suggested that even the water quality of the Yangtze and
Pearl Rivers, both of which have relatively abundant
water flow, was a cause for concern; approximately 10%
of the monitored sections of these two
rivers also revealed water quality worse
than grade V, and all monitored sections
in the urban area of Guangzhou (on the
Pearl River) had water quality around
grade V or worse. The water quality of
the rivers shown in Figure 2 was charac-
terized only by conventional indicators,
such as chemical oxygen demand
(COD), ammonia, and volatile phenols,
among others. The situation is even
more worrisome when endocrine disrupt-
ing organic substances are taken into
consideration as well (An and Hu 2006).
Lake Taihu, the third largest freshwa-
ter lake in China, provides a typical
example of water pollution caused by
city clusters. With a total watershed
area of about 36 500 km
2
, Taihu is situ-
ated within Jiangsu and Zhejiang
provinces. The city of Shanghai, as well
as more than 37 other cities and towns,
is sited within its watershed. GDP in
the area around Lake Taihu increased
by a factor of 17 between 1980 and
1998; per capita GDP in the area was
three times the national average (State
Council of China 1998), while the population density
was eight times the national average (Gao et al 2003). The
water quality of Lake Taihu has deteriorated greatly during
this period (Figure 3), largely as a result of this rapid eco-
nomic growth. The lake remains the most important
source of drinking water for the inhabitants of the Yangtze
River delta region, but water quality has dropped by
approximately one grade level every decade (Qin et al.
2004), and in 2004 nearly 60% of sampling sites in the
lake recorded water quality lower than grade V (SEPA
1995–2004). As a result, the entire watershed area is now
facing a shortage of potable water. Residents in the area
who enjoyed the clean water of the lake in the past are
now compelled to buy bottled water for drinking.
According to Gao et al. (2003), over
80% of COD and 70% of total phos-
phorus originated from urban and resi-
dential areas around the lake, with 42%
of COD and 60% of total phosphorus
derived from domestic sewage dis-
charge. Research has shown that
increased phosphorus concentration is
the key factor in the worsening
eutrophication of Lake Taihu (Dokulil
et al. 2000); domestic sewage is there-
fore clearly a major source of water pol-
lution in the lake. Future conversion of
agricultural areas in the watershed to
urban environments will very probably
lead to even greater levels of water pol-
356
www.frontiersinecology.org © The Ecological Society of America
Figure 2. Water quality of seven major rivers in China. The length of the bars are
normalized to 1; the lengths of the green, yellow, and red bars represent the percentages
of each river section with water quality between grades I–III, between grades IV–V,
and grade V or worse, respectively. (According to the national surface water quality
standards of China [GB3838-2002], water of grades I–III is suitable for drinking,
grade IV is for industrial and recreational use, and grade V is for agricultural use).
Songhuajiang
Liaohe
Haihe
Yellow River
Huaihe
Pearl River
Yangtze River
Legend
Grade I – III
Grade IV– V
Grade > V
River
Watershed
Figure 3. Historical trends in water quality in Taihu lake. The water quality grading
system is the same as in Figure 2. (Derived from monitoring data provided by
National Environmental Monitoring Center.)
March 1981
February 1991 February 2001
Grade III
Grade II
Grade IV
Grade V
M Shao et al. Environmental pollution and city clusters
lution (Gao et al. 2003). The
deteriorating condition of Lake
Taihu is typical of the problems
associated with the increasingly
polluted nature of China’s
sources of freshwater, and illus-
trates the urgent need to inte-
grate both water pollution and
population controls into the
planning for future economic
development in the country’s
watersheds.
Regional air pollution
Air pollution is perhaps China’s
biggest environmental problem.
Results from routine monitoring
of 360 cities in 2004 revealed
that the air quality of nearly 70%
of urban areas did not meet the
country’s national ambient air
quality standards (NAAQS), and that nearly 75% of
urban residents were regularly exposed to air considered
unsuitable for inhabited areas (SEPA 1995–2004).
China has high levels of sulfur dioxide (SO
2
) and total
suspended particulates (TSP), because coal is the source
of 60–70% of its primary energy. Meanwhile, the number
of motor vehicles has increased substantially since the
mid-1980s, primarily in urban areas and city clusters; in
Beijing, for example, the number of vehicles increased
from 0.5 million in 1990 to 2 million in 2002 (Beijing
Municipal Bureau of Statistics 2003). The growing num-
ber of cars and trucks has led to much higher levels of
atmospheric nitrogen oxides throughout the country, but
especially in urban areas.
Since 2000, high concentrations of aerial particulate
matter with diameters less than 10m (PM
10
) are the
most frequent cause of NAAQS grade II violations (that
is, an average annual concentration of such particulate
matter at concentrations ≤ 100 g m
–3
). In Beijing, the
annual average level of PM
10
fluctuated around 160 g
m
–3
from 2000 to 2004 (Beijing EPB 2005 ). Megacities
such as Beijing, Shanghai, and Guangzhou are frequently
among the cities of the world with the highest levels of
airborne particulate matter (UNEP 2002).
Large areas of China are exposed to high levels of par-
ticulate pollution (Figure 4). For example, the vast region
extending from the North China plain down to the
Yangtze River delta and the heavily urbanized Pearl River
delta region show aerosol optical depths (AOD) of
0.6–0.8 (AOD is an index describing the absorption of
light due to atmospheric particles ie the opaqueness of
the air). In contrast, the AOD for Europe measures
between 0.5 and 0.1 for industrialized and rural areas,
respectively (Gonzales et al. 2000). A study of 30-year
variations of atmospheric AOD in China showed that
levels increased by 9.5% from 1970 to 1979 and by 21.8%
from 1980 to 1989 (Luo et al. 2002).
In recent years, the “gray sky” phenomenon has been
the subject of growing public concern (Figure 5).
Research shows that high levels of ambient fine particles
(PM
2.5
, ie airborne particulate matter with diameters less
than 2.5 m) lead to poor visibility (Song et al. 2003). In
2001, the concentration of PM
2.5
in Beijing averaged
110 g m
–3
, more than seven times the ambient air qual-
ity standard recommended by the US Environmental
Protection Agency for fine particulate matter (Wang et
al. 2004). Fine particle pollution in urban areas poses a
serious health risk to residents, but particularly to indi-
viduals who suffer from respiratory ailments, the elderly,
and children (Zhang et al. 2002; Li et al. 2005). Such
severe fine-particle pollution is seldom observed in devel-
oped countries.
The very high PM
2.5
levels are most probably the result
of secondary particle production due to chemical reac-
tions in the atmosphere. Ground-level ozone (a typical
component of photochemical smog) is formed by the reac-
tions of NO
x
and volatile organic compounds (VOCs)
under solar radiation (Haggen-Smit 1952). Areas of ele-
vated fine particulate concentrations can also form down-
wind of the precursor source areas if there is considerable
movement of air. More importantly, atmospheric oxida-
tion capacities are enhanced by increasing O
3
concentra-
tions (Wennberg et al. 1998). Thus, SO
2
, NO
x
, and
volatile organic compounds will be transformed into fine
particles (ie PM
2.5
) more efficiently where O
3
concentra-
tions are higher due to increased rates of oxidation.
High concentrations of ground-level ozone have been
observed for many years in China’s urban areas. For
example, researchers at Peking University measuring the
diurnal variations of episodic ground-level ozone in
357
© The Ecological Society of America www.frontiersinecology.org
Figure 4. Distribution of aerosol optical depth over China in 2002 (Li et al. 2003).
Environmental pollution and city clusters M Shao et al.
Beijing from 1982 to 2003 found that O
3
concentrations
have increased sharply since the 1990s, and often exceed
200 ppb (Figure 6). A similar study in the Yangtze River
delta region showed that high ozone concentrations are
also often found at sites some distance removed from
urbanized or industrial regions (Wang et al. 2005).
Such high levels of both primary and secondary airborne
pollutants lead to the development of a (perhaps typically
Chinese) “air pollution complex” concept (Figure 7). The
main purpose of the air pollution complex model is to
underscore the variety of interactions of airborne pollu-
tants in China: how increased atmospheric oxidation
capacity, caused by the formation of ozone, will speed up
the conversion of SO
2
, NO
x
, and VOCs into sulfates,
nitrates, and particulate organic matter, and how these fine
particles, in turn, play a catalytic role in further heteroge-
neous reactions (Ravishankara 1997). While it is true that
these processes are observed in many locations around the
world, the conditions prevalent in China – high concen-
trations of SO
2
, oxidants, and their precursor components,
as well as the comparatively high concentrations of sus-
pended particles, etc – result in a level of aerial chemical
interactions that is probably unique to the country.
In recent years, intensive efforts have been made to
reduce air pollution in China. Countermeasures, such as
adapting energy production (including shifting primary
energy production from coal to gas),
reducing sulfur emissions through
increased use of low-sulfur coal and fuel
gas desulfurization, and promoting more
stringent vehicular emission standards as
well as switching to non-leaded gasoline,
have been implemented in urban areas
throughout the country. These measures
have, to some extent, slowed the rate of
increase of pollutant emissions (Figure
8). Nevertheless, while these measures
might be effective for the abatement of
some primary pollutants, they are insuffi-
cient for the control of secondary pollu-
tants and the resulting chemical interac-
tions that form the core of the air
pollution complex model.
The pollution complex concept might
also be applicable to water pollution, in
view of the interactions between aque-
ous pollutants (eg metals, nitrogen, and
organic material) and the interfaces
among water, sediment, and aquatic
organisms. Furthermore, exchange of
358
www.frontiersinecology.org © The Ecological Society of America
Figure 5. Photographs of Beijing, taken from the top of a building on the campus of Peking University, (a) on a clear day and
(b) on a hazy day.
© T Thomas, Inst of Tropospheric Research, Germany and M Hu, Peking University
Figure 6. Trends in the episodic concentrations of ambient O
3
measured in Beijing
from 1982 to 2003 in Zhongguancun (ZGC), a northwest suburb of the city, about
20 km of Tian’anmen square. The 2008 Olympic Games site is about 4 km north of
ZGC. The yellow line indicates the 1-hour average O
3
concentration at grade II,
according to the national ambient air quality standards of China (2000 amendment
to GB3095-1996).
0:00 3:00 6:00 9:00 12:00 15:00 18:00 21:00 24:00
Beijing time
300
250
200
150
100
50
0
O
3
(g m
-3
)
April–June 1982 (ZGC)
June 1993 (ZGC)
June 2000 (ZGC)
June 1987 (city average)
June 1997 (ZGC)
10–24 Aug 2003 (Olympic site)
(a)
(b)
M Shao et al. Environmental pollution and city clusters
materials between the atmosphere, pedosphere, and the
terrestrial and aquatic ecosystems (eg the nitrogen cycle)
links air, water, and soil pollution together, suggesting
that the control of the pollution complex requires an
integrated approach. While abundant expertise from
Europe and the US is available to address pollution prob-
lems (such as photochemical smog, acid deposition, and
suspended particles), the knowledge and experience
needed to find solutions to the unique pollution complex
in China are still lacking.
Challenges for future development
The Chinese Government has set as a goal the doubling of
the country’s GDP (using 2000 as the baseline) by 2010,
and quadrupling it by 2020. As a
result, each province and city, from
the coastal areas to the western parts
of China, has created its own eco-
nomic development plans accord-
ingly. A new round of rapid eco-
nomic development is therefore
expected to spread across the coun-
try. More city clusters will be gener-
ated as a result, and the natural envi-
ronment will be subjected to even
greater stress.
If, by 2020, 50% of China’s popu-
lation live in towns and cities,
domestic water needs will be double
those of 2000, while industrial use
will increase 1.5 times (Peng 2002).
As water consumption rises, so too
will the amount of discharged
domestic sewage, by a factor of at
least 1.3 (Han 2004). Should effec-
tive countermeasures not be taken,
China’s already fragile freshwater ecosystems will come
under even greater strain.
Low energy efficiency is one of the main causes of air
pollution in China. Currently, the nation is one of the
world’s biggest consumers of energy and materials, but is
very inefficient in the use of these resources (Imhoff et al.
2004). While China’s GDP accounted for only one-
thirtieth of the total global GDP, raw material consump-
tion rates were much higher; for instance, China’s steel,
coal, and cement consumption accounted for 25%, 33%,
and 20% of world totals, respectively (Guo 2004).
The increase in vehicular traffic is another main cause
of air pollution. China is anticipating a threefold to sev-
enfold increase in the number of motorized vehicles
between 2002 and 2020. It is projected that CO
2
emis-
359
© The Ecological Society of America www.frontiersinecology.org
Figure 7. “Air pollution complex” concept in a Chinese city cluster.
PM, O
3
Inflow
Biogenic
PM, O
3
at higher
concentrations
Outflow
Deposition
FluxAnthropogenic
Oxidant
(O
3
, OH)
PM
2.5
(SO
4
2-
, NO
3
-
)
HC, NO
x
SO
2
, NO
x
PM
10
, PM
2.5
hy
SO
2
emissions
GDP
Discharge of COD
Smoke and dust emission
Numbers of private cars
15000
12000
9000
6000
3000
0
25
20
15
10
5
0
1994 1996 1998 2000 2002 2004
GDP (billion yuan RMB)
SO
2
, dust emission and COD discharge (million tons)
Number of private cars (million)
Figure 8. GDP, number of cars, and emission of SO
2
, smoke and dust, and discharge of
COD in China, 1995–2004. (Data on GDP and private cars from the National Bureau
of Statistics [1995–2004]; data on emissions of SO
2
, smoke and dust, and COD
discharge from SEPA [1995–2004].)
Environmental pollution and city clusters M Shao et al.
sions from motor vehicles will quadruple during the same
period, carbon monoxide and hydrocarbon levels will
triple, and NO
x
and PM levels will also remain at high
levels (CAE 2003).
Increasing China’s already severe air pollution will sub-
stantially increase the incidence of respiratory diseases
throughout the country, as air pollution is estimated to be
the primary cause of nearly 50% of all respiratory ail-
ments (Brunekreef and Holgate 2002). According to UN
Environmental Programme statistics (1999), soot and
particle pollution from the burning of coal causes approx-
imately 50 000 deaths per year in China, while some
400 000 people suffer from chronic bronchitis annually in
the country’s 11 largest urban areas. The UN
Development Programme estimated that the death rate
from lung cancer in severely polluted areas of China was
4.7–8.8-fold higher than in areas with good air quality
(UNDP 2002). Extrapolating from current emission lev-
els and trends, the World Bank estimated that by 2020
China will need to spend approximately US$390 billion
– or about 13% of projected GDP – to pay for the health-
care costs that will accrue solely from the burning of coal
(World Bank 1997).
A recent study on sustainable energy strategies for
China indicates that by means of improvements in energy
efficiency and some restructuring, the projected quadru-
pling of the country’s economy would require only a dou-
bling of current energy consumption rates (Zhou 2003).
Implementing sustainable energy strategies will greatly
improve China’s energy efficiency by 2020, and CO
2
emissions, remaining high in terms of emissions per unit
GDP when compared with other countries, will be greatly
reduced as well.
It is now widely accepted in China that the course of
economic development projected to occur over the
next 20 years must avoid the pitfalls of high energy and
resource consumption, widespread pollution, and the
low rates of return that characterized the expansion of
the Chinese economy over the previous 20 years. The
World Bank and the Global Environment Facility have
financially supported the development of three Energy
Management Companies (EMCs) in China, and this
has helped to identify and eliminate energy ineffi-
ciency, but a similar approach is needed for the conser-
vation of water and other natural resources as well. To
realize this goal, laws and regulations promoting a cycli-
cal economy must be introduced, so that producers,
consumers, governmental organizations, and the media
all bear social responsibilities equally. Greater invest-
ment in the technologies that would promote a cyclical
economy is also required, including technologies for
the re-utilization of industrial and agricultural waste
material. Finally, education programs designed to
increase public awareness concerning current environ-
mental issues and the incorporation of resource conser-
vation into economic planning are essential for China’s
future development.
Conclusions and suggested strategies
China’s economic growth over the past 20 years has
brought many benefits to its citizens, but at the cost of an
exponential increase in pollution over a relatively short
time (Liu and Diamond 2005). City clusters, where both
economic activity and large populations are concentrated,
suffer from extensive environmental degradation. China’s
unique pollution complex, characterized not only by high
levels of primary pollutants but also by the interactions
between them, and by their spread from source locations,
leads to complicated regional problems. The large-scale
watershed pollution and air pollution complex will con-
tinue to worsen if stringent measures to protect the envi-
ronment are not taken soon.
The realities of both economic losses and increasing
mortality rates due to pollution have prompted a very
serious consideration of future developments, and as
China enters into a new phase of development and eco-
nomic prosperity, it finds itself at a crossroads. Will the
country continue down the same road as in the past two
decades, or will environmental quality, energy efficiency,
and the conservation of resources no longer be sacrificed
at the altar of economic development?
Acknowledgements
The authors would like to thank YH Zhuang, CS Kiang,
JY Fang, S Slanina, and SQ Zhang for their valuable com-
ments and suggestions. Financial support was provided by
the China National Key Basic Research Project
(#TG1999045700) and the China National Natural
Science Foundation (#40275037).
References
An W and Hu JY. 2006. Effects of endocrine disrupting chemicals
on China's rivers and coastal waters. Front Ecol Environ 4:
378–86.
Bai CX. 2002. Urbanization and small town development models.
Beijing City Plan Constr Rev 2: 62–64
Bao TZ. 2005. On the positioning of the five airports in the Pearl
River Delta. Int Econom Trade Res 21: 13–17
Beijing Municipal Bureau of Statistics. 2003. Beijing communiqué
on municipal economy and social development. http://unpan1.
un.org/intradoc/groups/public/documents/apcity/unpan018360
.pdf. Viewed 24 July 2006.
Beijing EPB (Beijing Municipal Environmental Protection
Bureau). 2005. Beijing communiqué on environmental quality,
2001–2005. www.bjee.org.cn. Viewed 24 July 2006.
Brunekreef B and Holgate S. 2002. Air pollution and health.
Lancet 360: 1233–42
CESPKU (College of Environmental Sciences, Peking University)
and GIES (Guangdong Institute of Environmental Sciences).
2004. Research report of Guangdong provincial planning on
air pollution control.
CAE (Chinese Academy of Engineering), National Academy of
Engineering (US), and National Research Council of the
National Academy. 2003. Personal cars and China. Beijing,
China: China Machine Press.
Dokulil M, Chen M, and Cai Q. 2000. Anthropogenic impacts to
large lakes in China: the Taihu example. Aquat Ecosyst Health
Manage 3: 81–94.
360
www.frontiersinecology.org © The Ecological Society of America
M Shao et al. Environmental pollution and city clusters
Gao C, Zhu JY, Dai KW, et al. 2003. Impact of rapid urbanization
on water quality and related mitigation options in Taihu Lake
area. Sci Geogr Sinica 23: 746–50.
Gonzalez CR, Veefkind JP, and de Leeuw G. 2000. Aerosol optical
depth over Europe in August 1997 derived from ATSR-2 data.
Geophys Res Lett 27: 955–56.
Gottmann J. 1961. Megalopolis: the urbanized northeastern
seaboard of the United States. New York, NY: The Twentieth
Century Fund.
Guo K. 2004. Current economic growth trend and macroeconomic
policy analysis. J China Metal 10: 1–3.
Haggen-Smit AJ. 1952. Chemistry and physiology of Los Angeles
smog. Ind Eng 44: 1342–46.
Han Z. 2004. The discharge projection of urban domestic sewage of
2020. Dev Environ Impact Assess 11: 28–31.
IEA (International Energy Agency). 2004. Key World Energy
Statistics. www.iea.org/dbtw-wpd/Textbase/nppdf/free/2004/
keyworld2004.pdf. Viewed 24 July 2006.
Imhoff ML, Bounoua L, Rocketts T, et al. 2004. Global patterns in
human consumption of net primary production. Nature 429:
870–73.
Li GY, Tang XL, Bi XH, et al. 2005. Composition and mutagenicity
of the particle-sized fractions from urban particulate matter in
Guangzhou city. Acta Sci Circumstantiae 25: 319–23
Li JW and Ji YH. 2003. International comparison of Chinese
urbanization. Urban Stud 11: 1–10
Li CC, Mao JT, Lau KH, et al. 2003. Study on the characteristics of dis-
tribution and seasonal variation of aerosol optical depth in eastern
China with MODIS products. Chinese Sci Bull 48: 2488–95.
Li SG. 2003. Research on carrying capacity of urban water resource
and its adjusting method (PhD dissertation). Beijing, China:
Peking University.
Liu JG and Diamond J. 2005. China’s environment in a globalizing
world. Nature 435: 1179–86
Luo YF, Lu DR, Zhou XJ, et al. 2002. Analysis on the spatial distri-
bution of aerosol optical depth over China in recent 30 years.
Chinese J Atmos Sci 26: 721–30.
Molina MJ and Molina LT. 2004. Critical review: mega cities and
atmospheric pollution. J Air Waste Manage Assoc 54: 644–80.
National Bureau of Statistics. 1999. Series analysis reports for New
China 50th anniversary. Beijing, China: Statistics Press.
National Bureau of Statistics. 2001a. The fifth national census
report. Beijing, China: Statistics Press.
National Bureau of Statistics. 2001b. Series analysis reports for
national economic and social development in the “ninth five
years” period. Beijing, China: Statistics Press.
National Bureau of Statistics. 2002. China yearbook of city statis-
tics. Beijing, China: Statistics Press.
National Bureau of Statistics. 2004. China yearbook of statistics.
Beijing, China: Statistics Press.
Peng Y. 2002. The demand analysis of water resources in China’s
urbanization process. Academic Symposium of Water Resource
and Water Carrying Capacity, 21–23 May 2002, Weihai City,
Shandong Province:
Ravishankara AR. 1997. Heterogeneous and multiphase chemistry
in the troposphere. Science 276: 1058–65.
SEPA (State Environmental Protection Administration).
1995–2004. State of the environment China. Beijing, China:
Environmental Science Press.
Song Y, Tang XY, Fang C, et al. 2003. Relationship between visibil-
ity degradation and particle pollution in Beijing. Acta Sci
Circumstantiae 23: 468–71
State Council of China. 1998. Ratification of the ninth five-year
plan and 2010 planning for water pollution prevention of
Taihu Lake. State Council Document No 2.
UNDP (United Nation Development Programme). 2002. China
report on human development 2002. Beijing, China: Financial
Economy Press.
UNEP (United Nation Environmental Programme). 1999. Global
environment outlook 2000. London, UK: Earthscan Publi-
cations Ltd.
UNEP (United Nations Environment Program). 2002. Global
environmental outlook 2003. London UK: Earthscan Publi-
cations Ltd.
United Nations Population Division. 2004. World urbanization
prospects: the 2003 revision. www.un.org/esa/population/publica-
tions/wup2003/2003WUPHighlights.pdf. Viewed 24 July 2006.
Wang HX, Kiang CS, Tang XY, et al. 2005. Surface ozone: a likely
threat to crops in Yangtze delta of China. Atmos Environ 39:
3843–50.
Wang JL, Zhang YH, Shao M, et al. 2004. The chemical composi-
tion and quantitative relationship between meteorological
condition and fine particles in Beijing. J Environ Sci 16:
860–64
Wang SL, Zhang YH, Zhong LJ, et al. 2005. Interaction of urban air
pollution among cities in Zhujiang delta. China Environ Sci 25:
133–37.
Wennberg PO, Hanisco TF, Jaeglé L, et al. 1998. Hydrogen radicals,
nitrogen radicals, and the production of O
3
in the upper tropos-
phere. Science 279: 49–53.
World Bank. 1997. Clear water, blue skies: China’s environment in
the new century. Washington, DC: World Bank.
World Bank. 2003. World development indicator 2003.
Washington, DC: World Bank.
Xu SL. 1998. Quantification of economic loss of environmental
pollution in China: case study and theoretical analysis. Beijing,
China: Environmental Science Press.
Zhang DW. 2004. City cluster in the mid China plain: a conceptual
development strategy of economic revival. Government report
of Henan Provincial Planning Committee.
Zhang JF, Hu W, Wei FS, et al. 2002. Children’s respiratory morbid-
ity prevalence in relation to air pollution in four Chinese cities.
Environ Health Persp 110: 961–67.
Zhang ZC. 2005. Zhengzhou as the central city in mid China:
advantages and opportunities. Zhengzhou Daily. April 1:
Column 14.
Zhou DD. 2003. China’s sustainable energy scenarios in 2020.
Beijing, China: Environmental Science Press.
State Joint Key Laboratory of Environmental Simulation and
Pollution Control, College of Environmental Sciences, Peking
University, Beijing, 10087 China *()
361
© The Ecological Society of America www.frontiersinecology.org
362
www.frontiersinecology.org © The Ecological Society of America
C
hina is a populous country with scarce resources and
relatively poor natural conditions. As a result of the
monsoon climate, rainfall occurs unevenly throughout
the year. China’s annual precipitation is about 6.2 trillion
m
3
, which corresponds to a depth of 648 mm over the
entire country (9.6 million km
2
; Liu 2002). Surface runoff
and groundwater per annum are 2.7 trillion m
3
and 830
billion m
3
, respectively. The net total amount of available
water (surface plus groundwater) is 2.8 trillion m
3
(MWR
1992). China’s available water resources per capita are
only 2220 m
3
, about one quarter of the world average
(Qian and Zhang 2001).
There are about 2300 lakes (excluding seasonal lakes)
in China, each with a water surface area larger than
1km
2
. These include 12 large lakes, each with a surface
area greater than 1000 km
2
. The total surface area of all
China’s lakes is 72 000 km
2
and the total storage capacity
is 709 billion m
3
, comprising 32% of the total fresh water
storage capacity (Qian 1994). In addition, there are also
some 85 000 reservoirs which, in 1998, had a combined
storage capacity of 458 billion m
3
, equivalent to 17% of
the total annual runoff (Gu 1999).
Variability across the country
Correlation analysis (NIWA and IWHR 1998) suggests
that China’s major river systems (Figure 1; Table 1) fall
into five categories: (1) the Songhua–Liao watershed
group in the northeast; (2) the Hai-Luan watershed group,
Yellow watershed, and Huai watershed group in the north-
central region; (3) the Yangtze watershed, Pearl water-
shed, and southeast watershed group; (4) the southwest
watershed group; and (5) the inland watershed group.
The major source of water to all the watersheds is rivers.
REVIEWS REVIEWS REVIEWS
Implementing China’s “Water Agenda 21”
Xiaoliu Yang
1*
and Jinwu Pang
2
China’s per capita available water is only 2220 m
3
, about a quarter of the world average. As a result, China faces
an imbalance between the supply and demand of water for agricultural and general population use. Poor water
resource development, wasteful usage, and water pollution are all exacerbating the problem. Water-related
issues have seriously hampered economic development in China, especially in recent decades, while the coun-
try has undergone rapid economic growth. Implementing a sustainable water resource strategy is therefore
vital. To meet the goals of national economic reconstruction and development, and to solve the water shortage
problem, China’s “Water Agenda 21” was formulated in 1998. This paper focuses on the implementation of this
strategy and discusses China’s approach to solving its water-shortage problems in order to safeguard sustainable
socioeconomic development.
Front Ecol Environ 2006; 4(7): 362–368
In a nutshell:
• China’s economic growth has been hindered by a shortage of
fresh water
• To balance water supply and demand and safeguard economic
development, China’s “Water Agenda 21” was introduced in
1998
• This aims to minimize water shortages and water pollution
and to meet the basic water needs of urban inhabitants, agri-
culture, and the environment
• Progress has been made in improving urban living standards,
balancing economic development and poverty alleviation,
securing food supplies, conserving soil and water, and protect-
ing ecosystems
• Nevertheless, further effort is required, particularly in inte-
grating water resources management and mobilizing the pri-
vate sector
Authors’ contact details are on p368)
XL Yang and JW Pang China’s “Water Agenda 21”
363
© The Ecological Society of America www.frontiersinecology.org
Taking into account the duplication
between surface water and groundwater
flows, the groundwater contribution is
only significant on the plains, particularly
in northern China (NIWA and IWHR
1998). Elsewhere in the country, ground-
water contribution is negligible. Table 2
gives the average water availability in
1993, relative to population density,
urbanization rate, income levels, and
arable land. The area south of the Yangtze
accounts for 81% of China’s water, but
only 54% of its population and 35% of the
arable land. Thus, per capita water avail-
ability for the area south of the Yangtze is
about four times greater than that for the
region to the north of the Yangtze, and the
per ha water availability for arable land
south of the Yangtze is about eight times
greater than that to the north of the river.
In general, less than 1700 m
3
of water per
capita represents water stress, while less
than 1000 m
3
per capita is classified as a
water shortage. Water resources in the Hai-Luan watershed
group are as low as 245 m
3
per capita, increasing to only 355
m
3
per capita when the net contribution of groundwater is
included. Availability in the Huai and Yellow River water-
sheds in northern China is greater, but is still less than 1000
m
3
per capita.
In contrast, water is abundant in the south and southwest
of the country. Inland watersheds account for about 35% of
China’s land area; although water availability per capita is
normally good, local desert communities face extreme
shortages. Water availability for irrigation is typically a lim-
iting factor in North China, but land rather than water is
the limiting factor in South China (Table 2). The situation
in areas varies; average water availability tends to exceed
evaporation rates in inland watersheds, suggesting that
there is still potential for increased irrigation.
Variability throughout the year
Water availability varies greatly at different times of the
year (Table 3). Annual variability is greater in the north (eg
the Songhua–Liao, Hai-Luan, and Yellow watersheds) than
in the south (eg the Yangtze and Pearl watersheds). There
can also be wide variability at the sub-watershed level;
typhoons and atmospheric depressions can dump huge
quantities of water in the space of a few days, leading to sub-
stantial changes in river levels, followed by flooding. The
relative stability of inland river flows is due to the continu-
ous influence of snowmelt, which can mask differences at
the sub-watershed level.
This variability leads to alternating floods and droughts
(Xu and Dai 2002). Historically, floods have been a serious
problem in China, so flood alleviation and control remain a
major concern in most regions (Li 1999). Construction of
storage reservoirs and levees has resulted in a variable degree
of protection from flooding, but huge areas of the country
remain vulnerable. Even the large cities may only be pro-
tected against a 40-year flood, with protection often
achieved at the expense of rural areas. Drought primarily
affects northern and inland watersheds (Zhang 1997). They
can be offset by making use of groundwater in dry years,
notably in the North China Plain, but this has only limited
potential when superimposed against general, and increas-
ing, scarsity. In contrast, typhoons and tropical storms are
predominantly a feature of the southern coast, where they
are relatively frequent during the early and late monsoon
months and can cause great damage.
Deterioration in quality
China’s water pollution problems are increasingly alarm-
ing. Table 4 shows that the discharge of wastewater and
Figure 1. China's major river systems.
Table 1. Distribution of water resources (MWR 1992)
Watershed/watershed group Available water resources
*
10
9
m
3
Songhua–Liao watershed group 193
Hai-Luan watershed group 42
Yellow watershed 74
Huai watershed 96
Yangtze watershed 961
Pearl watershed 471
Southeast watershed group 259
Southwest watershed group 585
Inland watershed group 130
Total China 2812
* Excluding groundwater recharge estimated to be transformed under natural con-
ditions into river discharge.
Songhua–Liao
China’s “Water Agenda 21” XL Yang and JW Pang
364
www.frontiersinecology.org © The Ecological Society of America
pollutants has increased since 2000; the total amount of
discharged wastewater in 2004 was 48.24 billion tons, of
which 22.11 billion tons was discharged industrial efflu-
ent and 26.13 billion tons was domestic sewage. At the
same time, the chemical oxygen demand (COD) dis-
charged reached 13.39 million tons, of which 38% came
from industrial sources and 62% from domestic house-
holds. A total of 1.33 million tons of ammonia–nitrogen
was discharged, of which 33% came from industry and
67% from domestic sources. Moreover, some untreated or
poorly treated wastewater and sewage are discharged
directly into rivers, lakes, and reservoirs, resulting in dif-
ferent levels of pollution. Some freshwater lakes are expe-
riencing severe eutrophication and shallow groundwater
has also been polluted in some areas. Water pollution has
exacerbated environmental degradation and further
aggravated the imbalance between supply and demand,
threatening sustainable use of water resources.
Formulation of China’s “Water Agenda 21”
As mentioned above, China is subject to severe floods
and droughts; this leads to water shortages and a serious
imbalance between water supply and the requirements for
industrial and domestic use and environmental needs. In
the northern part of the country and the inland water-
sheds, overexploitation of water resources from some
rivers has led to successive drying of river courses, partic-
ularly in the lower reaches. In some regions, overuse of
groundwater has caused serious regional declines in the
groundwater table, creating a series of ecological prob-
lems, including large-scale land subsidence, disappear-
ance of wetlands, and environmental deterioration (Liu
and Chen 2001). In addition, the problems of water pol-
lution and soil and water loss are very serious, severely
affecting efforts to harmonize population growth, natural
resources development, environmental protection, and
the preservation of ecosystem services. This has ham-
pered China’s socioeconomic development (Wang 2002).
China needs to implement a sustainable water resource
development strategy that will strengthen its water infra-
structure, protect ecosystems, conserve and protect its
water resources, control water pollution, and promote the
sustainable use of water resources throughout the country.
In the 1990s, the Central Government promulgated
China’s Agenda 21 (GPRC 1994). As a result, a number
of studies on water were conducted, including reports on
sustainable water resource development (Liu and He
Table 2. Water resource indicators for major watersheds/watershed groups in 1993 (NIWA and IWHR 1998)
Urban GDP per Arable Available water Unit water
Watershed (W)/ Population rate capita land resources
*
availability
watershed group (WG) 10
6
% index 10
6
ha 10
9
m
3
m
3
per capita m
3
/ha
–1
Songhua–Liao WG 113.2 41 107 19.5 193 1705 9900
Hai-Luan WG 117.6 24 113 10.8 42 355 3900
Yellow W 99.2 22 84 12.4 74 746 5970
Huai W 190.5 17 85 14.7 96 504 6800
Yangtze W 402.5 22 93 22.9 961 2390 41 950
Pearl W 141.5 28 130 6.5 471 3330 7250
Southeast WG 65.1 24 135 2.4 259 3980 107 900
Southwest WG 18.3 11 32 1.7 585 31970 344 100
Inland WG 24.7 37 91 5.4 130 5265 24 050
Total China 1172.6 24 100 96.4 2812 2400 29 150
Notes: * Excluding groundwater recharge estimated to be transformed under natural conditions into river discharge
** Equivalent of available water distributed uniformly over arable land
Table 3. Variability in river runoff (MWR 1992)
Mean annual Annual runoff at different relative values (mean
Watershed (W)/ runoff annual runoff = 100)
watershed group (WG) mm 10
9
m
3
20% 50% 75% 95%
Songhua–Liao WG 132 165 127 96 75 52
Hai-Luan WG 91 29 132 93 69 45
Yellow W 83 74 116 97 85 72
Huai W 225 66 135 93 67 40
Yangtze W 526 951 111 99 91 80
Pearl W 807 468 115 99 88 72
Southeast WG 1066 256 120 98 82 63
Southwest WG 688 585 110 100 92 81
Inland WG 34 116 108 99 93 85
Total China 284 2711 107 100 94 87
XL Yang and JW Pang China’s “Water Agenda 21”
365
© The Ecological Society of America www.frontiersinecology.org
1996), relationships between water, the economy, and
society (Chen 1997; Huang 1997), water financing (An
1997), and water conservation (Jiang 1997). Based on
this work, China’s Water Agenda 21 (MWR 1998) was
formulated. Priority was given to addressing water short-
age and pollution issues, and to meeting the basic water
needs of urban inhabitants, industry, agriculture, and
ecosystems. Water Agenda 21 outlined policies for sus-
tainable water resource development and listed key
actions and projects.
Ever since the period covered by the national Ninth
Five-year Plan (1996–2000), sustainability has become
the basic guiding principle for socioeconomic develop-
ment in China. As a result, a sustainable water resource
development strategy, as outlined in Water Agenda 21
(MWR 1998), has been implemented. This has led to
increased control and development of water resources in
the country’s major watersheds, and an improvement in
the potable water supply and sanitary conditions in
impoverished areas. More emphasis has been placed on
the improvement of irrigation systems for the purpose of
conserving water, on ecofriendly construction with regard
to soil and water conservation, on the prevention and
control of water pollution, and on comprehensive envi-
ronmental improvement. The water infrastructure in the
western part of China has been strengthened.
In line with China’s Water Agenda 21, action plans
were formulated in the Yangtze watershed (Yangtze River
Commission 1998), the Huai watershed (Huai River
Commission 1998), the Yellow watershed (Yellow River
Commission 1998), the Hai and Luan watersheds (Hai
River Commission 1998), Taihu Lake (Taihu Lake
Management Bureau 1998), the Songhua and Liao water-
sheds (Song and Liao Rivers Commission 1998), and the
Pearl watershed (Pearl River Commission 1998). These
plans have guided water resource development in each of
these watersheds.
A sustainable water strategy to support national
socioeconomic development
In 1995, the Central Government decided to further
strengthen water resource development (The State
Council of GPRC 1996). Consequently, a medium- and
long-term national plan that would balance water supply
and demand (NIWA and IWHR 1998) was developed.
The plan emphasized better allocation, more efficient use,
and stronger protection of water resources. The imple-
mentation of this plan helped to mitigate water shortages
in north China; for instance, during the drought of 2000,
such integrated water resource management prevented
the lower reaches of the Yellow River from drying up at
certain times of the year, as had previously occurred.
In 2001, the Central Government placed a high priority
on working towards sustainable economic and social
development (The State Council of GPRC 2001).
Recognizing that sustainable use of water resources is a
strategic issue in China’s development, the plan called for
the implementation of vigorous measures to strengthen
the water infrastructures, and strongly encouraged protec-
tion and sustainable management of water resources. In
urban and associated industrial and agricultural develop-
ment, the carrying capacity of water resources and effi-
ciency of water use had to be taken into consideration.
The plan also called for various water-saving technologies
and measures to be comprehensively implemented, and
for the development of low water consumption industries.
Finally, the plan encouraged the general public to become
much more aware of the need for water conservation, and
recommended that traditional methods for conserving
water be replaced with new technologies.
Actions and progress towards sustainable water use
Urbanization and living standards
Since the 1990s, the process of urbanization and the con-
struction of new urban facilities has continued to acceler-
ate. From 1992 to 2000, the populations in cities and
towns in China increased by 132 million people and the
rate of urbanization increased from 27.63% to 36.09%
(NBS, 1992, 2000). This has been accompanied by water
shortages in cities and towns, flooding, and drainage and
aquatic environmental problems. Four hundred of the
668 cities in China suffer from some degree of water
shortage (MWR 2002). Of these, 108 cities have serious
water shortages, of the order of about 6 billion m
3
annu-
ally. Six hundred and twenty-five cities are subject to
floods and waterlogging, due to inadequate flood control
measures and poor drainage systems (MWR 2002).
Table 4. Discharged wastewater and major pollutants in China’s rivers (SEPA 2005)
Amount of wastewater COD Ammonia–nitrogen
Year (billion tons) (million tons) (million tons)
Total Industrial Domestic Total Industrial Domestic Total Industrial Domestic
2000 41.51 19.42 22.09 14.450 7.045 7.405 na na na
2001 43.29 20.26 23.03 14.048 6.075 7.973 1.255 0.413 0.839
2002 43.95 20.72 23.23 13.669 5.840 7.829 1.288 0.421 0.867
2003 46.00 21.24 24.76 13.336 5.119 8.217 1.297 0.404 0.893
2004 48.24 22.11 26.13 13.392 5.097 8.295 1.330 0.422 0.908
na = not available
China’s “Water Agenda 21” XL Yang and JW Pang
366
www.frontiersinecology.org © The Ecological Society of America
As a result of the continuous increase in domestic and
industrial wastewater discharge and the insufficient sewage
treatment capacity, some of this wastewater is discharged,
untreated, directly into rivers, lakes, or the seas, causing
varying degrees of water pollution. Consequently, the
Central Government, focusing attention on urban con-
struction, introduced policies governing the urban environ-
ment and the development of infrastructure to regulate
urban floods and the water supply. These policies empha-
sized that any new plans for urban development must take
into consideration the capacity of the local water resources
and must include the construction or improvement of
municipal flood control measures. Regulations also covered
the water supply infrastructure, municipal water pollution
control, industrial wastewater treatment, and the compre-
hensive management of the urban environment (Qian et al.
2002). Beijing is a good example of this new approach being
put into practice; the city’s green riverbanks and clear lakes
contribute to the urban environment and preserve its
ancient culture (Figure 2).
Economic development and poverty alleviation
In 1992, more than 88 million people living in rural areas
of China did not have access to safe drinking water, with
most living in border regions or areas characterized by eth-
nic minority populations or extreme poverty. In such
areas, water shortages are often accompanied by soil ero-
sion and electricity shortages. Since 1992, there has been
some progress towards improving agricultural production
and living conditions in these regions; nevertheless, there
are still more than 24 million people without access to safe
drinking water and who have only limited access to elec-
tricity. To improve this situation, efforts have been made
to propel economic development in the affected areas
through water resource development. These include the
construction of drinking water treatment plants and the
provision of electricity to rural areas at the county level, as
well as soil and water conservation. Small and medium-
scale water projects in poorer areas have served to pro-
mote water resource development and poverty alleviation.
Increasing food supplies
About two-thirds of China’s population inhabit rural
areas. While the country has a large population, there is
relatively little farmland and few agricultural resources
per capita; moreover, Chinese farmers represent the
country’s lowest income group. In order to improve farm-
ers’ living standards and food production, central and
local governments have intensified the development of
irrigation and water conservation systems and the rural
infrastructure, and improved low and middle yield crop-
lands (Shen and Wang 2001). Figure 3 provides a view of
farmland in a coastal region of China, where the econ-
omy has improved and the focus has shifted from purely
agricultural to contributing to the national economy, and
from only stressing social benefits to considering all
aspects of social, economic, and environmental benefits.
The new strategy combines the development of farmland
irrigation systems with rural economic development,
rural road construction, and modernization of rural com-
munities.
Soil and water conservation
China has one of the most serious soil erosion problems in
the world. The affected area covers 3.67 million km
2
, rep-
resenting 38% of the country. About 1.79 million km
2
of
the affected area is the result of water erosion, while 1.88
million km
2
is due primarily to wind erosion. The Loess
Figure 2. The Beijing Municipal Government has strived to
comprehensively manage rivers and lakes in the city. After years
of effort, the goal of clear water, unobstructed flow, and green
banks has now begun to be realized.
Figure 3. Development of water resources has improved
agricultural production conditions and transformed farmland into
gardens. An integrated plan was introduced, encompassing
ditches, canals, farmland, forests, and roads. As a result, the
construction of garden-style farmlands has increased, and has
become an important basis for rural development. Other efforts
have focused on farmland standardization, ditch and canal
lining, road construction, and effective use of resources.
XL Yang and JW Pang China’s “Water Agenda 21”
367
© The Ecological Society of America www.frontiersinecology.org
Plateau, a large area of silty, erosion-
prone soil along the upper and middle
sections of the Yellow River, is subject
to serious soil erosion. This leads to loss
of usable land, flooding and drought,
and sandstorms. Water and soil erosion
are among the top environmental prob-
lems in China. Tackling them requires
strict land and water management
through improved policies and law
enforcement, better water and land use
planning, and the development and
implementation of water and soil ero-
sion monitoring systems (Shi and Lu
2001). Figure 4 illustrates an ecological
restoration project in Wuqi County,
Shaanxi Province, China.
Protecting ecosystems
Protection of water resources and the
aquatic environment has been given top
priority in the ecological restoration of
China. Some progress has been made,
including the formulation of water
resource protection plans, the implementation of monitor-
ing and alarm systems for water quantity and quality, the
protection of wetlands and other water sources, and the
strengthening of integrated management of water resources
(Qian et al. 2002). An example of a project to improve the
water quality of Taihu Lake is shown in Figure 5.
A long road ahead
It is encouraging to see that China has
taken its own practical approach to
solving some of its water-related prob-
lems and that progress, while limited,
has been made. However, there are still
many challenges to overcome. Badly
planned development and use of water
resources, wastefulness, and water pol-
lution continue to cause shortages.
Population growth, economic and
social development, urbanization, and
improvements in living standards will
lead to even greater demands for water,
and the Chinese people’s expectations
for water, in terms of both quantity and
quality, continue to rise. As China con-
tinues to modernize and develop its
economy, this will exacerbate the
imbalance between supply and demand,
making water resources the major
obstacle to realizing the strategy of sus-
tainable development. Much work is
still needed, particularly with regard to
integrated water resource management and private sector
involvement.
Water management in China is still plagued by frag-
mentation at both the local and central levels, and
within sectors (agriculture, environment, urban construc-
tion, etc). As a result, there is a multiplicity of public
agencies, with overlapping responsibilities for managing
Figure 4. An ecological restoration project in Wuqi County, Shaanxi Province. Wuqi
County is located in the northwest of China, and belongs to the transition zone of the
Loess Plateau, an area of rolling terrain and desert. Here, ecologically based agricultural
development has been introduced, characterized by intensive and self-supporting
agriculture and livestock farming.
Figure 5. The water quality of the Taihu Lake, with a surface area of 2338 km
2
and a
storage volume of 4.4 billion m
3
, has greatly improved since water was transferred to the
lake from the Yangtze River. With the development of the economy and the increase in
human activities, the eutrophication of Taihu Lake had become increasingly severe, while
water quality steadily deteriorated.
China’s “Water Agenda 21” XL Yang and JW Pang
368
www.frontiersinecology.org © The Ecological Society of America
water, leading to inefficiencies in the decision-making
process. The situation requires new institutional arrange-
ments supporting a holistic approach, uniting all stake-
holders in order to facilitate more efficient and effective
water management. This approach should be based
around watersheds rather than being influenced by polit-
ical or administrative boundaries, thereby encouraging
water-related agencies to coordinate their activities and
establish mutually agreed-upon priorities for investment,
regulation, and allocation.
Traditionally, water resource development and manage-
ment are financed by central or local governments in
China. This demands huge capital investment. On the
one hand, the need for capital has already become the
burden of various levels of government; on the other
hand, the economic strength of the private sector in
China has increased enormously in recent decades and
has been accompanied by rapid national economic
growth. These private companies are capable of, and have
expressed interest in, investing in and managing public
facilities. Public–private partnerships in the water sector
have begun to develop and should be encouraged through
the introduction of relevant rules and regulations.
References
An ZR. 1997. Hydraulic infrastructure and BOT. Beijing, China:
Water and Power Press.
Chen GL. 1997. Water resources development and economic policy.
Beijing, China: Water and Power Press.
GPRC (Government of the People’s Republic of China). 1994.
China’s Agenda 21. Beijing, China: China Environment Press.
Gu H (Ed). 1999. Fifty years of water resources development in new
China. Beijing, China: China Water and Power Press.
Hai River Commission. 1998. Outlines of the Hai and Luan water-
sheds planning. Beijing, China: China Water and Power Press.
Huai River Commission. 1998. Outlines of the Huai watershed plan-
ning. Beijing, China: China Water and Power Press.
Huang YR. 1997. Resettlement due to reservoir construction. Beijing,
China: China Water and Power Press.
Jiang DS. 1997. Soil and water erosion and control in Loess Plateau.
Beijing, China: China Water and Power Press.
Li AT. 1999. Sustainable water resources development for the Yangtze
watershed. Beijing, China: China Water and Power Press.
Li JS (Ed). 1999. Overall view of China’s rivers. Beijing, China:
China Water and Power Press.
Liu CM and Chen ZK (Eds). 2001. Present situation of water
resources and analysis of supply and demand trends in China.
Beijing, China: China Water and Power Press.
Liu CM and He XW. 1996. Strategies for sustainable water resources
development in China in the early 21st century. Beijing, China:
Beijing Science and Technology Press.
Liu J (Ed). 2002. Strategic study of natural resources utilization in
China. Beijing, China: China Agriculture Press.
MWR (Ministry of Water Resources). 1992. Water resources assess-
ment for China. Beijing, China: China Water and Power Press.
MWR (Ministry of Water Resources). 1998. China’s Water Agenda
21. Beijing, China: China Water and Power Press.
MWR (Ministry of Water Resources). 2002. China’s water bulletin.
Beijing, China: China Water and Power Press.
NBS (National Bureau of Statistics). 1992. China statistics yearbook
1992. Beijing, China: China Statistics Press.
NBS (National Bureau of Statistics). 2000. China statistics yearbook
2000. Beijing, China: China Statistics Press.
NIWA and IWHR (Nanjing Institute for Water Resources and
Hydrology and China Institute of Water Resources and
Hydropower Research). 1998. Water demand and supply in
China. Beijing, China: China Water and Power Press.
Pearl River Commission. 1998. Outlines of the water resources devel-
opment planning for the Pearl watershed. Beijing, China: China
Water and Power Press.
Qian Y, Liu CM, and Shao YS (Eds). 2002. Sustainable water
resources development for China’s cities. Beijing, China: China
Water and Power Press.
Qian ZY (Ed). 1994. Water resources development in China. Beijing,
China: China Water and Power Press.
Qian ZY and Zhang GD (Eds). 2001. Strategic study on sustainable
water resources development in China. Beijing, China: China
Water and Power Press.
SEPA (State Environment Protection Agency). 2005. Report on the
state of the environment in China 2004. Beijing, China: China
Environment Press.
Shen GF and Wang LX (Eds). 2001. Ecological construction and
water resources protection in China. Beijing, China: China
Water and Power Press.
Shi YL and Lu LS (Eds). 2001. Agricultural water demand versus
water-saving and high-efficiency type agriculture. Beijing, China:
China Water and Power Press.
Song and Liao Rivers Commission. 1998. Outlines of the water
resources development planning for Song and Liao Watersheds.
Beijing, China: China Water and Power Press.
Taihu Lake Management Bureau. 1998. Outlines of the water
resources development planning for Tai Lake basin. Beijing,
China: China Water and Power Press.
The State Council of GPRC. 1996. The Ninth Five-year Plan
(1996–2000) for national economic and social development and
long-range objectives through the year 2010. Beijing, China:
People’s Publishing House.
The State Council of GPRC. 2001. The Tenth Five-year Plan for
national economic and social development. Beijing, China:
People’s Publishing House.
Wang SC. 2002. Resources-oriented water management. Beijing,
China: China Water and Power Press.
Xu QQ and Dai DZ. 2002. Study on the countermeasures against
flooding in China. Beijing, China: China Water and Power Press.
Yangtze River Commission. 1998. Outlines of the water resources
development planning for the Yangtze watershed. Beijing, China:
China Water and Power Press.
Yellow River Commission. 1998. Outlines of the water resources
development planning for the Yellow watershed. Beijing, China:
China Water and Power Press.
Zhang HL. 1997. Floods and droughts in China. Beijing, China:
China Water and Power Press.
1
College of Environmental Sciences, Peking University, China;
();
2
Ministry of Water Resources, China
G
lobal biodiversity is decreasing at an unprecedented
rate, in parallel with the rapid growth of the human
population (DeFries et al. 2004). Among ecosystems that
support high biodiversity, wetlands occupy only about 1%
of the Earth’s surface, but provide habitat for about 20% of
the world’s species (Dugan 1993), especially endangered
and endemic species. For example, approximately 50% of
the endangered bird species in China inhabit wetland
ecosystems (Wetland International [China] 1998). How-
ever, these biologically rich ecosystems have undergone
dramatic reductions. The ecological consequences of these
changes to wetlands, and the resulting loss of biodiversity,
have elicited considerable concern (Gibbs 2000).
The Central Yangtze refers to the section of the Yangtze
River Basin that extends from Yichang in Hubei province
to Hukou in Jiangxi province (Figure 1), and includes a
number of ecologically and economically valuable lakes and
wetlands. Dongting Lake, Poyang Lake, and the lakes in the
Jianghan Plain and Anqing region, together with the
Yangtze River and its tributaries, provide important habitats
for aquatic animals and plants. This area is also an impor-
tant stopover and breeding ground for birds migrating
through Eurasia (Kanai et al. 2002). More than 300 species
of waterfowl, about 200 fish species, and approximately
95% of the world’s wintering Siberian crane (Grus leucoger-
anus) depend on these wetlands (Wu and Ji 2002). It is also
an important habitat for the endangered Baiji (or Chinese
river) dolphin (Lipotes vexillifer), a freshwater cetacean that
inhabits the Yangtze River. Because of its many vital eco-
logical functions and unique biodiversity, the Central
Yangtze has been designated by WWF as one of the Global
369
© The Ecological Society of America www.frontiersinecology.org
REVIEWS REVIEWS REVIEWS
Biodiversity changes in the lakes of the
Central Yangtze
Jingyun Fang
1*
, Zhiheng Wang
1
, Shuqing Zhao
1
, Yongke Li
1
, Zhiyao Tang
1
, Dan Yu
2
, Leyi Ni
3
, Huanzhang Liu
3
,
Ping Xie
3
, Liangjun Da
4
, Zhongqiang Li
2
, and Chengyang Zheng
1
The Central Yangtze ecoregion in China includes a number of lakes, but these have been greatly affected by
human activities over the past several decades, resulting in severe loss of biodiversity. In this paper, we docu-
ment the present distribution of the major lakes and the changes in size that have taken place over the past 50
years, using remote sensing data and historical observations of land cover in the region. We also provide an
overview of the changes in species richness, community composition, population size and age structure, and
individual body size of aquatic plants, fishes, and waterfowl in these lakes. The overall species richness of
aquatic plants found in eight major lakes has decreased substantially during the study period. Community
composition has also been greatly altered, as have population size and age and individual body size in some
species. These changes are largely attributed to the integrated effects of lake degradation, the construction of
large hydroelectric dams, the establishment of nature reserves, and lake restoration practices.
Front Ecol Environ 2006; 4(7): 369–377
In a nutshell:
• The large collection of lakes in the Central Yangtze region of
China has decreased substantially in size and number over the
past 50 years
• An increasing human population, greater food production,
and overfishing are the major causes of lake degradation
• Biodiversity losses have also been observed among aquatic
plants, fish, and waterfowl, at community, population, and
species levels
• Lake degradation, the construction of large dams, the estab-
lishment of nature reserves, and lake restoration practices are
the primary forces driving these changes in biodiversity
Authors’ contact details are on p377
200 priority ecoregions for conservation (Olson and
Dinerstein 1998).
Nevertheless, intensive land reclamation over the past
several decades has replaced floodplains and lakes with
agricultural areas and urban settlements. For example, in
the 1930s, the surface area of Dongting Lake covered 4955
km
2
, but had decreased to ~2500 km
2
by the late 1990s,
and the lake was divided into three sublakes (East, West,
and South Dongting Lake; Zhao et al. 2005). In the 1950s,
there were 414 lakes with surface areas greater than 1 km
2
in the Jianghan Plain, but by 1998 this number had fallen
to 258 (Fang et al. 2005). Wetland degradation has resulted
in serious negative ecological consequences, including
increased flooding, a decline of biodiversity, and extinction
of a number of endemic species (Zhao et al. 2005).
Several studies have documented the changes in aquatic
biodiversity patterns and community structures in various
rivers and lakes in the Central Yangtze at different periods
since the 1950s (eg Fu et al. 2003); however, an integrated
analysis on the status of biodiversity changes is not yet
available. Here, we review biodiversity changes at the com-
munity, population, and species level for aquatic plants,
fish, and waterfowl in the Central Yangtze. The objectives
of this review are to: (1) provide basic information on the
changes in the lakes over the past 50 years using historical
land cover information and remote sensing data; (2) review
the changes in biodiversity based on analyses found in the
Biodiversity in the Central Yangtze JY Fang et al.
literature; and (3) summarize major
factors that have led to the changes in
biodiversity.
Although our review focuses on a
period beginning in the 1950s, some
of the biodiversity data were avail-
able only from the 1960s, as a result
of changes in China’s policy on
restriction of information and inves-
tigation methods during that period.
In addition, we did not perform sta-
tistical analyses on some aspects of
biodiversity changes because of
insufficient data. The data sources
used in this review were gathered
from different publications and
reports and are listed in WebTable 1.
Changes in lake size
In order to understand the effects of
the changes in lake size on biodiver-
sity, we documented the current dis-
tribution of lakes in the Central
Yangtze, using Landsat Thematic
Mapper (TM) remote sensing data
(Figure 1). Figure 1 was generated
from eight non-cloudy Landsat TM
images in the dry season of 1998
(mostly from October to December).
The satellite images were classified into six land-cover
types (settlement, cropland, shrub, forest, water body, and
barren land) on the basis of the multispectral classification
algorithm (maximum likelihood), using Erdas Imagine
8.4. Only data on water body type was exported to
ArcView GIS software for data analysis (Zhao et al. 2005).
Figure 2 illustrates changes in water surface area (lake
size) for some of the major lakes in the study area between
the 1950s and the late 1990s. Information on the size of the
lakes in the late 1990s was taken from Figure 1, and data for
the 1950s was obtained from land-cover maps made during
that period (scale of 1:200 000). For further details on the
data and on data processing, see Fang et al. (2005).
The results showed that the surface area of most of the
lakes shrank dramatically in the late 1990s, as compared to
the 1950s: 31 of 33 lakes experienced a marked decline in
size, while only two (Changhu Lake and Huamahu Lake)
showed an increase (Figure 2). The term “changing rate of
lake size” was used to evaluate the magnitude of lake degra-
dation, and was obtained by dividing the difference in lake
size in the 1990s and in the 1950s by the lake size in the
1950s. This revealed that 14 lakes had decreased in size by
50–100%, another 10 lakes had been reduced by 25–50%,
and a further seven by 0–25% (Figure 2 inset).
These reductions in surface area were mainly the result
of the practice of impoldering (a type of land reclamation
that encroaches on lakes and their associated wetlands for
370
www.frontiersinecology.org © The Ecological Society of America
Figure 1. Distribution of lakes in the Central Yangtze region in 1998, produced from eight
non-cloudy Landsat Thermatic Mapper (TM) images in the dry season of 1998 (~October
to December). Numbers 1 to 33 represent major lakes, where detailed information on lake
size (water surface area) was documented in the 1950s and the late 1990s (most for the year
of 1998). 1. Dongtinghu (Dongting Lake); 2. Datonghu; 3. Niulanghu; 4. Guhu; 5.
Changhu; 6. Honghu; 7. Paihu; 8. Laoguanhu; 9. Diaochahu; 10. Futouhu; 11. Luhu;
12. Guanlianhu; 13. Wangmuhu; 14. Qinglinghu; 15. Huangjiahu; 16. Nanhu; 17.
Donghu; 18. Beihu; 19. Wuhu; 20. Liangzihu; 21. Yaerhu; 22. Zhangduhu; 23.
Huamahu; 24. Dayehu; 25. Wanghu; 26. Taibaihu; 27. Longganhu; 28. Huangdahu;
29. Pohu; 30. Wuchanghu; 31. Poyanghu; 32. Banghu; and 33. Dahuchi.
111˚E
114˚E
30˚N
30˚N
111˚E
114˚E 117˚E
Three Gorges Dam
Wuhan
Changsha
Nanchang
1
2
3
4
5
6
7
8
9
10
11
12
13
14
15
16
17
18
19
20
21
22
23
24
25
26
27
28
30
31
29
32
33
JY Fang et al. Biodiversity in the Central Yangtze
agricultural purposes, through the
construction of dikes and drainage
structures; Zhao et al. 2005). Natural
processes, such as sedimentation and
interannual changes in climate may
also cause reductions in lake surface
area (Du et al. 2001), but the contri-
bution of natural silt deposition to the
decrease in water surface of Dongting
Lake, the second largest lake in the
region, was estimated as < 7% over
the past 70 years (Zhao et al. 2005).
According to Fang et al. (2005), varia-
tions in annual rainfall were also not
a major factor in the size decreases of
lakes in the Jianghan Plain area.
Changes in biodiversity
Aquatic vascular plants
Over the course of many decades, the
number of aquatic vascular species has
tended to decrease in six of the eight
major lakes in which species were well
documented (Figure 3). This was
mainly due to loss of certain species which are sensitive to
environmental pollution and other habitat changes. For
example, at Donghu Lake, formerly dominant species, such
as sago pondweeds (Potamogeton maackianus and Potamoge-
ton cristatus), Indian fern (Ceratopteris thalictroides), duck
lettuce (Ottelia alismoides), ivy leaf duckweed (Lemna
trisulca), Eriocaulon buergerianum, water celery (Oenanthe
javanica), Asian marshweed (Limnophila sessiliflora), and
dwarf bladderwort (Utricularia exoleta), have mostly disap-
peared since the 1970s, primarily as a result of increasing
pollution (Liu 1995; Yu 1995). Eight plant species have
disappeared from Honghu Lake during the past 50 years
(Peng et al. 2004). At Liangzi Lake, which suffers less
human disturbance, plant richness did not show any signi-
ficant change and has fluctuated between 87 and 92
species over the past 30 years, while the number of species
at Poyang Lake (the largest lake in this area) has tended to
increase since the 1980s, most likely due to the establish-
ment in 1983 of the Poyang Lake National Nature Reserve
(Poyang Lake National Nature Reserve 1993).
In order to look for an overall trend in the changes to
plant species in these lakes, we standardized species rich-
ness data for each decade and for each lake by defining
the data in the 1990s as a baseline (100), and obtained
relative species richness for each decade and for each lake
through the calculation
(100/N
1990
)xN
i
where N
1990
is a lake’s species richness in the 1990s and N
i
represents the species richness for a particular decade.
(The level of species richness of the 1990s was used as the
basis for this standardization because richness data for
that decade was available for all eight lakes.) We then
averaged the values of the relative species richness of all
the lakes for each decade, and obtained an overall trend
of species richness change from the 1960s to the 2000s.
The results suggested a significant decrease (r
2
= 0.93,
P = 0.007) in species richness for these eight lakes during
the study period (Figure 3 inset).
Not only did the number of species change, but so to
was species composition within aquatic plant communi-
ties altered (Table 1). The dominant aquatic vegetation
species at Donghu Lake were common reeds (Phragmites
communis), wild rice (Zizania latifolia), and sago
pondweed (P maackianus) in the 1950s (Zhou et al. 1963),
but these were replaced by P maackianus, holly-leaved
naiad (Najas marina), and Hydrilla verticillata in the 1960s
(Chen and He 1975). P maackianus disappeared during
the 1970s–1980s, and N marina became predominant
(Yao et al. 1990). Submersed plants, such as N marina,
spiked water-milfoil (Myriophyllum spicatum), and
American eelgrass (Vallisneria spiralis), were dominant in
the 1990s (Yan et al. 1997), but were supplanted by emer-
gent plants such as bulrushes (Typha orientalis) and Indian
lotus (Nelumbo nucifera) by 2001 (Wu et al. 2003).
The dominant species at Honghu Lake in the 1960s
included floating-leaved plants such as water chestnut
(Trapa bispinosa) and submersed ones such as P malaianus,
V spiralis, and H verticillata), but these were replaced by
other submersed plants (P maackianus, M spicatum, and
Ceratophyllum demersum) and emergent plants (Hydrilla
371
© The Ecological Society of America www.frontiersinecology.org
Figure 2. Comparison of the surface area of 33 major lakes in the Central Yangtze
region between the 1950s and the late 1990s. Lake sizes were much smaller in the late
1990s than in the 1950s for most lakes. Among the 33 major lakes, the size of 14 lakes
decreased by 50–100%, that of 10 lakes by 25–50%, and of seven lakes by 0–25%.
Only two lakes (Changhu and Huamahu) increased due to aquaculture (inset). The
numbers 1–33 represent major lakes and correspond to those listed in Figure 1.
1 10 100 1000 10 000
Lake area in 1950s (km
2
)
Lake area in 1990s (km
2
)
10 000
1000
100
10
1
Biodiversity in the Central Yangtze JY Fang et al.
and Zizania latifolia) in the 1980s (Li 1982). By the 1990s,
they were further replaced by submersed plants, such as
P maackianus, and hornwort (C demersum; Li 1997).
The dominant species of aquatic vegetation at Liangzi
Lake also underwent major changes.
The original vegetation consisted
primarily of V spiralis, H verticillata,
N marina, and brittle naiad (Najas
minor) in the 1950s, but had changed
to P malaianus, P maackianus, Pota-
mogeton crispus, and C demersum by
the 1980s (Jin 1992). In the 1990s,
areas covered by P malaianus were
greatly reduced and largely replaced
by P maackianus (Jin 1999).
Fish
During the study period, substantial
changes were also seen in fish diversity
at community, population, and species
levels (Figure 4). The species richness
of fishes in Donghu, Honghu, and
Liangzi lakes has tended to decline
since the 1960s (Figure 4a). In Donghu
Lake in the 1960s, for example, there
were 67 species of fish, but this number had fallen to 38 by the
1990s; nearly half the fish had disappeared, including some
rare species, such as Reeve’s shad (Tenualosa reevesi), Chinese
banded shark (Myxocyprinus asiaticus), the Yangtze grenadier
anchovy (Coilia brachyg-
nathus), and bream (Megalo-
brama skolkovii; Fang 1991;
Huang et al. 1995). The num-
ber of fish species in Honghu
Lake declined from 74 in the
1960s to 57 in the 1990s
(Chang et al. 1995; Song et al.
1999). Similarly, fish species
in Liangzi Lake dropped from
75 in the 1970s to 54 in the
1980s.
An important characteristic
of the changes in fish species
composition is that the pro-
portion of migratory and semi-
migrant species decreased,
while that of resident species
increased in the fishing yield.
Most importantly, the per-
centage of typical migrant
species, such as Chinese stur-
geon (Acipenser sinensis),
Yangtze sturgeon (Acipenser
dabryanus), Tenualosa reevesi,
Japanese eel (Anguilla japon-
ica), and Myxocyprinus asiati-
cus, declined dramatically,
and some have not been
observed at all in recent years
(Qiu et al. 1998; Yi et al. 1999;
372
www.frontiersinecology.org © The Ecological Society of America
Figure 3. Changes in species richness of aquatic vascular plants in eight large lakes in the
Central Yangtze. The inset figure illustrates averaged relative species richness of all the
lakes for each decade; they show a significant decrease (r
2
= 0.93, P= 0.007) over the
study period. (See text for inset details.)
Table 1. Dominant species of aquatic vegetation in Central Yangtze lakes at different
periods
Periods Donghu Lake Honghu Lake Liangzihu Lake
1950s Phragmites communis, Vallisneria spiralis,
Zizania latifolia, Hydrilla verticillata,
Potamogeton maackianus, and Najas marina, and
Azollaim imbricate Najas minor
1960s Potamogeton maackianus, Trapa bispinosa,
Najas marina, Hydrilla verticillata, Potamogeton malaianus,
Myriophyllum spicatum, and Vallisneria spiralis, and
Ceratophyllum demersum Hydrilla verticillata
1970s Najas marina
1980s Najas marina Potamogeton Potamogeton malaianus,
maackianus, Potamogeton
Myriophyllum spicatum, maackianus,
Zizania latifolia, and Potamogeton crispus, and
Ceratophyllum demersum Ceratophyllum demersum
1990s Najas marina, Potamogeton Potamogeton malaianus,
Myriophyllum spicatum, maackianus, Potamogeton maackianus,
and Vallisneria spiralis Myriophyllum spicatum, and Trapa quadrispinosa
and Ceratophyllum
demersum
Present Typha orientalis and Potamogeton maackianus,
Nelumbo nucifera Ceratophyllum demersum,
Myriophyllum spicatum,
and Vallisneria spiralis
References: Zhou et al. 1963; Chen 1975, 1980; Li 1982; Yao et al. 1990; Jin 1992, 1999; Wang et al. 1994; Li 1997; Yan et al.
1997; Wu et al. 2003
JY Fang et al. Biodiversity in the Central Yangtze
Zhang et al. 2000). At Dongting Lake, the yield of four carps
(well-known migrant and semi-migrant species in China) –
black carp (Mylopharyn-godon piceus), grass carp
(Ctenopharyngodon idellus), silver carp (Hypophthalmichthys
molitrix), and bighead carp (Aristichthys nobilis) – declined
steadily from 21% of the total fishing yield in 1963 to
14.1% in 1981, and to 9.3% in 1999. At the same time, the
yield of resident fish species, such as common carp
(Cyprinus carpio), goldfish (Carassius auratus), and catfish
(Silurus asotus), have increased from 63% in the 1960s to
86.1% in 1999 (Liao et al. 2002). At Honghu Lake, the
yield of semi-migrant species represented approximately
50% of the total yield in the 1950s, but fell to only 0.5% in
the 1980s (Chang et al. 1995; Song et al. 1999). The great-
est changes seen in these fish populations have been in
body size and age structure of some species. For example,
for T reevesii, a very important migrant fish in the Yangtze
River, fishing yield statistics showed that in 1962, 2–3-
year-old individuals represented only 31% in weight of the
total yield of this species, while the remainder was com-
posed of older fishes (4–7 years old). However, in 1986, the
percentage of 2–3-year-old fish increased to 92%, while no
individuals of 5 years or older were seen at all (Figure 4b).
In addition to this decrease in numbers of older fish, mean
individual size (weight per individual) also decreased
greatly; in 1962, the majority caught weighed 1–2 kg
(63%), with a very small number of < 1.0 kg (1%), while in
1986 individuals of < 1.0 kg made up 41% of the total
yield, and there were no individuals > 3.0kg (Qiu et al.
1998; Figure 4c).
Waterfowl
Lakes in the Central Yangtze region are important stopover
and breeding sites for migrant birds in Eurasia (Kanai et al.
2002). Figure 5 shows the changes seen in the waterfowl
species at Honghu Lake, Dongting Lake, and Chenhu Lake,
where interannual changes in bird populations have been
well documented. Wintering waterfowl at Honghu Lake
decreased from 36 species in the 1960s to 28 species in the
1990s (Figure 5a). Of these, geese and duck species
(Anatidae) declined from 25 to 20 (Figure 5b), while in
Chenhu Lake 9 species disappeared between the 1980s and
the 1990s (Figure 5a). Geese and ducks at Dongting Lake
declined from 31 species at the end of the 1950s to 20
species in 1991–92, and then increased again, to 28 in the
period 2000–02 (Figure 5b; Zhao 2002). The increase seen
over the past 10 years was most likely due to the establish-
ment of the East Dongting Lake nature reserve in 1992
(Zhao 2002). However, seven rare species, including red-
breasted geese (Branta ruficollis), whooper swans (Cygnus
cygnus), and lesser whistling ducks (Dendrocygna javanica),
which were present in 1963, were not observed in 2000–02.
Instead, four new bird species appeared: snow geese (Anser
caerulescens), pochard (Aythya ferina), scaup (Aythya mar-
ila), and goldeneye ducks (Bucephala clangula) (Zhao 2002).
The changes in waterfowl populations in the Central
Yangtze lakes are clearly seen in the variations in popu-
lations of Siberian cranes (Grus leucogeranus) at Poyang
Lake and the lesser white-fronted goose (Anser erythro-
pus) at Dongting Lake (Figure 6). These were chosen as
representative species for these two lakes, respectively,
because approximately 95% of the critically endangered
Siberian crane winter at Poyang Lake (Meine and
Archibald 1996) and about half of the world population
of the globally threatened lesser white-fronted geese
winter at Dongting Lake (Lei 2000). Furthermore, rela-
tively long-term monitoring data on waterfowl is avail-
able for these two lakes.
The population of Siberian cranes at Poyang Lake
increased steadily from 730 in the wintering period of
373
© The Ecological Society of America www.frontiersinecology.org
Figure 4. Changes in species richness and population structures of
fish in some lakes in the Central Yangtze. (a) Changes in species
richness in three large lakes (Donghu, Honghu, and Liangzi). (b)
Frequency distribution of mean age of T reevesii. (c) Frequency
distribution of mean individual size (weights) of T reevesii.
Size (kg)
Biodiversity in the Central Yangtze JY Fang et al.
1983–84 to 2653 during 1988–89, and then remained rel-
atively constant from 1989 to 1995, after which the pop-
ulation began to decrease. The much smaller numbers for
the wintering periods of 1992–93 (725 individuals),
1997–98 (960) and 1998–99 (762) (Figure 6a) were prob-
ably caused by flooding in these years (Zhao 2002).
At Dongting Lake, the population of lesser white-
fronted geese increased between the wintering period of
1992–93 and 2001–02 (P = 0.057), and peaked in
1998–99, with a total of 16500 (Figure 6b). The total
extant population of white-fronted geese is estimated to be
around 25 000–30 000 individuals (Lorentsen et al. 1999).
Baiji dolphin
The Baiji dolphin, also known as the Chinese river dol-
phin, is endemic to the Yangtze River, and is considered to
be a “living fossil” whose evolutionary history can be traced
back more than 20 million years. However, its numbers
have declined rapidly over the past several decades (Liu et
al. 1996). Historically, it was often observed in the Yangtze
River and in Poyang and Dongting lakes. However, popu-
lation size fell sharply over the past 50 years or so, from
6000 in the 1950s to 400 in 1984, then to 60 in 1998. Most
strikingly, it has not been observed at Poyang Lake and
Dongting Lake since 1978, suggesting that it may now be
locally extinct (Yang et al. 2000).
Major factors affecting biodiversity changes
Land-use and land-cover change
Land-use and land-cover change affects habitat availability
and consequently leads to alterations in biodiversity
(DeFries et al. 2004). Over the past 50 years, the Central
Yangtze region has experienced extensive land-use and
land-cover changes. For example, impoldering land recla-
mation through drainage techniques in this region resulted
in a decline in biodiversity and even extinction of some
endemic species (Zhao et al. 2005). Increased levels of
impoldering have caused a substantial loss of spawning areas
for the common carp at Poyang Lake, from 5.2 x 10
4
ha in
1961 to 2.6 x 10
4
ha in 1984, thereby greatly decreasing
population size (Zhang 1988). Urbanization has rapidly
encroached on most wild habitats, including forests and
lake areas, leading to declines in lake size, deterioration of
water and air quality, and loss of biodiversity (Li et al. 2006).
Environmental pollution
Environmental pollution is one of the principal threats to
biodiversity in the Central Yangtze region (Xie and Chen
1999). The strategy used to stop the expansion of schisto-
somiasis in the Yangtze River essentially comprised the
mass release of chemicals between 1955 and the 1980s
designed to control the vectors of the disease, and while
successful, this approach led to a serious deterioration in
water quality and severely impacted biodiversity (Yuan et
al. 2002). For example, at Poyang Lake, waterfowl num-
bers fell sharply between 1971 and 1978, when the schis-
tosomiasis control program was being implemented
(Poyang Lake National Nature Reserve 1993).
Donghu Lake, a shallow urban lake, was classified as
mesotrophic (narrow range of nutrients and intermediate
in water quality) in the 1950s, but deteriorated to become
hypereutrophic (nutrient-rich, characterized by major
algal blooms and poor water quality) by the 1980s, due to
accelerated levels of eutrophication. Consequently, phyto-
plankton proliferated rapidly, greatly reducing light pene-
tration through the water column. This is one of the major
reasons why aquatic vascular vegetation, particularly sub-
mersed macrophytes, declined or disappeared altogether
(Yan et al. 1997; Wu et al. 2003).
Noise pollution can also be classified as a form of environ-
mental pollution. Intensive shipping noise has greatly disturbed
the growth and development of the Baiji dolphin, and may be a
factor in the decline of its population size (Hua et al. 1995).
Overexploitation
The increasing amount of aquaculture being carried out
in the Central Yangtze floodplain has also had serious
374
www.frontiersinecology.org © The Ecological Society of America
Figure 5. Changes in species richness of (a) overwintering
waterfowl and (b) Anatidae (geese and ducks) in three lakes
(Honghu, Dongting, and Chenhu) in the Central Yangtze.
JY Fang et al. Biodiversity in the Central Yangtze
negative effects on biodiversity. Peng et al. (2004) argued
that fish being bred in Honghu Lake grazed on aquatic
vegetation, especially submersed macrophytes, thereby
decreasing aquatic vascular plants and vegetation cover-
age. At Donghu Lake, the loss of P maackianus, a domi-
nant submersed vascular plant, was closely associated
with overstocking of grass carp (C idellus; Chen 1980).
Overexploitation of fish resources is another major cause
of the dramatic fall in the number of wild fish species in
most lakes in this area. The use of certain fishing tech-
niques, such as dense-aperture nets, bombing, poisoning,
and electric shocks, has severely affected breeding and
regeneration of fish species in some lakes (Zhang 1988).
Large hydroelectric projects
Large dams cause habitat loss, alter the reproductive
environments of some species, and block migration
routes, leading to a substantial decline in biodiversity
(Stanley and Doyle 2003; Wu et al. 2004). The construc-
tion of the Gezhou Dam in the upper-Central Yangtze
River in 1981 led to a sharp decline in the populations of
three endangered and endemic ancient fish species,
Chinese sturgeon (A sinensis), Yangtze sturgeon (A
dabryanus), and Chinese paddlefish (Psephurus gladius),
which are being prevented from reaching their tradi-
tional spawning areas in the Jinsha River (in the upper
reaches of the Yangtze River) by the dam (Wei et al.
1997). The ongoing Three Gorges Dam Project, the
largest hydroelectric dam in the world (38 km upstream
from Gezhou Dam), will have catastrophic consequence
for fish, most especially to the migrant species in the mid-
dle and lower reaches of Yangtze River, by damaging the
new spawning sites already formed below and above the
Gezhou Dam and completely blocking the upstream
migration routes of fish (Xie 2003). These large dams
impact not only fish, but many other aquatic and terres-
trial species as well (Wu et al. 2004).
The Central Yangtze is characterized by an intercon-
nected network of water systems, including the river and its
tributaries, and a large number of shallow lakes. The dams
and dikes built to control flooding from the early 1950s
through to the end of the 1970s caused almost all of the
shallow lakes to become separated from the Yangtze River;
only Poyang Lake and Dongting Lake remain connected.
The separation of the lakes from the river and its tributaries
has cut off the traditional migratory route of many fish and
restricts the species exchange between the lakes and the
river, which is another cause of the decline in fish species in
the lakes (Huang et al. 1995; Song et al. 1999).
Establishment of nature reserves and lake
restoration projects
The implementation of China’s sustainable development
strategy and a growing awareness of environmental pro-
tection and biodiversity conservation in the Central
Yangtze, a biodiversity hotspot, have raised considerable
concern. Mostly within the past 20 years, 16 national and
local nature reserves have been established in this area
and are playing an important role in protecting biodiver-
sity (Fang et al. 2006). For example, since the establish-
ment of the nature reserves, Poyang Lake and East
Dongting Lake have become the most important over-
wintering sites for the Siberian crane and lesser white-
fronted goose, respectively (Figure 6).
Historically, impoldering was carried out in the
Central Yangtze to support a growing human population,
and instances of this land reclamation practice increased
from the early 1950s to the late 1970s (Shi 1989). The
negative impacts, together with a growing awareness of
the importance of wetlands, have lead to the establish-
ment of policies to protect and restore lakes and associ-
ated wetlands. The Chinese government enacted a pol-
icy to prohibit impoldering from the end of the 1970s.
Local people have allowed some inundated lands to be
rejoined to the original lakes because they are unwilling
to repair breached dikes (Wang 1998). After unprece-
dented flooding in 1998, the Chinese government
implemented a lake restoration project in the Central
Yangtze floodplain, which reversed the impoldering and
controlled degradation of the lakes to some degree. For
example, the area covered by Honghu Lake, the largest
lake in the Jianghan Plain, increased in size between
1987 and 1998 (Zhao et al. 2003).
375
© The Ecological Society of America www.frontiersinecology.org
Figure 6. Changes in population size of two waterbirds: (a)
Siberian crane (Grus leucogeranus) from 1983 to 2001 at
Poyang Lake, and (b) lesser white-fronted goose (Anser
erythropus) from 1992 to 2002 at Dongting Lake.
18 000
15 000
12 000
9000
6000
3000
0
3000
2000
1000
0
Biodiversity in the Central Yangtze JY Fang et al.
Conclusions
Substantial changes have been observed in aquatic
biodiversity in most of the Central Yangtze lakes.
These changes are the result of the impacts of three
kinds of human-induced activities, as illustrated in
Figure 7: (1) lake degradation (eg loss of wetlands,
water pollution and eutrophication, and overfishing),
caused by a growing human population and increased
food production; (2) the construction of large hydro-
electric projects, primarily aiming at exploiting water
resources for power generation; and (3) the establish-
ment of nature reserves and lake restoration practices
to restore habitats for plants and animals. Natural
processes (such as lake sedimentation and climate
change) are also factors for the changes in lake struc-
ture and biodiversity in this region, but these were not
included here because their influences are likely much
smaller than those induced by rapid, intensive human
disturbances (Zhao et al. 2005).
As stated above and shown in Figure 7, lake degrada-
tion and the construction of large dams have led to a sub-
stantial decrease in species richness within inhabitant
plant and animal communities, as well as changes in pop-
ulation size, age structure, and individual size of fish
species. On the other hand, the establishment of a num-
ber of nature reserves and lake restoration projects since
the late 1980s and early 1990s has
restored habitats and biodiversity to
some degree. One example of this is
seen in the increase in the numbers
of overwintering waterfowl at some
lakes (Figure 6). A concerted effort
by ecologists, hydrologists, policy
makers, and local residents will be
required to minimize negative
human impacts, maximize the effec-
tiveness of nature reserves and lake
restoration, and to protect and ulti-
mately restore the wetland biodiver-
sity of this area.
Acknowledgments
This paper was partly a production of
the Workshop on Large-scale
Biodiversity Patterns in the Yangtze
River Basin held in Wuhan
University–Liangzi Lake Ecology
Station in November 2004. This
study was funded by the State Key
Basic Research and Development
Plan (#G20000468), the National
Natural Science Foundation of
China (#40024101 and 40571150),
Peking University, and Wuhan
University.
References
Chang JB. 1995. Fish and fisheries. In: Chen YY and Xu YX (Eds).
Hydrobiology and resources exploitation in Honghu Lake.
Beijing, China: Science Press.
Chen HD and He CH. 1975. Standing crop of the macrophytes of
Lake Donghu, Wuchang, with reference to the problem of its
rational piscicultural utilization. Acta Hydrob Sin 5: 410–19.
Chen HD. 1980. Structure and dynamics of macrophyte communi-
ties in Lake Donghu, Wuhan. Ocean Limnol Sin 11: 275–83.
DeFries R, Foley J, and Asner G. 2004. Land-use choices: balancing
human needs and ecosystem function. Front Ecol Environ 2:
249–57.
Du Y, Cai SM, Zhang XY, and Zhao Y. 2001. Interpretation of the
environmental change of Dongting Lake, middle reach of
Yangtze River, China, by Pb-210 measurement and satellite
image analysis. Geomorphology 41: 171–81.
Dugan P. 1993. Wetlands in danger: a world conservation atlas. New
York, NY: Oxford University Press.
Fang JY, Rao S, and Zhao SQ. 2005. Human-induced long-term
changes in the lakes of the Jianghan Plain, Central Yangtze.
Front Ecol Environ 3: 186–92.
Fang JY, Zhao SQ, Tang ZY et al. 2006. Ecological basis of regional
biodiversity conservation of wetlands in the Central Yangtze.
Beijing, China: Higher Education Press.
Fang RL. 1991. Fishes in Donghe Lake, Wuhan. In: Wuhan branch
of Chinese Academy of China. Paper collections on resources,
ecology, environment and economic development of the Yangtze
River Basin. Beijing, PR China: Science Press.
Fu CZ, Wu JH, Chen JK, et al. 2003. Freshwater fish biodiversity in
the Yangtze River basin of China: patterns, threats and conserva-
tion. Biodivers Conserv 12: 1649–85.
376
www.frontiersinecology.org © The Ecological Society of America
Figure 7. Biodiversity changes and their relationship with human impacts in the Central
Yangtze lakes. Increases in human population result in land-use and land-cover changes and
environmental pollution, which lead to degradation of lakes (eg loss of wetlands, water
pollution and eutrophication, and overfishing). These, together with the construction of large
hydroelectric dams, establishment of nature reserves, and lake restoration practices, are the
major causes of changes in aquatic biodiversity in the Central Yangtze. Such human-induced
biodiversity changes take place at multiple levels (species richness, community composition,
population size and age structure, and individual body size).
Fishery
Eutrophication
Toxic pollution
Noise
Nature reserves
and restoration
practices
JY Fang et al. Biodiversity in the Central Yangtze
Gibbs JP. 2000. Wetland loss and biodiversity conservation. Conserv
Biol 14: 314–17
Hua YY, Zhang J, Zhang X, and Xu XM. 1995. Research on the sta-
tus quo and endangering factors of Baiji, Lipotes vexillifer, and the
strategy for its protection. Resour Environ Yangtze Valeyl 4: 45–51.
Huang GT, Xie P, and Liu HQ. 1995. Changes of fish fauna and
analysis of fish yield in the Donghu Lake. In: Liu JK (Ed).
Ecological studies in Donghu Lake (II). Beijing, China: Science
Press.
Jin BX (Ed). 1992. Comprehensive studies on Jianghan Lakes.
Wuhan, China: Hubei Science and Technology Press.
Jin G 1999. State of submersed vegetation resources in Lake Liangzi,
Lake Niushan, and Lake Bao’an. Acta Hydrobiol Sin 23: 87–89.
Kanai Y, Ueta M, Germogenov N, et al. 2002. Migration routes and
important resting areas of Siberian cranes (Grus leucogeranus)
between northeastern Siberia and China as revealed by satellite
tracking. Biol Conserv 106: 339–46.
Lei G. 2000. Status of the lesser white-fronted goose in China. In:
Tolvanen P, Øien IJ, and Ruokolainen K (Eds). Fennoscandian
lesser white-fronted goose conservation project. Annual report
1999. Helsinki, Finland: WWF Suomi and Norwegian
Ornithological Society. WWF Suomi Report No 12 and NOF
Rapportserie Report No 1-2000.
Li W. 1997. Flora studies on aquatic vascular plants in Lake Honghu.
J Wuhan Bot Res 15: 113–22.
Li XC. 1982. Aquatic vascular plants in Honghu Lake. In:
Investigation Group of Aquatic Resources in Honghu Lake (Ed).
Aquatic resources in Honghu Lake 2: 37–51.
Li Y, Zhao SQ, Zhao K, et al. 2006. Land-cover changes in an urban
lake watershed in a mega-city, Central China. Environ Monit
Assess DOI: 10.1007/s10661-006-6559-z.
Liao FC, He W, Huang XR, et al. 2002. Studies on the present situa-
tion and changing trend of Dongting Lake fishery resources and
environment. Acta Hydrob Sin 26: 623–27.
Liu JK. 1995. Lakes of the middle and lower basins of the Changjiang
River with special reference to their fishery utilization. In: Liu JK
(Ed). Ecological studies on Donghu Lake (II). Beijing, China:
Science Press.
Liu RJ, Zhang XF, Wang D, and Yang J. 1996. Once again studies on
the conservation of Lipotes vexillifer and Neophocaena pho-
caenoides. Res Environ Yangtze Basin 5: 220–225.
Lorentsen SH, Øien IJ, Aarvak T, et al. 1999. Lesser white-fronted
goose Anser erythropus. In: Madsen J, Fox T, and Cracknell J
(Eds). Goose populations of the Western Palearctic. A review of
status and distribution. Rønde, Denmark: Wetlands
International, National Environmental Research Institute.
Wetlands International Publication No 48.
Meine CD and Archibald GW. 1996. The cranes. Gland,
Switzerland: IUCN.
Olson D and Dinerstein E. 1998. The Global 200: a representation
approach to conserving the earth’s most biological valuable
ecoregions. Conserv Biol 12: 502–15.
Peng YH, Jian YX, Wang JB, and Ni LY. 2004. A comparative study
on aquatic plant diversity in five largest lakes of Hubei Province
in China. Acta Hydrob Sin 28: 464–70.
Poyang Lake National Nature Reserve. 1993. Management and
planning of Poyang Lake National Nature Reserve. Beijing,
China: China Forestry Press.
Qiu XL, Huang MK, and Chen DQ. 1998. The status and degrada-
tions of Tenualosa reevesi in the Yangtze River. Fresh Fishery 28:
18–21.
Shi CY. 1989. A general outline of Chinese Lakes. Beijing, China:
Science Press.
Song TX, Zhang GH, Chang JB, et al. 1999. Fish diversity in Honghu
Lake. Chinese J Appl Ecol 10: 86–90.
Stanley E and Doyle MW. 2003. Trading off: the ecological effects of
dam removal. Front Ecol Environ 1: 15–22.
Wang KY (Ed). 1998. The management and exploitation of Dong-
ting Lake. Changsha, China: Hunan People Publishing House.
Wang WM, Yang QR, Fan QX, Zhang JB. 1994. Aquatic vegetation
in Liangzi Lake. J Huazhong Agr Univ 13: 281–90.
Wei QW, Ke FE, Zhang JM et al. 1997. Biology, fisheries, and conser-
vation of sturgeons and paddlefish in China. Environ Biol Fishes
48: 241–56.
Wetland International (China). 1998. Wetland and waterbird con-
servation: proceedings of an international workshop on wetland
and waterbird conservation in North East Asia. Beijing, China:
China Forestry Publishing House.
Wu JG, Huang JH, Han XG, et al. 2004. The Three Gorges Dam: an
ecological perspective. Front Ecol Environ 2: 241–48
Wu YH and Ji WT. 2002. Researches on Poyang Lake national
nature reserve, Jiangxi Province. Beijing, China: China Forestry
Publishing House.
Wu ZB, Chen DQ, Qiu DR, and Liu BY. 2003. Investigation of the
distribution of the aquatic vegetation in Lake Donghu, Wuhan.
Chongqing Environ Sci 25: 54–62.
Xie P. 2003. Three-Gorges Dam: risk to ancient fish. Science 302:
1149.
Yan GA, Ma JM, Qiu DR, and Wu ZB. 1997. Succession and species
replacement of aquatic plant community in East Lake. Acta
Phytoecol Sin 21: 319–27.
Yang J, Xiao W, Kuang XA, et al. 2000. Studies on the distribution,
population size and the active regularity of Lipotes vexillifer and
Neophocaena phocaenoides in Dongting Lake and Boyang Lake.
Resour Environ Yangtze Basin 9: 444–50.
Yao ZW, Li YJ, and Xia SL. 1990. Studies of the aquatic vascular
plants and eutrophication in Wuhan East Lake. Chongqing
Environ Sci 12: 26–30.
Yi JF, Chang JB, Tang DM, et al. 1999. Present status of spawning
stock of Chinese sturgeon, Acipenser sinensis, in the Yangtze
River. Acta Hydrob Sin 23: 554–59.
Yu D. 1995. A preliminary study on the phytocoenology of aquatic
plants in the Donghu Lake. In: Liu JK (Ed). 1995. Ecological
studies on Donghu Lake (II). Beijing, China: Science Press.
Yuan HC, Jiang QW, Zhao GM, and He N. 2002. Achievements of
schistosomiasis control in China. Memorias Do Instituto Oswaldo
Cruz 97: 187–189.
Zhang B (Ed). 1988. Studies on Poyang Lake. Shanghai, China:
Shanghai Scientific and Technology Publishers.
Zhang CG, Zhao YH, and Kang JG. 2000. A discussion on resources
status of Myxocyprinus asiaticus (Bleeker) and their conservation
and the recovery. J Nat Resour 15: 155–59.
Zhao SQ. 2002. Study on land use changes, dynamics of waterfowl
habitats, and some wintering characteristics of waterfowl in
Dongting Lake area, Hunan Province (PhD dissertation).
Beijing, China: Peking University.
Zhao SQ, Fang JY, Ji W, and Tang ZY. 2003. Lake restoration from
impoldering: impact of land conversion on riparian landscape in
Honghu Lake area, Central Yangtze. Agric Ecosys Environ 95:
111–18.
Zhao SQ, Fang JY, Miao SL, et al. 2005. The 7-decade degradation of
a large freshwater lake in Central Yangtze River, China. Environ
Sci Technol 39: 431–36.
Zhou LY, Li QY, and Dai LY. 1963. Aquatic vascular plants in
Donghu Lake, Wuchang. J Wuhan Univ (Nat Sci Section) 2:
122–32
1
Department of Ecology, College of Environmental Sciences, and Key
Laboratory for Earth Surface Processes of the Ministry of Education,
Peking University, Beijing, 100871, China (
edu.cn);
2
College of Life Sciences, Wuhan University, Luojia-shan,
Wuhan, China;
3
Institute of Hydrobiology, Chinese Academy of Scien-
ces, Wuhan, 430072, China;
4
Department of Environmental Science and
Technology, East China Normal University, Shanghai, 200062, China
377
© The Ecological Society of America www.frontiersinecology.org