SKYSCRAPERS AND BUSINESS CYCLES potx
Bạn đang xem bản rút gọn của tài liệu. Xem và tải ngay bản đầy đủ của tài liệu tại đây (129.64 KB, 24 trang )
MARK THORNTON is a senior fellow at the Mises Institute. The author would like to thank
Robert Ekelund, Roger Garrison, Guido Hülsmann, Robert Mulligan, Kathy White, Paul
Wicks, and the two referees of this paper for the helpful criticism and suggestions.
SKYSCRAPERS AND
BUSINESS CYCLES
M
ARK THORNTON
T
he skyscraper index, created by economist Andrew Lawrence shows a
correlation between the construction of the world’s tallest building and
the business cycle. Is this just a coincidence, or perhaps do skyscrap-
ers cause business cycles? A theoretical foundation of “Cantillon effects” for
the skyscraper index is provided here showing how the basic components of
skyscraper construction such as technology are related to key theoretical con-
cepts in economics such as the structure of production. The findings, empir-
ical and theoretical, suggest that the business cycle theory of the Austrian
School of economics has much to contribute to our understanding of business
cycles, particularly severe ones.
The skyscraper, that unique celebration of secular capitalism and its val-
ues, challenges us on every level. It offers unique opportunities for insight-
ful analysis in the broadest terms of twentieth-century art, humanity, and
history. When criticism becomes captive to centers of power or prevailing
theories or fashions, unwilling or unable to probe the process and the
results, something important has gone wrong with one of the stabilizing
and balancing forces of a mature society. (Huxtable 1992, p. 120)
In the overheated speculation of the 1920s, as land prices rose, towers
grew steadily taller. Or should the order be: as skyscrapers grew taller,
land prices rose? The variables that contributed to real estate cycles were
even more complex than this “chicken and egg” conundrum. (Willis 1995,
p. 88)
The skyscraper is the great architectural contribution of modern capital-
istic society and is even one of the yardsticks for twentieth-century super-
heroes, but no one had ever really connected it with the quintessential feature
of modern capitalistic history—the business cycle. Then in 1999, economist
Andrew Lawrence created the “skyscraper index” which purported to show
that the building of the tallest skyscrapers is coincidental with business
THE QUARTERLY JOURNAL OF AUSTRIAN ECONOMICS VOL. 8, NO. 1 (SPRING 2005): 51–74
51
cycles, in that he found that the building of world’s tallest building is a good
proxy for dating the onset of major economic downturns. Lawrence described
his index as an “unhealthy 100 year correlation.”
The ability of the index to predict economic collapse is surprising. For
example, the Panic of 1907 was presaged by the building of the Singer Build-
ing (completed in 1908) and the Metropolitan Life Building (completed in
1909). The skyscraper index also accurately predicted the Great Depression
with the completion of 40 Wall Tower in 1929, the Chrysler Building in 1930,
and the Empire State Building in 1931. There are, however, important excep-
tions in the ability of the index to predict, so the first question is: how good
of a predictor is the skyscraper index?
Second, what is the nature of the relationship between skyscraper build-
ing and the business cycle? Surely, building the world’s tallest building does
not cause economic collapse, but just as clearly, there are economic linkages
between construction booms and financial busts. What theoretical connec-
tions can be made between skyscraper building and business cycles? Andrew
Lawrence noted overinvestment, monetary expansion, and speculation as pos-
sible foundations for the index, but did not explore these issues. With the
destruction of the World Trade Towers and the increased threat of terrorism,
the skyscraper index may have already lost its usefulness for future predic-
tion,
1
but even if that were the case, the theoretical linkages between sky-
scraper building and business cycles may still have usefulness in improving
our understanding of business cycles and the economic theory behind them.
In order to better examine the relationship, the evidence in support of the
skyscraper index is examined and compared to the reliability of other market
indicators. The ability of most market indicators is found to be weak, while
the ability of the skyscraper index to predict severe changes in the business
cycle is strong. The general relationship between the business cycle and sky-
scraper building is examined with respect to the role of “Cantillon effects” in
skyscraper cycles. The unique and distinguishing features of abnormally large
swings in the business cycle, as manifested in record-setting skyscrapers, are
then shown to be uncommon features of most business cycle theories and a
unique feature of the Austrian school’s theory of the business cycle. Finally,
the data linking the world’s tallest skyscrapers and business cycles is reexam-
ined to evaluate the index’s incorrect predictions and as a result the index is
shown to be more accurate than previously thought.
52 THE QUARTERLY JOURNAL OF AUSTRIAN ECONOMICS VOL. 8, NO. 1 (SPRING 2005)
1
Glaeser and Shapiro (2001, p. 15) did not find a statistically significant effect
between the amount of terrorism and the numbers of skyscrapers built. They also note that
the number of skyscrapers may not be market determined because of government inter-
vention (e.g., building codes) as well as the builder’s desire for personal aggrandizement.
D
O SKYSCRAPERS
PREDICT?
Lawrence (1999a) was apparently the first to make the claim that the con-
struction of the world’s tallest building was correlated with impending finan-
cial crisis although the subject of the world’s tallest skyscrapers and their rela-
tion to economic crisis is also prominent in Grant (1996). Lawrence showed
that in almost all cases the initiation of construction of a new record-breaking
skyscraper preceded major financial corrections and turmoil in economic
institutions. Generally, the skyscraper project is announced and construction
is begun during the late phase of the boom in the business cycle; when the
economy is growing and unemployment is low. This is then followed by a
sharp downturn in financial markets, economic recession or depression, and
significant increases in unemployment. The skyscraper is then completed dur-
ing the early phase of the economic correction, unless that correction was
revealed early enough to delay or scrap plans for construction. For example,
the Chrysler Building in New York was conceived and designed in 1928 and
the groundbreaking ceremony was conducted on September 19, 1928. “Black
Tuesday” occurred on October 29, 1929, marking the beginning of the Great
Depression. Opening ceremonies for the Chrysler Building occurred on May
28, 1930, making it the tallest building in the world.
The business press reported Lawrence’s findings positively, but not with
much fanfare.
Investors’ Business Daily
seemed somewhat sympathetic to his
“impressive” evidence, but asked “How could something bad come of build-
ing the world’s biggest skyscraper? After all, bigger is better. Having the
biggest building on earth can be a source of national pride” (
Investors’ Busi-
ness Daily
1999). Also positive was
Barron’s
who seemed to agree that it was
an “excellent forecasting tool for economic and financial imbalance” (Pesek
1999a).
Business Week
also made mention of the skyscraper index, although
the first and most concerned reports of the index came from the
Far Eastern
Economic Review
which noted that China was planning on breaking the
record for the world’s tallest building and constructing three of the 10 tallest
buildings on the planet by 2010.
2
The reason for the rather muted response to the skyscraper index is that
most “indicators” have failed to remain robust and not pass the test of time.
Indeed, the skyscraper index has not predicted all major economic collapses
such as the depressions of 1920–21, 1937–38, and 1981–82 and has predicted
economic collapse when downturns were relatively mild such as 1913 and the
early 1970s. The index could easily become obsolete due to factors such as ter-
rorism and the evolving nature of the economy. There have been numerous
indicators put forth to help us predict the business cycle and stock markets.
The Super Bowl indicator, for example, predicts that if a team from the
SKYSCRAPERS AND BUSINESS CYCLES 53
2
Koretz (May 17, 1999, p. 26) and Granitsas (February 11, 1999 p. 47); also see
Die
Abgabewelle Wirtschaftwoche
(May 27, 1999) for a report on the skyscraper index.
National Football Conference (the old NFL) beats the team from the Ameri-
can Football Conference in the Super Bowl game, it should be a good year for
the stock market and
ipso facto
a good year for the economy. This is a classic
case of a “coincidental” indicator in that the statistical relationship is only a
matter of coincidence.
3
There are seasonal indicators like the January effect,
which has only questionable causal links, and political indicators relating to
the political business cycle theory which also makes suggestions as to when
and how the economy and the stock market will perform. Leading indictors
with good causal-economic links with the economy include the inverted yield
curve and the index of leading economic indicators, the once official crystal
ball of the economy that lately has had greater difficulty accurately predicting
changes in the economy. In fact, the cost and difficulties of maintaining the
index led in recent years to it being privatized.
4
Economist Richard Roll
explained that such indicators have only fleeting value for real-world invest-
ing:
I’m not just an academic but also a businessman . . . we could sure do a
heck of a lot better for our clients in the money management business than
we’ve been doing. I have personally tried to invest money, my client’s
money and my own, in every single anomaly and predictive device that
academics have dreamed up. . . . I have attempted to exploit the so-called
year-end anomalies and a whole variety of strategies supposedly docu-
mented by academic research. And I have yet to make a single nickel on
any of these supposed market inefficiencies. (Roll 1992, pp. 29–30)
The problems with indicators are many. Some have a poor track record of
predictions, while others have a good track record but without any economic
rationale (e.g., the Super Bowl indicator) and thus offer little confidence that
the track record is not simply a statistical anomaly. Other indicators offer
mixed signals, such as the January effect, which can be based either on the
performance of the stock market (which one?) during the first week of Janu-
ary, or during the entire month. The January effect is also said to suffer from
the fact that once everyone is aware of the effect, it becomes anticipated and
therefore no longer offers reliable investment advice or insight into the econ-
omy. As a result, such indicators do not have a much better record predicting
the business cycle than professional economists.
The skyscraper index, in contrast does have a good record in predicting
important downturns in the economy. This index is a leading economic
54 THE QUARTERLY JOURNAL OF AUSTRIAN ECONOMICS VOL. 8, NO. 1 (SPRING 2005)
3
This type of coincidental indicator (with no causal connections) should be differen-
tiated from coincidental economic indicators which simply follow or track changes in the
business cycle, such as payroll statistics, which are linked with economic activity.
4
Hershey (1995) notes that the Commerce Department announced that the Confer-
ence Board won the bidding against several competitors to take over compilation of the
Index of Leading Economic Indicators, and the coincident and lagging indicators.
indicator in that the announcement of building plans predates the onset of the
economic downturn. There have been four major skyscraper booms in the
twentieth century interspersed by periods of relative normality and less severe
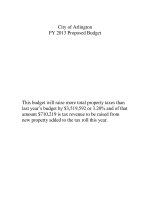
business cycles. Table 1 presents the history of the world’s tallest buildings
that demonstrates that many major economic downturns were associated with
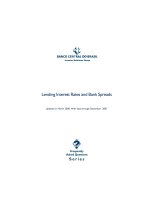
the building of the world’s tallest skyscrapers. A more visually-enhanced per-
spective of this history is provided for in Figure 1.
Table 1
World’s Tallest Buildings
SKYSCRAPERS AND BUSINESS CYCLES 55
5
Naturally members of the Free Banking School such as Lawrence White and George
Selgin would be critical of such a policy response. See Rothbard (1984) for a public choice
critique of the founding of the Federal Reserve.
COMPLETED BUILDING LOCATION HEIGHT STORIES
ECONOMIC CRISIS
1908 Singer New York
612 f t . 47
Panic of 1907
1909 Metropolitan Life New York
700 ft.
50
Panic of 1907
1913 Woolworth New York
792 ft . 57
—–––——
1929 40 Wall Street New York
927 ft.
71
Great Depression
1930 Chr ysler New York
1,046 ft. 77
Great Depression
1931 Empire State New York
1,250 ft.
102
Great Depression
1972/73 World Trade Center New York
1,368 ft. 110
1970s st agf lation
1974 Sears Tower Chicago
1,450 ft. 110
1970s st agf lation
1997 Petronas Tower Kuala Lumpur
1,483 ft. 88
East Asian
2012 Shanghai Shanghai
1,509 ft. 94
China?
The first skyscraper cycle occurred between 1904 and 1909 and included
the Singer Building becoming the world’s tallest when completed in 1908 and
the Metropolitan Life Building setting a new record in 1909. The Panic of 1907
occurred at a time when seasonal factors relating to fall harvests coincided with
cyclical factors in money and credit. It was ignited into financial panic when a
bank regulated under the National Banking system refused to clear funds for
the Knickerbocker, an unregulated trust. The result was widespread runs on
banks and one of the sharpest downturns in American economic history. This
episode is particularly important and of continuing relevance because it is
widely considered to be a key event in the passage of the Federal Reserve Act
in 1913. The Panic is widely considered to have been caused by problems asso-
ciated with the structure and regulation of the National Banking system. The
solution adopted was to increase the size and regulatory power of the national
government in matters of money and banking, although in recent years some
economists have questioned whether that was the proper response.
5
Bypassing the Woolworth Building, which at first does not seem to fit the
general pattern in Lawrence’s analysis, the second episode of the world’s
tallest buildings occurred at the onset of the Great Depression. Three record
setting skyscrapers were announced during the late 1920s, when the stock
market boom was being matched by booms in residential and commercial
construction. In 1929, the skyscraper at 40 Wall Street was completed at 71
stories, followed by the Chrysler Building in 1930 at 77 stories, and the
Empire State Building in 1931 at 102 stories. Clearly, there was a capital-ori-
ented boom in the construction of ever-taller buildings before the Great
Depression.
Economists have offered many different explanations for the Great
Depression and Robert Lucas (1987) has even claimed that it defies explana-
tion. What should be clear is that there was a significant increase in the
money stock between the founding of the Federal Reserve and the stock mar-
ket crash, a significant restructuring in banking and bank regulation, a sig-
nificant decline in the supply of money after the crash, a significant number
of bank failures, and a variety of other important factors that contributed to
the initiation and duration of the depression, including the Smoot-Hawley tar-
iff and the New Deal.
56 THE QUARTERLY JOURNAL OF AUSTRIAN ECONOMICS VOL. 8, NO. 1 (SPRING 2005)
Figure 1
Skyscrapers and Economic Crisis
The third major cycle of skyscraper records occurred in the early 1970s.
Once again the economy was coming off a strong and sustained boom in
economic activity during the 1960s. The economic downturn of 1970 marked
the beginning of more than a decade when the economy struggled with infla-
tion and recession, as well as disrupted institutions and markets. From 1970
to 1982 the American economy suffered from stagflation, several deep reces-
sions, and from high levels of the misery index (inflation rate + unemploy-
ment rate). As the last vestiges of the gold standard were being abandoned and
the Bretton Woods system was disintegrating, construction workers in New
York and Chicago were busy building the next set of the world’s tallest build-
ings. Breaking records set in the early days of the Great Depression, One
World Trade Center was completed in 1972 and Two World Trade Center was
completed in 1973, both of 110 stories. In Chicago, the Sears Tower was com-
pleted in 1974, which was also 110 stories but reached a height of 1,450 feet
compared to the 1,368 feet of the World Trade Towers. Once again, econo-
mists failed to anticipate the downturn in the economy, failed to provide a
good explanation for the economic problems, and did not provide effective
remedies for the economic problems of the day. Even though high oil prices
occurred after the economy began its contraction, the theory of “supply
shocks” was born.
6
The fourth cycle ushered in the East Asian economic crisis. The Pacific
Rim countries such as Hong Kong, Malaysia, Singapore, Vietnam, and South
Korea experienced significant economic growth during the 1980s and 1990s.
SKYSCRAPERS AND BUSINESS CYCLES 57
6
It is worth quoting academic economist and Federal Reserve Governor Ben Bernanke
(2003) at length on the profession’s failure to look past the obvious to the
economic
. With
the help of 25 years of hindsight, he concludes:
The upshot is that the deep 1973–75 recession was caused only in part
by increases in oil prices
per se
. An equally important source of the
recession was several years of overexpansionary monetary policy that
squandered the Fed’s credibility regarding inflation, with the ultimate
result that the economic impact of the oil producers’ actions was signif-
icantly larger than it had to be. Instability in both prices and the real
economy continued for the rest of the decade, until the Fed under Chair-
man Paul Volcker reestablished the Fed’s credibility with the painful dis-
inflationary episode of 1980–82. This latter episode and its enormous
costs should also be chalked up to the failure to keep inflation and infla-
tion expectations low and stable. In contrast to the 1970s, fluctuations
in oil prices have had far smaller effects on both inflation and output in
the United States and other industrialized countries since the early
1980s. In part this more moderate effect reflects increased energy effi-
ciency and other structural changes, but I believe the dominant reason
is that the use of constrained discretion in the making of monetary pol-
icy has led to better anchoring of inflation expectations in the great
majority of industrial countries.
With the region’s leading economy, Japan, in recession and stagnation for
much of the 1990s, the “Asian Tigers” were considered miracle economies
because they were strong and durable despite being small and vulnerable. The
Petronas Towers were completed in Kuala Lumpur, Malaysia in 1997 setting a
new record for the world’s tallest building at 1,483 feet beating the old record
by 33 feet (the two towers were only 88 stories high compared with the 110
story giants built in the early 1970s). It marked the beginning of the extreme
drop in Malaysia’s stock market, rapid depreciation of its currency, and wide-
spread social unrest. Financial and economic problems spread to economies
throughout the region, a phenomenon known as the “Asian Contagion.”
The common pattern in these four historical episodes contains the fol-
lowing features. First, a period of “easy money” leads to a rapid expansion
of the economy and a boom in the stock market. In particular, the relatively
easy availability of credit fuels a substantial increase in capital expenditures.
Capital expenditures flow in the direction of new technologies which in turn
creates new industries and transforms some existing industries in terms of
their structure and technology. This is when the world’s tallest buildings are
begun. At some point thereafter negative information ignites panicky behav-
ior in financial markets and there is a decline in the relative price of fixed
capital goods. Finally, unemployment increases, particularly in capital and
technology-intensive industries. While this analysis concentrates on the U.S.
economy, the impact of these crises was often felt outside the domestic econ-
omy.
It would be very easy to dismiss the skyscraper index as a predictor of the
business cycle, just as other indicators and indexes have been rightly rejected.
However, the skyscraper has many of the characteristic features that play crit-
ical roles in various business cycle theories. It is these features that make sky-
scrapers, especially the construction of the world’s tallest buildings, a salient
marker of the twentieth-century’s business cycle; the reoccurring pattern of
entrepreneurial error that takes place in the boom phase that is later revealed
during the bust phase. In the twentieth century the skyscraper has replaced
the factory and railroad, just as the information and service sectors have
replaced heavy industry and manufacturing as the dominant sectors of the
economy. The skyscraper is the critical nexus of the administration of modern
global capitalism and commerce where decisions are made and transmitted
throughout the capitalist system and where traders communicate and
exchange information and goods, interconnecting with the telecommunica-
tions network. Therefore it should not be surprising that the skyscraper is an
important manifestation of the twentieth-century business cycle, just as the
canals, railroads, and factories were in previous times.
CANTILLON EFFECTS IN SKYSCRAPERS
Cantillon effects are named for their discoverer, Richard Cantillon, who is
widely credited as the first economic theorist, and in particular, was the first
58 THE QUARTERLY JOURNAL OF AUSTRIAN ECONOMICS VOL. 8, NO. 1 (SPRING 2005)
to show that changes in the money supply and credit have important impacts
on the economy by changing relative prices.
7
Cantillon showed that an
increase in the supply of money would cause economic expansion, but that
ultimately the process would be self-reversing as prices would rise and
imports would increase, sending money back out of the economy. Cantillon
further showed that monetary inflation does not affect all prices equally or at
the same time, but in sequences that depend on the spending behavior of
money holders all along the channels of monetary flows. These ideas have
been adopted and extended by Knut Wicksell, Ludwig von Mises, and F.A.
Hayek and more recently by McCulloch (1981) and Garrison (2001).
Cantillon effects are the real fundamental changes in resource allocation
that result from changing relative prices between the time of the creation of
new money and the full adjustment to the increase in supply. For Cantillon,
an increase in commodity money, such as silver, would increase employment
and prices. It would impose “forced savings” and lower real incomes on those
whose income was not changed due to monetary inflation, possibly leading
to unemployment or emigration. If the money supply increased due to a bal-
ance-of-payments surplus, then the additional money could cause an increase
in manufacturing or expansion in whatever the new money holders chose to
spend their money on.
Most importantly, changes in the supply of money can have effects on the
interest rate and once again the effect will depend on how the money enters
the economy. On the one hand, if it comes into the hands of traditional bor-
rowers or lenders, such as developers, the rate of interest would initially fall.
This is similar to the Austrian theory of the business cycle in that when banks
expand the money supply and lower the interest rate below what it would have
been borrowers invest in longer term capital projects. On the other hand, if
the money came into the hands of consumers, the rate of interest might rise
as suppliers attempt to meet the new demand for goods. In the Austrian view,
changes in the interest rate change the relative price between longer-term cap-
ital projects and shorter-term capital projects. A lowering of the interest rate
raises the prices of longer term capital goods relative to shorter term capital
goods.
In response to the change in relative prices, more resources are allocated
to long-term capital goods. Unlike other aspects of the self-adjusting market
process, such as money, land, labor, and short-term or intermediate capital
goods, these resources become suspended or fixed in long-term fixed capital
goods. These resources become formulated in a highly-specific capital good
that may not be well-suited to the alternative production processes of the
post-adjustment economy. As a result, all of the adjustment in these long-term
fixed capital goods must come from a change in price and this will entail large
losses and possible bankruptcies by the owners of these capital goods. To the
SKYSCRAPERS AND BUSINESS CYCLES 59
7
See Thornton (1998) for a modern assessment of Cantillon’s contributions.
extent that these types of adjustments are widespread, they pose a threat to
capital markets and the banking system.
The Cantillon effect works much like the Alchian and Allen effect, a sim-
ple application of price theory, the bread and butter of economic analysis.
8
Economists Armen Alchian and Richard Allen answered the question: Why
are high quality apples shipped out of apple-growing regions, leaving only
lower grade apples for the local market? They explain that the cost of trans-
porting apples from Washington State across the country is a “flat” rate per
crate of apples. This fee lowers the relative price of higher quality apples for
consumers in nonproducing states and raises it in producing states. If a high-
quality apple cost $1 and a standard quality apple cost $0.50 then the relative
price is 2-to-1. If a transport fee of $0.50 per apple is charged then the prices
are $1.50 for high quality and $1.00 for standard quality and thus the relative
price of the high-quality apples falls from 2-to-1 down to 1.5-to-1. In Wash-
ington the consumer must forgo 2 standard quality apples when purchasing
1 high quality apple, but in nonproducing regions the consumer need only
forgo 1.5 standard quality apples. Therefore the change in relative prices
explains why the preponderance of high-quality apples are shipped out, leav-
ing the local markets with lower-quality apples. The same is true for other
products such as lobsters from Maine and potatoes from Idaho, a result now
known as the Alchian and Allen effect. The impact of relative price changes
has proven to be a useful puzzle solver in areas outside of the grocery store.
9
Changes in relative prices also affect the type of capital goods produced.
Modern economics has great difficulty in dealing with real-world capital goods
and mainstream economists have gone to great pains to ignore the hetero-
geneity of capital and to great lengths to count, or add up what are otherwise
dissimilar and unique items like skyscrapers, factories, and mining opera-
tions. Treating capital goods as homogeneous goods that can be counted has
facilitated much of neoclassical theorizing, but is also a major blind spot for
60 THE QUARTERLY JOURNAL OF AUSTRIAN ECONOMICS VOL. 8, NO. 1 (SPRING 2005)
8
See Thornton (1991a) for a more complete discussion of the Alchian and Allen Effect
and the theory of relative prices.
9
For example, the reason that illegal drugs such as heroin, cocaine, and marijuana
have become so highly potent is that the risk of moving drugs into the market and selling
them encourages drug dealers to supply the most concentrated forms of their products, an
effect often referred to as the Iron Law of Prohibition (Thornton, 1991a). This effect was
also was prominent during alcohol prohibition (1920–1933) when a nation consisting
mostly of beer drinkers switched to highly potent moonshine and bathtub gin (Thornton,
1991b). The relative price effect also played a role in the American Civil War when run-
ning the Union blockade of the Confederacy was a risky business. The “Rhett Butler
Effect” meant that blockade runners like the fictional character from
Gone with the Wind
imported high-priced items and luxury goods, like coffee, cognac, and formal dresses
rather than bulky items like salt and flour—the fixed risk cost of running the blockade
made it more profitable to do so (Ekelund and Thornton 1992). There has been some con-
fusion when economists have tried to apply the Alchian-Allen Effect (Cowen and Tabarrok,
1995), but it continues to show its real world applicability in both complex and simple
cases (Sobel and Garrett 1997).
neoclassical economists when issues and answers rest on the heterogeneity of
capital. However, some inroads have been made to correct this blind spot and
to consider the heterogeneity of capital as a focal issue. For example, Gools-
bee (1998) applied the Alchian-Allen effect to the case of tax subsidies for cap-
ital good purchases and found that such subsidies induce buyers to purchase
higher-priced machinery, rather than greater quantities of capital goods. Basi-
cally, tax subsidies allow buyers to substitute tax-subsidized quality for non-
subsidized expenditures such as training and future maintenance, thereby tip-
ping the balance of relative prices in favor of higher-quality capital goods. In
this very short-run orientation, capital goods do not change, only their com-
position, and there is a large dead weight loss associated with the tax subsidy.
While this application is certainly illustrative of the impact of changes in
relative prices on capital allocation, it did not address the longer run orienta-
tion of changes in the production side of the economy. In effect, Goolsbee
addressed the issue of how well do two different qualities of cooking pans sell
when subject to a 10 percent discount, but not whether new high-tech pans
will be introduced or if production will take place in the supplier’s garage or
in a humongous factory with computers and robots doing much of the work.
How productive and “roundabout” the process of production is will depend
crucially on what capital goods are selected and built.
The skyscraper is considered an art form, but its construction is essen-
tially a business that must pay heed to incentives and constraints and there-
fore skyscraper construction can be expected to closely follow even small
changes in relative prices. In reevaluating the early skyscraper artistically,
Huxtable (1992, pp. 23–24) noted:
Essentially, the early skyscraper was an economic phenomenon in which
business was the engine that drove innovation. The patron was the invest-
ment banker and the muse was cost-efficiency. Design was tied to the busi-
ness equation, and style was secondary to the primary factors of invest-
ment and use. . . . The priorities of the men who put up these buildings
were economy, efficiency, size, and speed.
That is not to say that the early skyscrapers were without artistic merit, or
that later structures failed to improve artistically, quite to the contrary. Never-
theless, post-World War I skyscrapers continued to emphasize profits and
technology. The early skyscraper drew from existing technology and was con-
sidered an engine of innovation. Even in modern times, design continues to
grow and evolve, but the “structural rationale for such a tall structure is tech-
nically and economically inescapable.”
10
For Huxtable (1992, p. 105) “Archi-
tecture simply doesn’t count. . . . With pitifully few exceptions in the past,
New York’s skyscrapers have never reached for anything but money.” And
while technology is certainly an awe-inspiring facet of skyscrapers, it should
be remembered that the important technology of the first “skyscrapers” in the
SKYSCRAPERS AND BUSINESS CYCLES 61
10
Helmut Jahn quoted in Huxtable (1992, p. 96).
late nineteenth century was already available before the Civil War and that the
basic “structural principles of the tall building, developed by the turn of the
century, have remained essentially unchanged.”
11
Art, technology, government
regulations, and even ego must be considered, but the skyscraper is essen-
tially a captive of economic forces and motives. Therefore when architects are
asked what makes for the “super skyscraper,” economic forces are considered
preeminent, or as Robert Sobel meekly put it, “I think there are financial
forces working to make this happen.”
12
Changes in the rate of interest (the relative price between consumption
goods and capital goods) can have three separate Cantillon effects on sky-
scrapers. All three effects are reinforcing and all three effects are intercon-
nected to the transformation of the economy toward more roundabout pro-
duction processes. When the rate of interest is reduced, all three effects
contribute to the desire to build taller structures. The world’s tallest buildings
are generally built when there is a substantial and sustained divergence
between the actual interest rate and the natural rate of interest, where the
actual rate is below the natural rate as a result of government intervention.
When the rate of interest increases, the financial effects all reduce the value
of existing structures and the demand to build tall structures and when com-
bined with depressed economic activity, the desire to build at all.
The first Cantillon effect is the impact of the rate of interest on the value
of land and the cost of capital. A lower rate of interest tends to increase the
value of land, especially in the central business districts of major metropoli-
tan cities. Land values rise because lower rates of interest reduce the oppor-
tunity cost or full price of owning land. Treating the rate of interest as an
exogenous cause, a reduction in the interest rate will increase the demand for
land and result in an increase in land prices. However, the overriding issue
with land is “location, location, location,” so that the interest rate will have dif-
ferential effects on land prices.
When the rate of interest is falling, the land best suited for the production
of the longer term, more capital intensive and more roundabout methods of
production will increase in price relative to land better suited for shorter term,
more direct methods of production. As land prices generally rise, the yield
from any piece of land that would make ownership of it profitable also rises.
Combined with a lower cost of capital brought about by a lower rate of inter-
est, land owners will seek to build more capital-intensive structures and at the
margin this will cause land to be put to alternative uses. In the central busi-
ness district this means more intensive use of land and thus higher buildings.
Simplified, higher prices for land reduce the ratio of the per-floor cost of tall
vs. short buildings and thus create the incentive to build buildings taller to
spread the land cost over a larger number of floors. Lower rates of interest also
62 THE QUARTERLY JOURNAL OF AUSTRIAN ECONOMICS VOL. 8, NO. 1 (SPRING 2005)
11
The editors of
Architectural Forum
circa 1950 quoted in Huxtable (1992, p. 99).
12
As quoted in Huxtable (1992, p. 117).
reduce the cost of capital which facilitates the ability to build taller. Thus,
higher land cost leads to taller buildings.
13
The second Cantillon effect from lower rates of interest is the impact on
the size of the firm. A lower cost of capital encourages firms to grow in size
and to become more capital intensive and to take advantages of economies of
scale. Production and distribution become more specialized and take place
over a larger territory. Instead of a dairy farmer raising cows and producing
milk for the domestic market, larger firms raise a greater quantity of dairy cat-
tle, ship raw milk to processing plants and ship processed dairy products
back to wholesale and retail distribution sites. The production of dairy prod-
ucts becomes more roundabout, but also more productive. As part of this
more roundabout production process, firms develop central offices or head-
quarters, as well as marketing offices within their market territory. This
increases the demand for office space in central business districts. This
demand in turn raises rents and encourages the building of more, and still
taller, office buildings within the central market district.
The third Cantillon effect is the impact on technology of constructing
taller buildings. Inevitably, record-breaking skyscrapers require innovation
and new, untried applications of technology. Buildings that reach new heights
pose numerous engineering and technological problems relating to such
issues as building a sufficiently strong foundation, ventilation, heating, cool-
ing, lighting, transportation (elevators, stairs, parking), communication, elec-
trical power, plumbing, wind resistance, structural integrity, fire protection
and building security. There is also a host of “public” issues connected with
increases in employment density brought about by tall structures, such as
transportation congestion and environmental concerns.
14
Beyond the mere
technology it takes to build the world’s tallest building, every vertical beam,
tube, or shaft in a building takes away from rentable space on each floor built,
and the more floors in the structure, the greater the required capacity of each
system in the building, whether it is plumbing, ventilation, or elevators.
Hence, there is a tremendous desire to innovate with technology in order to
conserve on the size of building systems or to increase the capacity of those
systems. Therefore, as the height of construction rises, input suppliers must
go back to the drawing board and reinvent themselves, their products, and
their production processes.
All three Cantillon effects resulting from lower rates of interest are, of
course, interrelated and reinforcing. All three are generally recognized by
those involved in the building of large office buildings including architects,
bankers, contractors, design specialists, engineers, entrepreneurs, finance
SKYSCRAPERS AND BUSINESS CYCLES 63
13
See Atack and Margo (1996). They examined the market for land in New York City
during the nineteenth century. Their evidence suggests that land values tended to increase
during deflationary periods, but less so during inflationary periods.
14
Kim (2002) showed how increases in skyscraper building and, in particular,
improvements in skyscraper technology, lead to increases in employment density.
specialists such as bond dealers, government regulators, and the tenants
themselves. In addition to the location and prestige of a skyscraper address,
tenants place higher value on office space with better light, view, and net-
working opportunities.
15
Higher interest rates discourage the building of taller
buildings and of construction in general because capital is scarcer and land is
less in demand and available at lower prices. Existing structures experience
financial difficulties that relate back to Cantillon effects, such as higher bor-
rowing costs, lower capital asset values, and a decreased demand for office
space. Firms engaged in office building construction and their suppliers face
a decrease in the demand for their services, the impact of which falls hardest
on those firms who specialize in the production of the tallest buildings. It is
not atypical for the owners of such buildings and the builders of such elabo-
rate construction projects to go bankrupt during economic slumps.
The interest rate is what makes the construction business, in part, such as
speculative business. Home builders build “spec houses” and face the risk of
finding a buyer at a profitable price. Developers build speculative office build-
ings which in contrast to many corporate headquarters are investments that
rely on an uncertain flow of rental income. Separating the winners from the
losers is not as much a matter of greed as it is a matter of time. Carol Willis
(1995, p. 157) explained the difference between normal times and boom times.
In normal times, when costs of land, materials, and construction are pre-
dictable, developers use well-tested formulas to estimate the economics of
a project. These calculations are based on the concept of the capitalization
of net income. This value takes into account the net income for thirty or
forty years . . . the conventional market formulas and the concept of eco-
nomic height were widely known and followed in the industry. Most spec-
ulative building was not risky, but reserved in its calculations and highly
responsive to market desires.
All of the normal calculations that help ensure profit and avoid loss are
not, however, reliable during the boom phase of the business cycle. As Willis
explained (1995, pp. 157–58):
In booms, the so-called rational basis of land values is disregarded, and
the answer to the question “What is the value of land?” becomes “What-
ever someone is willing to pay.” Some speculators estimate value on new
assumptions of higher rents; others simply plan to turn a property for a
quick profit. . . . But due to the cyclical character of the real estate indus-
try, the timing of a project is crucial to its success, and the amount a prop-
erty reaps in rents or sale depends on when in a cycle it is completed or
comes onto the market.
Building the world’s tallest building has been a matter of particularly bad tim-
ing by entrepreneurs and even if they were able to successfully steal away
64 THE QUARTERLY JOURNAL OF AUSTRIAN ECONOMICS VOL. 8, NO. 1 (SPRING 2005)
15
See for example the evidence presented by Colwell and Cannaday (1988).
enough tenants from the remaining pool of renters, the economic problem for
society is that valuable resources are lost in the process of constructing build-
ings that are bad investments and underutilized.
16
However, it is not the entre-
preneur’s formula that is at fault, but a system-wide failure that has occurred
periodically throughout the twentieth century and before, known as the busi-
ness cycle. Hoyt (1933) found the building cycle was a “motion of a definite
order” lasting 18 years, on average, from peak to peak. But Willis (1995, p.
159) raised the key issue as it relates to skyscrapers:
Indeed, a key question about cycles is, if their pattern is so predictable,
why don’t people foresee the inevitable bust? This conundrum can per-
haps be answered by looking more closely at the dynamics of speculation
and at a typical skyscraper development.
Hoyt suggested that the cycle is long enough for people to forget the lesson of
the previous cycle and thus not be able to apply it to the next cycle. However,
the building cycle is much more volatile than their 18-year average would sug-
gest and the construction industry is affected by other cycles of shorter dura-
tion. Together with the impact of local economic conditions and government
intervention, the combination blurs any usefulness of the simple knowledge
that business cycles exist. As Willis (p. 164) noted:
After the collapse of an inflated market, it is easy to look back on the grave
errors of judgment that preceded a crash; yet the basic indicators of the
twenties economy seemed to promise unimpeded growth. Pent-up demand
for office space after World War I, the expanding numbers of the white-col-
lar workforce, and the increasing per-person average for office space all
fueled the building industry. Each year, the summaries of annual con-
struction figures reported record numbers.
Willis did correctly identify that “easy financing underlie all booms,” but
this does not answer her conundrum because easy financing and low interest
rates are also at the heart of genuine economic growth. The entrepreneur’s
problem is that profit calculations cannot show for sure whether interest rates
will remain low and projects will succeed (economic growth) or rates will rise
and projects will fail (business cycle). It seems that only time will tell. Fur-
thermore, it should be made clear that low interest rates and “easy financing”
are terms not defined on the basis of their magnitudes, but in relation to their
natural rates and levels—based on savings, which are not known or observable.
Increases in the money supply will tend to generate increases in construction
spending, but nominal interest rates (the most visible rate) tend to move with
movements in construction spending (Barth et al., 1988). The business cycle
SKYSCRAPERS AND BUSINESS CYCLES 65
16
See for example Hendershott and Kane (1992, p. 68) who estimated that there was
more than $130 billion wasted in the commercial construction boom of the 1980s. The
Empire State Building was nicknamed the “Empty State Building” because of its high
vacancy rates until after World War II.
may indeed have a predictable pattern, but its timing and magnitude may be
beyond rational human construction. Overbuilding by the construction indus-
try is not a problem of the construction industry
per se
, but a problem of too
much financing and some sort of government-caused distortion. For example,
Hendershott and Kane (1992, pp. 61–69) made the following conclusions con-
cerning the construction boom of the 1980s:
Why did our nation overbuild so much and so long? The answer lies
largely in the distortion of private incentives by misguided governmental
policies on both the regulatory and legislative fronts. . . . Building requires
both construction and permanent financing; overbuilding requires too
much of each, financed at too low a rate . . . developers have traditionally
used substantial debt financing and this tendency was especially strong in
the U.S. during the 1980s. Highly leveraged building projects were a natu-
ral response to government-distorted incentives.
The history of speculative bubbles in construction is paralleled by a history of
big increases in debt financing whether it is generated by endogenous factors,
gold flows, central banks, or in this case bank regulators.
CANTILLONED BUILDINGS AND BUSINESS CYCLES
As Abraham and Hendershott (1994, p. 15) have noted: “We don’t really
know what starts the speculative bubbles.” The problem with business-cycle
theories is that they are often more like descriptions of business cycles rather
than theories about business cycles and their causes. Each description
emphasizes particular features which are then raised to the status of causal
forces. Each stage of the business cycle is characterized by several features
(e.g., speculation, unstable supply of money, decreased aggregate demand,
and exogenous real factors). As a result, business-cycle theories are generally
“perspectives” in which the economist has identified institutions to place
blame along with their preferred remedies. One solution to this problem is
to recast the business cycle with its paired features and then analyze those
features with economic theory to provide a theoretical understanding of the
business cycle.
As such, business cycles are reoccurring sequences of varying length of
expansions, downturns, contractions, and upturns in many types of eco-
nomic activity such as production, employment, income, sales, housing
starts, money, credit, and prices. Interest rates, inventories, fixed capital, and
loans outstanding tend to be procyclical.
Expansions and booms are generally characterized by low and stable
interest rates, increased borrowing and credit formation, increases in the
monetary stock and money supply, and investment speculation. Employment
increases and so does production. Prices of capital assets, stock prices, and
land values all tend to increase during the expansion phase of the business
cycle. Speculation could cause such an expansion based, for example, on
changes in expectations of the future. However, speculation is unlikely to be
66 THE QUARTERLY JOURNAL OF AUSTRIAN ECONOMICS VOL. 8, NO. 1 (SPRING 2005)
the first cause of a reoccurring cyclical phenomenon, although it certainly is
a regular component of that phenomenon known as the expansion or boom.
Likewise, investment is an important component of the expansion phase but
it too has prior causes. Endogenous investment could ignite an expansion
and increase the amount of loans and the money supply, but again such a
change is unlikely to represent a reoccurring cyclical phenomenon. Most
importantly, increased speculation and the related concept of increased
investment would normally not represent the potential for systemic error on
the part of investors because in each case their actions were based on group-
wise assessments of future conditions. It would be most unlikely that such
economy-wide assessments would be systemically incorrect on an on-going
basis. Therefore, while it is imaginable that entrepreneurs might self-ignite an
economic expansion, and that such an expansion could turn out to be false,
it is unlikely that they would continue to self-ignite self-defeating expansions
on a reoccurring basis.
The economy can also experience an expansion if there is an increase in
the supply of loanable funds. If the supply of saving increases due to a
decrease in time preference, then interest rates fall and more resources are
made available to entrepreneurs to invest in future production. The result is
that the rate of economic growth will increase and consumption will increase
when the new investments come on line and start producing. Banks can also
simulate
an increase in the supply of saving by reducing bank reserves held
against demand deposits. It is unlikely that a single bank could influence the
market rates of interest with this approach or orchestrate a significant or sus-
tained reduction in interest rates via this mechanism. It would also be odd for
an industry to reduce the price of its product in order to sell more loans to
less desirable customers and thereby put the assets of banks at greater risk.
17
It is possible for a central bank or monopoly bank to reduce the market rate
of interest by providing banks with additional bank reserves. The lower inter-
est rate will induce a reduced amount of saving and an increase in the amount
of borrowing, heavily weighted to investment expenditures. The gap between
the increased investment and the decreased savings is filled with resources
paid by “forced savings.”
The interest rate, which normally establishes the intertemporal market
clearing between saving, investment, and consumption, is here the source of
important imbalances. First it establishes an increased responsibility to pay
(borrowed funds) with a decreased ability to buy (reduce interest income
from savings). Second, when interest rates are perceived to be stable and the
market rate is reduced from the natural rate of interest that would have
existed in the market, entrepreneurs are enticed to invest in more roundabout
SKYSCRAPERS AND BUSINESS CYCLES 67
17
See for example Selgin (1992) who shows that there is little in either economic the-
ory or history that indicates lending manias are endogenous to laissez-faire banking sys-
tems.
methods of production. Entrepreneurs simultaneously begin the development
of new, more capital-intensive and less labor-intensive means of production
that are more roundabout and efficient given the new interest rate signals
they face.
Investment in more roundabout production processes means that
investors are investing in new independent projects involving unique capital
goods and new technologies and “ways of doing things” that were previously
“on the shelf” but not in general use. Spending money on research and devel-
opment, for example, is investment in more roundabout production
processes, as is building a net to fish rather than using your hands or a crude
object such as a sharpened stick. Transportation provides other examples
such as building canals to compete with road traffic, or building railroads to
compete with canals and river traffic. The most direct way of communicating
with someone is to walk over to them and begin talking while a more round-
about method would be to run telephone lines between your location and
their location and to use telephones to communicate.
This activity however implies the existence of a wide variety of capital
goods as well as the production of wires, phones, telephone poles to string the
wires, etc. Phones are therefore more roundabout than the “walk and talk”
method, but are definitely more productive. Likewise, replacing regular phone
lines with fiber optic cables is more roundabout but more productive. The
cables are more roundabout because we have to first build new capital goods
to produce the optic cables while the capital goods to produce traditional
phone lines already exist for the most part. Fiber optic cables are also more
productive than traditional phone lines in that they can do everything a tradi-
tional line can do and transmit data at faster speeds. The “technology” of “just
in time inventory” systems could also be an example of a more roundabout
process. More roundaboutness implies the use of a different technology, in the
broad sense of the word. Entrepreneurs do not embark on more roundabout
production techniques that are less productive than less roundabout tech-
niques as they seek to produce consumer goods as quickly as possible
because time is money.
18
An office building is a capital good that is used to bring a variety of con-
sumer goods to market in the sense that production in the office building
involves the decision-making process over all aspects of the firm. Its use is
ubiquitous in “big business” and is totally absent in small businesses such
as family farms, hot dog stands, plumbing services, auto body repair shops,
etc. As such, the office building is a critical capital good in very roundabout
production processes that represent virtually all modern production and all
68 THE QUARTERLY JOURNAL OF AUSTRIAN ECONOMICS VOL. 8, NO. 1 (SPRING 2005)
18
Government bureaucrats and college presidents often do consider and implement
more roundabout processes that are less or equally productive due to the inability to cal-
culate economically, bribery, and the need to spend the bureau’s budget within a time con-
straint.
cutting-edge goods and service production. The modern economy is inextri-
cably linked with the large office building or as Carol Willis (1995, p. 181) put
it: “Skyscrapers are the ultimate architecture of capitalism.”
The skyscraper is not just a large version of the office building. Skyscrap-
ers can be used to house the offices of a single corporation, the central offices
and branch offices of multiple corporations, hotel and residential living space,
commercial space, convention space, a wide variety of personal service busi-
nesses, and specialized tenants such as stock exchanges, theaters, and televi-
sion studios. As such, the skyscraper can serve as a much larger and more
advanced office building (being both more productive and producing a
higher-quality service). It can even take on the status of a business commu-
nity or specialized form of privately-controlled marketplace. Naturally, greater
amounts and diversity of production are possible in larger skyscrapers. The
world’s tallest building, past and present, also adds the status of a distinct
address.
Economists of the Austrian School have a theory of the business cycle
based on capital theory where the structure of production is distorted by arti-
ficial changes in the interest rate. Economic activity is based on “fundamen-
tals,” but the fundamentals themselves can be distorted and induce bad invest-
ments (hysteria and speculation) that ultimately are revealed to be bad
investments during the economic contraction. In contrast, many mainstream
economists ignore the structure and roundaboutness of production. Indeed,
for more than the last half a century economists have been concentrating on
the subject of the quantity of capital while generally ignoring the details of
real world capital goods and the intricacies of the structure of how capital
goods are actually used to produce goods. This emphasis by the profession
has unfortunately left many economists with little knowledge of a most
important aspect of economics and the economy; the nexus of capital and
entrepreneurship known as technology. As Alan Greenspan (2003) has testi-
fied before the U.S. Congress: “Economists understand very little about how
technological progress occurs.” Other leading economists feel that markets
and investments are not based on rational foundations and that economists
would be well advised to study psychology rather than price theory. Still oth-
ers, like the Austrians, feel that business cycles are based on some sort of tech-
nological change, but they either do not know why technology changes or
view it as a random process. All of these views are well expressed by Robert
Shiller:
I think that most price movements of any size are unrelated to news about
fundamentals [p. 26]. . . . The most straightforward explanation, then I
think, is one that is
inconsistent
with market efficiency—namely, a specu-
lative bubble. People were selling, in short, simply because they thought
other people were going to sell [p. 27]. . . . I will say, however, that such
speculative behavior is kind of a depressing lesson for economists. It’s very
difficult for us to model these things; it suggests we have learned the
wrong research skills. The strong suggestion from this evidence is that
SKYSCRAPERS AND BUSINESS CYCLES 69
much that occurs in financial markets doesn’t make sense in terms of fun-
damentals.
I also suspect that what we have recently learned about financial markets
probably extends to macroeconomic issues as well—that is, to matters like
the business cycle. For example, there’s a recent fashion in the macroeco-
nomics literature called “real” business cycle models. Such models try to
make sense out of macroeconomic fluctuations entirely in terms of opti-
mal responses to new information about fundamentals. In fact, the only
thing that drives most of these models is technological change. That is, the
ups and downs of the business cycle are being caused predominantly by
technological progress, which uproots some industries while giving rise to
others. (Shiller 1992, pp. 26–28)
Fortunately, there does seem to be a growing appreciation for the Austrian
theory of the business cycle, if not an accurate understanding of the theory
itself. As Pesek (1999a) has noted, the causal factors relating skyscrapers to
the business cycle share the “basic tenet of Austrian economic theory.” The
Austrian theory is based on the economics of the capital structure and the dis-
tinction between true interest rate signals which generate economic develop-
ment and false interest-rate signals which generate business cycles. Under-
standing the giant skyscraper as a manifestation of the business cycle and
thus understanding how price and interest rate signals can distort the struc-
ture of production in the economy into bad investments and improperly allo-
cated labor might go a long way toward improving economists’ understanding
of business cycles and their cures.
19
Unfortunately, the theory is blind in the
sense that it offers no way of knowing if the actual rate of interest is above or
below the so-called natural rate and therefore it offers little in the way of exact
prediction. It should be clear that despite its good record of predictions, the
Skyscraper Index is not recommended as a remedy for this deficiency, but sim-
ply as a good illustration of the strengths of the Austrian theory of the busi-
ness cycle.
WHEN THE SKYSCRAPER INDEX IS WRONG?
No index or predictor is perfect, and the skyscraper index as presented by
Andrew Lawrence has a far from perfect record. First, as noted by Lawrence,
the skyscraper index failed to predict in the case of the Woolworth building in
1913. Second, the index did not predict in the case of Japan which has suffered
a rolling recession since 1990. Lawrence did not mention this presumably
70 THE QUARTERLY JOURNAL OF AUSTRIAN ECONOMICS VOL. 8, NO. 1 (SPRING 2005)
19
See for example Eichengreen and Mitchener (2003) for an excellent analysis of the
Great Depression by neoclassical standards. However, their desire to count and their fail-
ure to incorporate capital structure leaves them with an incomplete analysis and their
admittedly weak proposals for reform such as preempting the boom and eliminating fraud
and abuse.
because none of the recessionary periods in Japan were extraordinary, only
their cumulative impact. Third, the skyscraper index did not predict the stock
market crash in the NASDAQ stock market although this did occur after his
article was published and has not yet resulted in what the consensus views as
a severe downturn in the economy.
20
Nor were there any “predictions” of the
severe downturns of 1920–21, 1937–38, and 1980–81. The skyscraper index is
primarily an index that predicts
severe
changes in the economy, although it
might be possible to improve and refine the data to predict business cycles of
various magnitudes.
The primary counterexample to the competence of the skyscraper index is
the Woolworth Building. This project was announced in March of 1910, but at
first it was planned to be a “modestly tall” building. In November of 1910 its
projected height was increased, but it was still only slated to become the third
tallest building in the world. In January of 1911 the building was re-planned
to become one of the tallest buildings in the world at 750 feet, but latter this
figure was raised still higher to more than 792 feet high (Landau and Condit
1996, pp. 381–82). The opening ceremonies for the Woolworth Building were
held on the night of April 24th, 1913 although it was not fully completed until
latter (p. 390). The economy peaked and began its contraction in the first
quarter of 1913 and continued to contract until the fourth quarter of 1914.
This contraction included the third worst quarterly decline in real GNP
between 1875 and 1918, and was worse than any quarterly performance
between 1946 and 1983. We should also add that the founding of the Federal
Reserve System in 1913 and the coming of World War I in Europe in 1914 did
much to provide short-term stabilization for the American economy and to
shorten the life of the contraction.
21
Therefore, it would seem that the Wool-
worth Building was not a complete exception or error of the skyscraper index,
after all. It could simply be that the intervention of World War I did not pro-
vide ample time for the economic slump to deepen and receive the historical
label (e.g., “Depression of 1913”) that would have kept it in our historical con-
sciousness. Also, it is worth noting that the completion of the Masonic Tem-
ple in Chicago, (the first building to exceed 300 feet) in 1892 was preceded
by the beginning of the largest swing (contraction) in recorded U.S. history,
culminating in the largest quarterly decline in real GNP in our history and
was followed by the Panic of 1893. Likewise the completion of the Park Row
Building in 1898—the world’s tallest building—was preceded by the fourth
SKYSCRAPERS AND BUSINESS CYCLES 71
20
This is not entirely true, as Pesek (1999b, p. 14) reported that a new “world’s tallest
building” was announced well before the crash/recession began in the spring of 2000, but
plans were put on the shelf.
21
A case could be made that these two events rank as two of the most economically
destructive of the century, at least by those who oppose inflation and war and by those
who link America’s entry into, and the results of, World War I as the cause of World War
II.
largest quarterly decline in real GNP over the period of 1875–1918 and is
sometimes called the Panic of 1897.
22
A reexamination of the evidence suggests that the skyscraper index is a
better predictor than first formulated by Lawrence (1999). Obviously this
does not suggest that building heights should be used as a guide to fiscal and
monetary policy or that skyscraper heights should be limited to prevent eco-
nomic crisis. It does however lend additional standing to the Austrian theory
of the business cycle.
23
Furthermore, it does suggest that both the cause of
skyscrapers reaching new heights and severe business cycles are related to
instability in debt financing and that the institutions that regulate debt financ-
ing should be reevaluated, if not replaced with more efficient and stabilizing
institutions.
R
EFERENCES
Abraham, Jesse M., and Patric H. Hendershott. 1994. “Bubbles in Metropolitan Housing
Prices.”
NBER Working Paper
No. 4774. Cambridge, Mass.: National Bureau of Eco-
nomic Research (June).
Atack, Jeremy, and Robert A. Margo. 1996. “‘Location, Location, Location!’ The Market for
Vacant Urban Land: New York 1835–1900.”
NBER Historical Paper
91. Cambridge,
Mass.: National Bureau of Economic Research.
Barth, James R., Michael D. Bradley, Joseph A. McKenzie, and G. Stacy Sirmans. 1988.
“Stylized Facts About Housing and Construction Activity During the Post-World War
II Period.” In
Real Estate Market Analysis: Methods and Applications
. John M. Clapp
and Stephen D. Messner, eds. New York: Praeger. Pp. 215–35.
Bernanke, Ben S. 2003. “A Perspective on Inflation Targeting.”
Remarks to the Annual
Washington Policy Conference of the National Association of Business Economists
.
Washington, D.C. (March 25). />2003/200030325/default.htm.
Cochran, John P., and Fred R. Glahe. 1999.
The Hayek-Keynes Debate: Lessons for Cur-
rent Business Cycle Research.
Lewiston, N.Y.: Edwin Mellon Press.
Colwell, Peter F., and Roger E. Cannaday. 1988. “Trade-Offs in the Office Market.” In
Real
Estate Market Analysis: Methods and Applications
. John M. Clapp and Stephen D.
Messner, eds. New York: Praeger. Pp. 172–91.
Cowen, Tyler, and Alexander Tabarrok. 1995. “Good Grapes and Bad Apples: Applying the
Alchian and Allen Theorem.”
Economic Inquiry
33, no. 2 (April): 253–56.
72 THE QUARTERLY JOURNAL OF AUSTRIAN ECONOMICS VOL. 8, NO. 1 (SPRING 2005)
22
See Zarnowitz (1992, pp. 80-81) for estimates of quarterly changes in real gross
national product, 1875–1983.
23
For a comparison of Austrian business cycle theory with many of the competing
business cycle theories see Zijp (1993), Cochran and Glahe (1999), and Garrison (2001).
Eichengreen, Barry, and Kris Mitchener. 2003. “The Great Depression as a Credit Boom
Gone Wrong.”
Bureau of International Settlements Conference Paper
(March).
Ekelund, Robert B., and Mark Thornton. 1992. “The Union Blockade Versus Demoraliza-
tion of the South: Relative Prices in the Confederacy.”
Social Science Quarterly
73, no.
4 (December): 890–902.
Garrison, Roger W. 2001.
Time and Money: The Macroeconomics of Capital Structure.
London: Routledge.
Glaeser, Edward L., and Jesse M. Shapiro. 2001. “Cities and Welfare: The Impact of Ter-
rorism on Urban Form.”
NBER Working Paper
No. 8696. Cambridge, Mass.: National
Bureau of Economic Research (December).
Goolsbee, Austan. 1998. “Taxes and the Quality of Capital.”
NBER Working Paper
No.
6731. Cambridge, Mass.: National Bureau of Economic Research (September). Cur-
rent version is August 2000 and is forthcoming in the
Journal of Public Economics
.
Granitsas, Alkman. 1999. “The Height of Hubris: Skyscrapers Mark Economic Bust.”
Far
Eastern Economic Review
162, no. 6 (February 11): 47.
Grant, James. 1996.
The Trouble with Prosperity: The Loss of Fear, the Rise of Specula-
tion, and the Risk to American Savings
. New York: Random House.
Greenspan, Alan. 2003. “Testimony of Chairman Alan Greenspan: Aging Global Popula-
tion.” Before the Special Committee on Aging, U.S. Senate, February 27.
Hendershott, Patric H., and Edward J. Kane. 1992. “Causes and Consequences of the
1980s Commercial Construction Boom.”
Journal of Applied Corporate Finance
5, no.
1 (Spring): 61–70.
Hershey, Robert D., Jr. 1995. “U.S. Farms Out Compiling of Leading Indicators.”
New York
Times
(September 8): D1.
Hoyt, Homer. 1933.
One Hundred Years of Land Values in Chicago: The Relationship of
the Growth of Chicago to the Rise in Its Land Values, 1830–1933
. Chicago: University
of Chicago Press.
Huxtable, Ada Louise. 1992.
The Tall Building Artistically Reconsidered: The Search for a
Skyscraper Style.
Berkeley: University of California Press.
Investors’ Business Daily
. 1999. Editorial: “Edifice Complex.”
Investors’ Business Daily
(May 6).
Kim, Sukkoo. 2002. “The Reconstruction of the American Urban Landscape in the Twen-
tieth Century.”
NBER Working Paper
No. 8857. Cambridge, Mass.: National Bureau
of Economic Research (April).
Koretz, Gene. 1999. “Do Towers Rise Before a Crash?”
Economic Trends
,
Business Week
(May 17): 26.
Landau, Sarah Bradford, and Carl W. Condit. 1996.
Rise of the New York Skyscraper,
1865–1913.
New Haven, Conn.: Yale University Press.
Lawrence, Andrew. 1999. “The Curse Bites: Skyscraper Index Strikes.”
Property Report,
Dresdner Kleinwort Benson Research
(March 3).
SKYSCRAPERS AND BUSINESS CYCLES 73
———. 1999a. “The Skyscraper Index: Faulty Towers!”
Property Report, Dresdner Kleinwort
Benson Research
(January 15).
Lucas, Robert E., Jr. 1987.
Models of Business Cycles.
New York: Basil Blackwell.
McCulloch, J.H. 1981. “Misintermediation and Macroeconomic Fluctuations.”
Journal of
Monetary Economics
8: 103–15.
Pesek, William, Jr. 1999a. “Want to Know Where the Next Disaster Will Hit? Look Where
the World’s Biggest Skyscraper’s Going Up.”
Barron’s
(May 17): MW11.
———. 1999b. “To the Sky: Does Chicago Skyscraper Augur a U.S. Market Crash?”
Barron’s
79, no. 39 (September 27): 14.
Roll, Richard. 1992. “Volatility in U.S. and Japanese Stock Markets: A Symposium.”
Jour-
nal of Applied Corporate Finance
5, no. 1 (Spring): 29–33.
Rothbard, Murray N. 1984. “The Federal Reserve as a Cartelization Device.” In
Money in
Crisis: the Federal Reserve, the Economy, and Monetary Reform
. Barry N. Siegel, ed.
San Francisco: Pacific Institute for Public Policy Research and Cambridge, Mass.:
Ballinger.
Selgin, George. 1992. “Bank Lending ‘Manias’ in Theory and History.”
Journal of Financial
Services Research
6: 169–86.
Shiller, Robert. 1992. “Volatility in U.S. and Japanese Stock Markets: A Symposium.”
Jour-
nal of Applied Corporate Finance
5, no. 1 (Spring): 25–29.
Sobel, Russell S., and Thomas A. Garrett. 1997. “Taxation and Product Quality: New Evi-
dence from Generic Cigarettes.”
Journal of Political Economy
105, no. 4 (August):
880–87.
Thornton, Mark. 1998. “Richard Cantillon and the Origins of Economic Theory.”
Journal
of Economics and Humane Studies
8, no. 1 (March): 61–74.
———. 1991a.
The Economics of Prohibition.
Salt Lake City: University of Utah Press.
———. 1991b. “Alcohol Prohibition was a Failure.”
Policy Analysis
No. 157. Washington,
D.C.: Cato Institute.
Willis, Carol. 1995.
Form Follows Finance: Skyscrapers and Skylines in New York and
Chicago.
New York: Princeton Architectural Press.
Zarnowitz, Victor. 1992.
Business Cycles: Theory, History, Indicators, and Forecasting.
Chicago: University of Chicago Press.
Zijp, Rudy van. 1993.
Austrian and New Classical Business Cycle Theories: A Comparative
Study Through the Method of Rational Construction.
Brookfield, Vt.: Edward Elgar.
74 THE QUARTERLY JOURNAL OF AUSTRIAN ECONOMICS VOL. 8, NO. 1 (SPRING 2005)