Severe ozone air pollution in the Persian Gulf region pdf
Bạn đang xem bản rút gọn của tài liệu. Xem và tải ngay bản đầy đủ của tài liệu tại đây (7.22 MB, 14 trang )
Atmos. Chem. Phys., 9, 1393–1406, 2009
www.atmos-chem-phys.net/9/1393/2009/
© Author(s) 2009. This work is distributed under
the Creative Commons Attribution 3.0 License.
Atmospheric
Chemistry
and Physics
Severe ozone air pollution in the Persian Gulf region
J. Lelieveld
1,2
, P. Hoor
2
, P. J
¨
ockel
2
, A. Pozzer
1
, P. Hadjinicolaou
1
, J P. Cammas
3
, and S. Beirle
2
1
Energy, Environment and Water Research Centre, The Cyprus Institute, 20 Kavafi Street, 1645 Nicosia, Cyprus
2
Max Planck Institute for Chemistry, Becherweg 27, 55128 Mainz, Germany
3
Observatoire Midi-Pyr
´
en
´
ees, CNRS – Laboratoire d’A
´
erologie, 14 Avenue E. Belin, 31400 Toulouse, France
Received: 8 August 2008 – Published in Atmos. Chem. Phys. Discuss.: 29 September 2008
Revised: 23 January 2009 – Accepted: 16 February 2009 – Published: 20 February 2009
Abstract. Recently it was discovered that over the Middle
East during summer ozone mixing ratios can reach a pro-
nounced maximum in the middle troposphere. Here we ex-
tend the analysis tothe surface and show that especially in the
Persian Gulf region conditions are highly favorable for ozone
air pollution. We apply the EMAC atmospheric chemistry-
climate model to investigate long-distance transport and the
regional formation of ozone. Further, we make use of avail-
able in situ and satellite measurements and compare these
with model output. The results indicate that the region is
a hot spot of photochemical smog where European Union
air quality standards are violated throughout the year. Long-
distance transports of air pollution from Europe and the Mid-
dle East, natural emissions and stratospheric ozone conspire
to bring about relatively high background ozone mixing ra-
tios. This provides a hotbed to strong and growing indige-
nous air pollution in the dry local climate, and these condi-
tions are likely to get worse in the future.
1 Introduction
Ozone (O
3
) plays a key role in atmospheric oxidation pro-
cesses and photochemical air pollution. Although there is no
general consensus about the critical levels for human health,
environment agencies concur that 8-hourly levels in excess
of 50–60ppbv and a 1-hourly average of ∼80 ppbv consti-
tute health hazards (Ayres et al., 2006). Whereas high peak
values are of particular importance for human health, perma-
nent exposure to lower levels is also problematical (Bell et
al., 2006). Furthermore, ambient mixing ratios of about 40
Correspondence to: J. Lelieveld
()
ppbv for extended periods of several months cause crop loss
and damage to natural ecosystems (Emberson et al., 2003).
Ozone is a secondary pollutant, formed during the oxida-
tion of reactive carbon compounds and catalyzed by nitro-
gen oxides (NO
x
=NO+NO
2
), driven by ultraviolet sunlight.
Conditions typically found in the subtropics are conducive
for the formation of photochemical smog, and background
ozone levels over the subtropical Atlantic have been ob-
served to increase strongly by ∼5 ppbv/decade (Lelieveld et
al., 2004). In the Mediterranean region the European Union
phytotoxicity limit of 40 ppbv and the health protection limit
of 55 ppbv are often exceeded (Kouvarakis et al., 2002; Ribas
and Pe
˜
nuelas, 2004), which causes tens of thousands of pre-
mature mortalities per year (Gryparis et al., 2004; Duncan et
al., 2008).
In a study of vertical ozone profiles in the Middle East
Li et al. (2001) used a chemistry-transport model and pre-
dicted a regional summertime O
3
maximum in the middle
troposphere in excess of 80 ppbv. Satellite measurements
of tropospheric NO
2
confirm that O
3
precursor concentra-
tions can be high in this area (van der A, 2008; Stavrakou et
al., 2008). Li et al. (2001) concluded that transport from the
stratosphere does not contribute significantly to the O
3
max-
imum. Yet, a study of stratosphere-troposphere exchange
(STE) over the eastern Mediterranean indicates that cross-
tropopopause transport can be intense, related to the distinct
summertime meteorological conditions over South Asia and
the Arabian Peninsula (Traub and Lelieveld, 2003).
Here we advance these investigations by applying the
EMAC atmospheric chemistry-general circulation model that
represents STE processes as well as the large-scale transport
and photochemistry of air pollution (Roeckner et al., 2006;
J
¨
ockel et al., 2006). Our focus is on the Persian Gulf re-
gion, located downwind of major pollution areas and with
Published by Copernicus Publications on behalf of the European Geosciences Union.
1394 J. Lelieveld et al.: Severe ozone air pollution in the Persian Gulf region
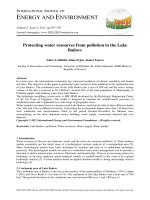
Fig. 1. Satellite image of the Persian Gulf region by the Moder-
ate resolution Imaging Spectroradiometer taken on 17 April 2006,
showing thin clouds and desert dust transported from the west
(NASA Visible Earth).
substantial and growing local sources. It should be noted
that this region is also subject to aerosol pollution, including
desert dust (Fig. 1), though here we concentrate on ozone
and the meteorological conditions that promote photochemi-
cal air pollution.
2 EMAC model description
The numerical model simulations have been performed with
the 5th generation European Centre – Hamburg general cir-
culation model (GCM), ECHAM5 (Roeckner et al., 2006)
coupled to the Modular Earth Submodel System, MESSy
(J
¨
ockel et al., 2006), applied to Atmospheric Chemistry
(EMAC). The model includes a comprehensive representa-
tion of tropospheric and stratospheric dynamical, cloud, ra-
diation, multiphase chemistry and emission-deposition pro-
cesses. We applied the model at T42 resolution, being about
2.8
◦
in latitude and longitude. In addition we performed
a simulation at T106 (∼1.1
◦
) for the months June–August
2006 to test the sensitivity of the results to the model resolu-
tion. The vertical grid structure resolves the lower and mid-
dle atmosphere with 90 layers from the surface to a top layer
centered at 0.01hPa (Giorgetta et al., 2006). The average
midpoint of the lowest layer is at 30m altitude (terrain fol-
lowing sigma coordinates) and the lower 1.5km of the model
(up to 857 hPa) is represented by five layers.
This model configuration was selected because it explic-
itly represents stratosphere-troposphere interactions and in-
cludes a comprehensive representation of atmospheric chem-
istry, and also because it has been extensively tested and doc-
umented. The conclusion from the comprehensive model
evaluation by J
¨
ockel et al. (2006) was that in spite of mi-
nor shortcomings, mostly related to the relatively coarse T42
resolution and the neglect of inter-annual changes in biomass
burning emissions, the main characteristics of the trace gas
distributions are generally reproduced well.
The chemistry calculations are performed using a ki-
netic preprocessor to describe a set of 177 gas phase,
57 photo-dissociation and 81 heterogeneous tropospheric
and stratospheric reactions (Sander et al., 2005). De-
tails of the chemical mechanism (including reaction rate
coefficients and references) can be found in the elec-
tronic supplement ( />2005/acp-5-445-2005.html). The model also carries a tracer
for stratospheric ozone (O
3
s), which enables a comparison
with O
3
that is photochemically formed within the tropo-
sphere (J
¨
ockel et al., 2006). The O
3
s tracer is set to O
3
throughout the stratosphere and follows the transport and de-
struction processes of ozone in the troposphere, however,
is not recycled through NO
x
chemistry (including titration
by NO and recycling into O
3
). If O
3
s re-enters the strato-
sphere it is re-initialized at stratospheric values (Roelofs and
Lelieveld, 1997).
A more detailed description and a discussion of how
well our GCM represents stratosphere-troposphere exchange
(STE) processes and their dependence on resolution can be
found in Kentarchos et al. (2000). STE is forced by the large-
scale dynamics (wave forcing) which is well resolved by the
model at T42. Further improvements are reported by Gior-
getta et al. (2006) who increased the vertical resolution of the
model, as used in the present study. Sensitivity simulations
by Kentarchos et al. (2000) indicate that at higher horizontal
resolution (i.e. T63) the STE flux may be about 10% larger
than at T42, whereas further resolution increases (i.e. T106)
do not lead to additional STE flux changes. Kentarchos
et al. also reported excellent agreement between simulated
tropopause folding events and analyses of the European Cen-
tre for Medium-range Weather Forecasts (ECMWF).
For the representation of natural and anthropogenic emis-
sions and dry deposition of trace species, including microme-
teorological and atmosphere-biosphere interactions, wet de-
position by different types of precipitation, and multiphase
chemistry processes we refer to the detailed descriptions
by Ganzeveld et al. (2006), Kerkweg et al. (2006), Tost
et al. (2006) and additional articles in a special issue of
Atmos. Chem. Phys. ( />special issue22.html). The results of the tropospheric and
stratospheric chemistry calculations, using a number of di-
agnostic model routines, have been compared to in situ and
remote sensing measurements (J
¨
ockel et al., 2006; Lelieveld
et al., 2007; Pozzer et al., 2007).
The model has been nudged towards actual meteorologi-
cal conditions for the year 2006 based on operational analy-
ses of the ECMWF. A Newtonian relaxation term has been
added to the prognostic variables for vorticity, divergence,
Atmos. Chem. Phys., 9, 1393–1406, 2009 www.atmos-chem-phys.net/9/1393/2009/
J. Lelieveld et al.: Severe ozone air pollution in the Persian Gulf region 1395
10°W 0° 10°E 20°E 30°E 40°E 50°E 60°E
Longitude
50°N
40°N
30°N
20°N
Latitude
10
8
6
4
2
0
x10
15
Tropospheric NO in molecules/cm
2
2
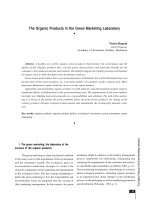
Fig. 2. SCIAMACHY satellite image of tropospheric NO
2
columns, averaged over 2003–2007, showing several hot spots over major cities
in the Middle East and in particular around the Persian Gulf.
temperature and surface pressure (Lelieveld et al., 2007). We
avoid inconsistencies between our GCM and the ECMWF
boundary layer representations by leaving the lowest three
model levels free (apart from surface pressure), while the
nudging increases stepwise in four levels up to about 700 hPa
and tapers off to zero at 200 hPa. The nudging coefficients
are chosen to be small to allow maximum internal consis-
tency in the model calculations of meteorological processes.
3 Anthropogenic NO
x
emissions
The database of anthropogenic emissions used as boundary
conditions in the EMAC model is EDGAR 3.2 (fast track)
(van Aardenne et al., 2005; Ganzeveld et al., 2006). It seems
likely that emissions of ozone precursors, most importantly
of NO
x
, are fairly well constrained for Europe and the North
America, but possibly less well for many other regions in-
cluding the Middle East. In Table 1 we present the EDGAR
3.2 emissions of NO
x
in the Middle East, referring to the year
2000.
The main NO
x
source category is transport (59%), being
dominated by road traffic, except in the United Arab Emi-
rates (UAE) where emissions from international shipping are
largest. The second and third most important NO
x
emission
categories are power generation and industry, respectively.
Biomass burning is only a minor source. The countries with
the strongest NO
x
sources in the region are Iran, Turkey,
the UAE and Saudi Arabia. To put these data into perspec-
tive, we may compare the Middle East with North Amer-
ica (population of both regions ∼350 million) which releases
about 22000Gg/yr (as NO
2
) (compared to 6700Gg/yr in the
Middle East). The EDGAR 3.2 NO
x
emissions for Califor-
nia, which has a similar size and population as the Gulf re-
gion, amount to 1320Gg/yr. In California power generation
contributes 14%, transport 66% and industry 16%, indicat-
ing that the fractional contributions by source sector are not
strongly different than in the Middle East, although transport
is even more dominant.
Although we have no means to quantitatively test the
EDGAR 3.2 emission database for the region of interest,
Fig. 2 presents Scanning Imaging Absorption Spectrome-
ter for Atmospheric Chartography (SCIAMACHY) satellite
data of tropospheric NO
2
vertical column densities for the
Mediterranean and the Middle East in the period 2003–2007,
obtained at a resolution of approximately 30×60 km
2
. These
NO
2
column densities have been retrieved with the spec-
tral analysis method of Leue et al. (2001), and the further
processing and testing against ground-based remote sensing
measurements in polluted air have been described by Chen et
al. (2008).
Because of the short lifetime of NO
2
(about one day) it
is detected by SCIAMACHY close to the NO
x
sources, and
these measurements provide an indication of the emission
strengths. Remarkably, several locations in the Middle East
are characterized by much higher NO
2
column densities than
major cities in Europe such as Paris, Madrid, Athens and
Istanbul. The NO
2
columns may be compared with those
in the Milan Basin (Fig. 2), a region notorious for poor air
quality (Neftel et al., 2002). Especially Riyadh, Jeddah,
Bahrain, the region Dhahran-Dammam-Al Jubayl, Dubai,
Kuwait, Tehran, Esfahan, and to a lesser extent Cairo and
Tel Aviv can be clearly identified as strong NO
x
sources.
This is especially noteworthy considering that the lifetime
of NO
2
in the Middle East is shorter than in Europe because
the geographical location is highly favorable for the forma-
tion of hydroxyl (OH) radicals that rapidly transform NO
2
into nitric acid. The OH is formed by the photodissociation
of ozone in the presence of water vapor, and is catalytically
recycled by NO
x
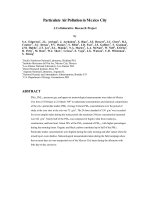
. In Fig. 3 we present the observed upward
tendencies of NO
2
and lower tropospheric O
3
in several loca-
tions around the Gulf derived from SCIAMACHY data and
www.atmos-chem-phys.net/9/1393/2009/ Atmos. Chem. Phys., 9, 1393–1406, 2009
1396 J. Lelieveld et al.: Severe ozone air pollution in the Persian Gulf region
Table 1. NO
x
emissions in the Middle East (in Gg NO
2
/year) from EDGAR 3.2.
Power Residential Transport
a
Industry
b
Biomass Total
generation biofuel use burning
c
Egypt 158 75 444 143 − 820
UAE 82 1 853 35 − 971
Bahrain 25 1 24 19 − 69
Cyprus 10 − 27 6 1 44
Iran 325 33 711 204 18 1291
Iraq 53 15 299 42 − 409
Israel 141 − 163 30 4 338
Jordania 20 3 38 12 − 73
Kuwait 62 − 54 22 − 138
Lebanon 15 2 29 13 − 59
Oman 24 1 28 6 − 59
Qatar 75 − 22 14 − 111
S−Arabia 169 4 625 149 8 955
Syria 68 8 147 36 6 265
Turkey 251 − 409 260 66 986
Yemen 5 9 53 42 − 109
Total 1483 152 3926 1033 103 6697
% of total 22% 2% 59% 15% 2% 100%
a
All transport sectors on land, air and sea.
b
Including oil/iron/steel production, non-ferro, pulp and paper, construction, waste incineration.
c
Forest and savanna fires, agricultural waste burning.
MOZAIC aircraft measurements (see Sect. 4). It thus appears
that NO
x
emissions in the Middle East are growing rapidly so
that it is conceivable that the EDGAR 3.2 emission database,
referring to the year 2000, and therefore our model underes-
timate regional NO
x
levels for the year 2006.
4 Model results compared to observations
Whilst the model has been extensively tested in many ap-
plications, an ozone measurement database for the Middle
East is to a large degree lacking. For the free troposphere
we use ozone measurements of the MOZAIC program (Mea-
surements of Ozone and Water Vapor by In-service Airbus
Aircraft) (Thouret et al., 1998; Zbinden et al., 2006) (see
also It appears that
for 2000 and 2004 relatively extensive datasets are avail-
able from aircraft ascents and descents over Bahrain (26
◦
N,
50.5
◦
E), Dubai (25
◦
N, 55
◦
E), Kuwait (29
◦
N, 48
◦
E) and
Riyadh (24.5
◦
N, 46.5
◦
E), and we compare the measure-
ments with previous model output for these years (J
¨
ockel et
al., 2006). Figure 4 shows that the pronounced middle tropo-
spheric ozone maximum in summer (≥80 ppbv), which was
predicted by Li et al. (2001), is reproduced.
In addition we use the satellite measurements of tropo-
spheric ozone by the Tropospheric Emission Spectrometer
(TES) on the AURA satellite (Worden et al., 2007; Osterman
et al., 2008). The comparison of daily TES observations (ver-
sion 2) to ozone soundings indicated a mean positive bias of
3-9 ppbv in the lower troposphere (Nassar et al., 2008). In
our study we compare daily level 3 data (version 3) to EMAC
model output. The EMAC data are interpolated in space and
time to the geolocations of the satellite after evaluating the
ozone quality flag of the TES data. EMAC profiles are re-
gridded to the vertical resolution of the TES retrieval levels,
and the averaging kernel for each individual TES profile is
applied to the corresponding EMAC profile. The available
(remaining) number of profiles after applying the TES qual-
ity flags is about 1500 per day, which are compared to the
EMAC data on the same horizontal and vertical grid.
Figure 5 compares the TES data to our model results,
representative for three levels in the troposphere between
908.5 and 261 hPa over the Persian Gulf region. The indi-
vidual TES data points produce a similar variability as the
EMAC model results. Considering the difference in reso-
lution and because the model nudging to ECMWF analy-
ses approximates and not mimics meteorological conditions,
ideal agreement cannot be expected. From the agreement
between the mean mixing ratios and the probability density
functions we conclude that the model adequately represents
atmospheric chemistry conditions in the Gulf region.
Atmos. Chem. Phys., 9, 1393–1406, 2009 www.atmos-chem-phys.net/9/1393/2009/
J. Lelieveld et al.: Severe ozone air pollution in the Persian Gulf region 1397
NO (10 molec/cm )
15
2
2
Dubai (25°N, 55°E)
Dhahran
(26°N, 50°E)
10
9
8
7
6
5
80
70
60
50
40
30
20
O (ppbv)
3
2003 2004 2005 2006 2007
Year
1998 2000 2002 2004
Year
Tropospheric column density
1000-3000 m altitude
Fig. 3. Top: Annual mean column densities of NO
2
over Dubai
and Dhahran (within a radius of 0.5
◦
around the cities) derived
from SCIAMACHY satellite data. The linear upward trends are 6.4
and 3.9×10
14
molecules/cm
2
/year, respectively. Bottom: individ-
ual data points of ozone over Kuwait, Dubai, Dhahran and Riyadh
obtained by MOZAIC aircraft measurements between 1 and 3 km
altitude. The linear upward trend is 1.57±0.57(1σ ) ppbv/year (level
of statistical significance is 99%).
5 Meteorology
The large-scale Hadley circulation, driven by deep tropical
cumulonimbus cloud formation and intense precipitation, is
accompanied by descent in the subtropics. In the winter
hemisphere the Hadley cell is most pronounced, which is as-
sociated with the relatively strong meridional heating gradi-
ent. The low level flow in the subtropics is characterized by
vast anticyclones, which occupy about 40% of the Earth’s
surface (Rodwell and Hoskins, 2001).
The Middle East, being under the downward branch of the
Hadley circulation, is among the warmest and driest in the
world. From a space perspective, the atmospheric radiation
140
120
100
80
60
40
20
ppbv ozone
5000-7000 m altitude
Jan Feb Mar Apr May Jun Jul Aug Sep Oct Nov Dec
2000
160
120
80
40
0
ppbv ozone
5000-7000 m altitude
Jan Feb Mar Apr May Jun Jul Aug Sep Oct Nov Dec
2004
Fig. 4. Compilation of MOZAIC aircraft measurements over
Bahrain, Dubai, Kuwait and Riyadh compared to model calculated
O
3
in the middle troposphere over the Middle East. The black cir-
cles indicate the individual measurement data points, the red solid
lines the monthly mean measured O
3
, the solid green lines the
monthly mean modeled O
3
and the dashed lines the monthly stan-
dard deviations.
budget is negative, i.e. the region radiates more infrared ra-
diation than it receives sunlight (Vardavas and Taylor, 2007).
The net radiative cooling to space is balanced by entrainment
of high-energy air in the upper troposphere while low-energy
air is detrained near the surface. The compensating descent
reduces the relative humidity, which leads to the evaporation
of clouds and the suppression of rain.
Rodwell and Hoskins (1996) argue that during summer in
the eastern Mediterranean and eastern Sahara region a tele-
connection with the Asian monsoon plays a key role, al-
though it is yet unclear how this affects the Arabian Penin-
sula and the Persian Gulf region. The monsoon convection,
centered over eastern India, acts as a remote dynamic forcing
which is enhanced by radiative cooling in the subsidence re-
gion, a positive feedback that adds to the drying. Considering
www.atmos-chem-phys.net/9/1393/2009/ Atmos. Chem. Phys., 9, 1393–1406, 2009
1398 J. Lelieveld et al.: Severe ozone air pollution in the Persian Gulf region
908.5-261 hPa
908.5-681 hPa
120
100
80
60
40
20
20 40
60 80 100 120
O model (ppbv)
O observations (ppbv)
3
3
O (ppbv)
3
0 40 80 120
TES
EMAC
0.24
0.20
0.16
0.12
0.08
0.04
0.0
Fig. 5. Compilation of TES satellite observations compared to
EMAC model calculated O
3
in the troposphere in the region of 25–
30
◦
N latitude and 45–55
◦
E longitude in the year 2006. Left: cor-
relation plot in which the solid line indicates ideal agreement. The
red symbols highlight the O
3
mixing ratios at the lowest altitude
level resolved by TES. Right: probability density functions.
that the tropics are expanding (Seidel et al., 2008) and the
Asian monsoon will intensify under the influence of global
warming (IPCC, 2007), it may be expected that subsidence
and dryness over the eastern Mediterranean and the Middle
East will increase, being a robust finding of climate modeling
(Giorgi and Bi, 2005; Held and Soden, 2006; Diffenbaugh et
al., 2007; Sun et al., 2007).
In summer the hot desert conditions give rise to a heat low
with cyclonic flow over the southern Arabian Peninsula. In
the south the circulation is reinforced by the summer mon-
soon that carries air from East Africa. Over the Persian Gulf
it converges with the northwesterly flow from the Mediter-
ranean. The latter carries European air pollutants southward
to North Africa and the Middle East (Kallos et al., 1998;
Lelieveld et al., 2002; Stohl et al., 2002; Duncan et al., 2004).
In winter the Atlantic westerlies carry relatively clean air
masses over the Mediterranean towards the Gulf. From the
autumn to spring winds over the Gulf are more variable than
in summer, nevertheless often carrying air masses southward,
e.g. from Iran. Occasionally, storms carry desert dust plumes
over the region, though during the winter wet season the dust
and air pollution are reduced.
In summer the Asian monsoon surface trough and the Ara-
bian heat low are associated with anticyclones in the upper
troposphere. The tropical easterly jet stream at the south-
ern flank of the monsoon anticyclone is diverted toward the
eastern Mediterranean by the Arabian anticyclone (Barret et
al., 2008). Convergence of this flow with the polar front
jet stream accelerates the horizontal wind and increases the
horizontal and vertical wind shear, creating a jet streak and
tropopause folds (Traub and Lelieveld, 2003). An investiga-
tion of ECMWF analyses by Sprenger et al. (2003) shows
that tropopause folds preferentially occur in the subtropics
during summer, forming almost permanent features. This
demonstrates the occurrence of distinct maxima of cross-
tropopause transport in the region, e.g. over Turkey and
100
80
60
40
20
0
O , O s
3 3
ppbv
260
220
180
140
100
ppbv
CO
2.4
2.0
1.6
1.2
0.8
0.4
0
ppbv
PAN
c
b
a
2.4
2.0
1.6
1.2
0.8
0.4
0
ppbv
NO , NO
2
d
Jan Feb Mar Apr May Jun Jul Aug Sep Oct Nov Dec
2006
Fig. 6. Model calculated O
3
, CO, PAN and NO
x
near the surface in
the region of 25–30
◦
N and 45–55
◦
E. In the top panel the red line
indicates the contribution by O
3
transported from the stratosphere
(O
3
s).
Afghanistan, associated with the northern edge of the mon-
soon anticyclone. The tropopause folding events carry ozone
from the stratosphere and these air masses descend over the
eastern Mediterranean and the Middle East.
6 Regional ozone hot spot
Figure 6a shows the daily and annual profiles of ozone near
the surface over the Persian Gulf, averaged over a region of
5
◦
latitude and 10
◦
longitude, i.e. an area of about 0.5 million
km
2
(comparable to the size of California). Figure 6a also
shows the contribution by ozone transported from the strato-
sphere (O
3
s). It thus appears that most of the ozone is formed
photochemically within the troposphere, although the con-
tribution by O
3
s is non-negligible. In winter the mean diel
O
3
variation is about 10–15 ppbv, related to photochemical
ozone formation during daytime and titration by NO emis-
sions and dry deposition in the nocturnal boundary layer. In
summer the diel variation is larger, 20–30 ppbv, owing to the
rapid formation during daytime.
Atmos. Chem. Phys., 9, 1393–1406, 2009 www.atmos-chem-phys.net/9/1393/2009/
J. Lelieveld et al.: Severe ozone air pollution in the Persian Gulf region 1399
ppbv O
80
70
60
50
40
Surface ozone, July-August 2006
3
Fig. 7. Model calculated mean surface O
3
in excess of 40 ppbv
averaged over the period July–August 2006, highlighting the sub-
tropical band of ozone smog and pronounced hot spots over the Los
Angeles and Persian Gulf regions.
The annual ozone minimum occurs in late December when
the intensity of sunlight is lowest, whereas the relative con-
tribution by STE is largest (∼30%). The regional ozone lev-
els are highest in summer, on average about 75 ppbv, while
daytime values often exceed 80ppbv. Note that these high
mixing ratios occur throughout the Gulf region, providing a
hotbed for local smog formation in urban and industrial ar-
eas. Importantly, the diel mean O
3
mixing ratios substan-
tially exceed 40 ppbv throughout the year, hence the EU air
quality standard for phytotoxicity is permanently violated.
Furthermore, the EU health protection limit is strongly ex-
ceeded between February and October.
The average global distribution of O
3
mixing ratios during
summer is shown in Fig. 7 and the regional monthly means in
Fig. 8, further illustrating that the Gulf region is a hot spot of
notoriously high ozone. Note that we use a color scale from
40–80 ppbv and upward to emphasize where air quality stan-
dards are violated. The mean wind vectors near the surface
indicate that the Gulf is downwind of air pollution sources in
the Mediterranean region and the Middle East.
Figure 6b presents the regional mixing ratios of carbon
monoxide (CO), being an indicator of air pollution. The
CO levels are generally high, comparable to industrialized
environments in Europe. A previous analysis of air pollu-
tion transports over the eastern Mediterranean showed that
during summer extensive fire activity north of the Black Sea
plays an important role (Lelieveld et al., 2002). The biomass
burning plumes are carried southward to the Mediterranean
and subsequently to the Middle East. The synoptic variabil-
ity of O
3
follows that of CO, i.e. on time scales of days to
weeks, which underscores that the ozone is to a large degree
produced in polluted air. The regional mean NO
x
levels are
between 1–1.5ppbv, close to the optimum of the ozone for-
mation efficiency per NO
x
molecule emitted.
Figure 6c shows peroxyacetylnitrate (PAN), a noxious pol-
lutant formed from hydrocarbons and NO
x
. The synoptic
variability of PAN correlates with both CO and O
3
, whereas
its seasonality anticorrelates with O
3
. PAN is decomposed
January
February
March
April
May
June
July
August
September
October
November
December
40 50 60 70 80 ppbv O
3
Fig. 8. Model calculated monthly mean surface O
3
in excess of
40 ppbv in the period January to December 2006. The arrows indi-
cate the mean surface winds.
thermally so that in summer its lifetime is short. On the
other hand, PAN builds up in winter, illustrated by the steep
increase in November and December. Because of its increas-
ing lifetime with decreasing temperature, PAN can act as a
reservoir species of NO
x
(Singh et al., 1998). It is formed
during transport from polluted regions upwind and can ther-
mally decompose over the relatively warm Gulf region where
it can add to ambient NO
x
levels.
Figure 6d shows that the mean NO
x
mixing ratio near the
surface in the Gulf region is rather constant throughout the
year, even though the boundary layer is deeper in summer
owing to the more dynamic convective mixing associated
with surface heating. The consequent summertime dilution
of local NO
x
emissions in the convective boundary layer ap-
pears to be compensated by a reduced trapping of NO
x
in
the reservoir gas PAN connected to its more efficient thermal
decomposition (Fig. 6c).
The transport and regional chemistry characteristics of
ozone and precursor gases give rise to year round high ozone
mixing ratios. Our model results suggest that in the en-
tire region from Riyadh to Dubai, during all seasons, a
www.atmos-chem-phys.net/9/1393/2009/ Atmos. Chem. Phys., 9, 1393–1406, 2009
1400 J. Lelieveld et al.: Severe ozone air pollution in the Persian Gulf region
Latitude
15°N 25°N 35°N 45°N
200
300
400
500
600
750
850
1000
Appr. pressure height (hPa)
JFM
AMJ
OND
100
95
90
85
80
75
70
65
60
55
50
45
40
35
30
25
ppbv
75
100
60
50
50
40
100
40
50
60
75
75
60
30
40
40
50
50
60
75
100
JFM
70
72
74
76
78
80
82
84
86
88
90
Model level
AMJ
Latitude
15°N 25°N 35°N 45°N
70
72
74
76
78
80
82
84
86
88
90
Model level
OND
100
90
80
70
60
50
40
30
20
10
ppbv
100
50
30
20
10
100
50
30
20
10
10
10
20
30
50
100
10
20
70
72
74
76
78
80
82
84
86
88
90
Model level
200
300
400
500
600
750
850
1000
Appr. pressure height (hPa)
200
300
400
500
600
750
850
1000
Appr. pressure height (hPa)
O
3 O s
3
200
300
400
500
600
750
850
1000
Appr. pressure height (hPa)
JAS
40
50
75
100
60
50
60
50
75
JAS
50
30
20
10
10
70
72
74
76
78
80
82
84
86
88
90
Model level
Fig. 9. Model calculated 3-monthly mean zonal and vertical dis-
tributions of O
3
(left) and O
3
originating in the stratosphere (O
3
s,
right) averaged over the 45–55
◦
E longitude belt.
distinct ozone maximum is located between the surface and
∼750 hPa (Fig. 9). Clearly the Gulf is a convergence re-
gion of long-distance transported air pollution, which fos-
ters strong local ozone formation by indigenous emissions of
NO
x
and reactive hydrocarbons in industrial and urban ar-
eas. The regional ozone maximum is most pronounced in
summer when the meteorological conditions are auspicious
for photo-smog.
7 Stratosphere-troposphere exchange
Although the contribution by STE to surface ozone may seem
limited it is interesting to examine its role throughout the tro-
pospheric column. Previously, Li et al. (2001) investigated
the middle tropospheric ozone maximum over the Middle
East in summer. At variance with Li et al. our model results
point to a significant role of STE (Fig. 9). Our results sug-
gest that in the Gulf region O
3
s contributes about two thirds
to the tropospheric ozone column in winter whereas this is
still about one quarter in summer. Nevertheless, we agree
with Li et al. that also in the middle and upper troposphere
in situ photochemical O
3
formation plays an important role,
O s (ppbv) 25°-30° North, JAS 2006
Longitude
160°W 60°W 40°E 140°E
3
200
300
400
500
600
750
850
1000
Appr. pressure height (hPa)
70
72
74
76
78
80
82
84
86
88
90
Model level
55
50
45
40
35
30
40
25
30
35
20
15
10
10
10
20
25
15
20
15
25
30
35
10
15
20
25
30
Fig. 10. Model calculated tropospheric O
3
originating in the strato-
sphere (O
3
s) averaged between 25–30
◦
N latitude in the period July
to September 2006.
and the anthropogenic component substantially contributes
to the radiative forcing of climate.
In fact, STE derived ozone penetrates remarkably far south
over the Middle East. Especially in winter and spring an O
3
s
maximum reaches deeply into the tropics in the lower free
troposphere. Interestingly, a second O
3
s maximum touches
the surface near the Gulf around 30
◦
N latitude, both in sum-
mer and winter. This corresponds to the results in Fig. 6a,
showing that the contribution of O
3
s is significant during the
entire year.
Figure 10 presents a global and longitudinal cross section
of O
3
s during summer, averaged between 25–30
◦
N latitude.
The influence of deep convection in the South Asian mon-
soon region, around 90
◦
E (near Mt. Everest), is apparent
from the relatively low O
3
s mixing ratios throughout the tro-
posphere. To the west, between about 500 and 600 hPa, two
O
3
s maxima appear, resulting from deep tropopause folding
events. In particular the one near 30
◦
E represents unusually
deep subtropical STE. Figure 10 illustrates that a tongue of
O
3
s reaches the surface over the Persian Gulf, unique in the
subtropics.
8 Comparison with other locations
A combination of factors thus contributes to the ozone maxi-
mum over the Gulf. To put this into perspective we compare
with other subtropical locations in both hemispheres.
Since our global model is not ideal for investigating local
urban and industrial conditions, we selected locations that are
representative of larger areas. The largest city in the world in
terms of surface area is Los Angeles, also notorious for high
ozone levels. Although the Los Angeles emissions of CO
per capita are among the highest in the world, its emission
normalized per surface area is the lowest of the 20 largest
Atmos. Chem. Phys., 9, 1393–1406, 2009 www.atmos-chem-phys.net/9/1393/2009/
J. Lelieveld et al.: Severe ozone air pollution in the Persian Gulf region 1401
cities (Gurjar et al., 2008). This is indicative of a relatively
widespread and uniform source distribution.
For our comparison we define a “greater Los Angeles
area” with a size close to a single grid cell in our model,
also encompassing some ocean area and surrounding cities
such as Pasadena, Riverside and San Bernardino. Similarly,
we define a “greater Bahrain area”, which includes a fraction
of the Gulf, part of Qatar and several coastal cities in Saudi
Arabia.
Figure 11 presents a comparison between these two pol-
luted areas and also to more rural locations in southern China
(Hunan), western Australia, and an area over the subtropical
Pacific near Midway, downwind of East Asia. None of these
regions is free of anthropogenic influence while the level of
O
3
decreases in the mentioned order (from the top down in
Fig. 11). Figure 11 shows that all of these subtropical lo-
cations, irrespective of their remoteness, have ozone mixing
ratios close to or in excess of the EU air quality standard for
phytotoxicity. This underscores the sensitivity of the sub-
tropical latitude belt to anthropogenic emissions.
The vicinity of these five locations to pollution sources is
illustrated by the amplitude of the diel ozone cycle. In Los
Angeles the local emissions are strongest, leading to a rapid
photochemical ozone build-up during the day and nighttime
titration by NO emissions. In Bahrain the diel amplitude is
smaller because the ambient ozone levels are more strongly
determined by long-distance transport. In Hunan and W-
Australia the diel ozone amplitude is increasingly smaller at
greater distance from strong NO
x
sources.
In marine environments such as Midway, with negligi-
ble local NO
x
sources, the diel ozone cycle is controlled by
upwind photochemical destruction during daytime and the
absence of photochemistry at night (de Laat and Lelieveld,
2000). The remoteness from NO
x
sources is also illustrated
by the seasonal cycle of ozone. In polluted environments the
season with the most intense sunlight is associated with the
strongest ozone production, whereas in remote low-NO
x
lo-
cations photochemical ozone loss prevails. Usually in sum-
mer the influence of STE becomes negligible (Fig. 11). How-
ever, this is not the case in the Gulf region.
Surprisingly, during summer the daily mean ozone mixing
ratios in Bahrain are similar to Los Angeles although daytime
peak levels can be higher in the latter. In winter Los Ange-
les is subject to westerly winds that carry unpolluted Pacific
air. Conversely, in Bahrain during winter ozone levels are
substantially higher, i.e. permanently in excess of 40 ppbv,
while the health hazardous level of 50–60ppbv is exceeded
between February and October, and the 80 ppbv level during
most of the summer. As mentioned in the previous section,
this is not only typical for Bahrain but rather for the entire
region.
140
100
60
20
Mixing ratio (ppbv)
0
140
100
60
20
140
100
60
20
140
100
60
20
140
100
60
20
Los Angeles
Bahrain
Hunan
W-Australia
Midway
Jan Feb Mar Apr May Jun Jul Aug Sep Oct Nov Dec
2006
Fig. 11. Model calculated surface mixing ratios of O
3
and O
3
s (red)
in the areas of Los Angeles (117–119
◦
W, 33–35
◦
N), Bahrain (50–
52
◦
E, 25–27
◦
N), Hunan in China (109–110
◦
E, 26–28
◦
N), West
Australia (118–120
◦
E, 26–28
◦
S) and the Pacific Midway Islands
(180
◦
E–178
◦
W, 26–28
◦
N). The green lines show O
3
with a model
setup in which anthropogenic emissions were excluded.
9 Regional ozone budget
Figure 11 also shows model calculated ozone levels after
excluding anthropogenic sources (in green). Generally, the
diel and annual profiles much resemble clean maritime con-
ditions and most locations have ozone mixing ratios of about
20 ppbv or less. Only in Bahrain during summer ozone lev-
els approach 40 ppbv, indicating substantial influence from
upwind natural NO
x
emissions, especially lightning (Li et
al., 2001). Clearly, in all locations, from urban to cen-
tral Pacific, anthropogenic emissions have strongly influ-
enced ozone mixing ratios as also indicated in previous work
(Lelieveld and Dentener, 2000).
To compare the regional ozone budgets with and with-
out anthropogenic influences, Tables 2 and 3 present the
source and sink terms for the central Gulf region, the geo-
graphical area defined earlier for Fig. 6. We distinguish be-
tween the model diagnosed troposphere and boundary layer.
The monthly mean tropospheric ozone columns are largest
www.atmos-chem-phys.net/9/1393/2009/ Atmos. Chem. Phys., 9, 1393–1406, 2009
1402 J. Lelieveld et al.: Severe ozone air pollution in the Persian Gulf region
Table 2a. Boundary layer ozone budget in 2006 for the region 25
◦
–30
◦
N and 45
◦
–55
◦
E (units Gg/month).
Burden O
3
Chemical Chemical Dry Net
(O
3
)
a
production destruction deposition transport
January 22 (−1) 276 −43 −128 −106
February 17 (−5) 296 −57 −124 −120
March 16 (−1) 435 −103 −161 −172
April 17 (1) 533 −152 −164 −216
May 21 (4) 679 −219 −172 −284
June 42 (21) 716 −247 −186 −262
July 39 (−3) 813 −359 −196 −261
August 14 (−25) 702 −280 −167 −280
September 22 (8) 535 −166 −143 −218
October 18 (−4) 409 −109 −134 −170
November 26 (8) 348 −74 −126 −140
December 23 (−3) 246 −38 −109 −102
a
The O
3
burden change relative to the previous month in parentheses.
Table 2b. Tropospheric ozone budget in 2006 for the region 25
◦
–30
◦
N and 45
◦
–55
◦
E (units Gg/month).
Burden O
3
Chemical Chemical Dry Net
(O
3
)
a
production destruction deposition transport
January 460 (37) 549 −219 −128 −165
February 585 (125) 630 −312 −124 −69
March 572 (−13) 997 −475 −161 −374
April 446 (−126) 1240 −672 −164 −530
May 663 (217) 1659 −948 −172 −322
June 685 (22) 1789 −1070 −186 −511
July 656 (−29) 1931 −1384 −196 −380
August 632 (−24) 1839 −1262 −167 −434
September 514 (−118) 1351 −721 −143 −605
October 414 (−100) 955 −512 −134 −409
November 490 (76) 698 −334 −126 −162
December 567 (77) 490 −179 −109 −125
a
The O
3
burden change relative to the previous month in parentheses
from May to August (>600Gg O
3
) and the boundary layer
columns are maximum (∼40Gg) in June and July. During
the latter two months the long-distance transport of polluted
air from the Mediterranean is most efficient.
Both in the boundary layer and in the troposphere the
photochemical ozone formation is strongest during the May-
August period. By taking boundary layer chemical ozone
production of >500Gg/month and tropospheric O
3
produc-
tion >1000 Gg/month as criteria for strong ozone forma-
tion, it appears that the ozone buildup in the period April–
September is generally very strong, coincident with the high
surface ozone shown in Fig. 8. March and October are “tran-
sition” months during which air quality standards for hu-
man health are nevertheless exceeded. Table 2 furthermore
shows that the troposphere over the Persian Gulf strongly
contributes to net photochemical O
3
formation and therefore
exports substantial amounts of ozone (nearly 400 Gg/month)
to the surrounding regions.
Table 3 presents the regional tropospheric and boundary
layer ozone budgets for the model simulations without an-
thropogenic emissions. Although chemical ozone production
is still highest in the April-September period, it is more than
a factor of three less in the boundary layer and a factor of
2.5 less in the troposphere compared to the recent conditions
(Table 2). The relative ozone production enhancements are
even stronger during winter, so that annually the chemical
production is increased by more than a factor of four in the
boundary layer and a factor of three in the troposphere.
The annual mean tropospheric ozone column over the
Gulf in the simulation with only natural emissions is 311 Gg
whereas this is 557Gg in the simulation that also includes an-
thropogenic emissions. Even though the simulation without
Atmos. Chem. Phys., 9, 1393–1406, 2009 www.atmos-chem-phys.net/9/1393/2009/
J. Lelieveld et al.: Severe ozone air pollution in the Persian Gulf region 1403
Table 3a. Boundary layer ozone budget for the region 25
◦
–30
◦
N and 45
◦
–55
◦
E for the simulation without anthropogenic emissions (units
Gg/month).
Burden O
3
Chemical Chemical Dry Net
(O
3
)
a
production destruction deposition transport
January 9 (1) 15 −12 −42 40
February 6 (−3) 24 −18 −45 36
March 6 (0) 47 −28 −56 37
April 6 (0) 94 −50 −59 15
May 10 (4) 195 −89 −74 −28
June 21 (11) 249 −114 −88 −36
July 19 (−2) 304 −180 −98 −28
August 8 (−11) 230 −137 −83 −21
September 8 (0) 149 −70 −62 −17
October 8 (0) 75 −41 −51 17
November 8 (0) 43 −25 −43 25
December 8 (0) 17 −10 −34 27
a
The O
3
burden change relative to the previous month in parentheses
Table 3b. Tropospheric ozone budget for the region 25
◦
–30
◦
N and 45
◦
–55
◦
E for the simulation without anthropogenic emissions (units
Gg/month).
Burden O
3
Chemical Chemical Dry Net
(O
3
)
a
production destruction deposition transport
January 263 (29) 88 −91 −42 74
February 373 (110) 104 −131 −45 182
March 324 (−49) 174 −176 −56 9
April 244 (−80) 313 −274 −59 −60
May 369 (125) 616 −442 −74 25
June 371 (2) 778 −534 −88 −154
July 365 (−6) 901 −748 −98 −61
August 329 (−36) 811 −677 −83 −87
September 264 (−65) 529 −344 −62 −188
October 231 (−33) 289 −234 −51 −37
November 241 (10) 179 −146 −43 20
December 355 (114) 88 −69 −34 129
a
The O
3
burden change relative to the previous month in parentheses
anthropogenic influence indicates that the region exports
ozone to its surroundings during summer, on an annual net
basis the boundary layer imports ozone, whereas for the tro-
posphere we compute a small net export (148 Gg/yr). This
contrasts to a strong net export, several orders of magnitude
higher (4086 Gg) in the troposphere during the year 2006.
10 Conclusions
The ozone hot spot over the Persian Gulf predicted by our
model is caused by a combination of factors that operate in
the same direction. These include long-distance transport of
air pollution, unusually strong STE, substantial upwind nat-
ural NO
x
sources, a lack of deep convective mixing and pre-
cipitation, strong local anthropogenic emissions and highly
favorable conditions for photochemistry. Together this leads
to strongly enhanced ozone mixing ratios in the free tropo-
sphere, the boundary layer and at the Earth’s surface.
Our model results, supported by satellite measurements,
indicate that the Gulf region has changed from pre-industrial
conditions with near-surface ozone mixing ratios below
40 ppbv, as derived from calculations without anthropogenic
emissions, to present-day levels that strongly exceed air qual-
ity standards (as defined for the EU). Furthermore, the region
has changed from near-neutral in terms of net ozone trans-
port, into one that strongly contributes to net ozone transport.
Considering a tropospheric ozone lifetime of several weeks,
www.atmos-chem-phys.net/9/1393/2009/ Atmos. Chem. Phys., 9, 1393–1406, 2009
1404 J. Lelieveld et al.: Severe ozone air pollution in the Persian Gulf region
during which non-soluble gases can travel around the globe,
this transport contributes to a hemispheric increase of ozone
in the subtropics.
Although here we focus on 2006 it is important to empha-
size that the ozone hot spot over the Persian Gulf is a recur-
rent feature in our model calculations for the period 1996-
2006. Furthermore, a model simulation for the summer of
2006 at enhanced horizontal resolution (∼1.1
◦
lat/lon) repro-
duces the ozone hot spot, indicating that the results presented
here are not sensitive to the resolution of the model.
The high background ozone mixing ratios in the Gulf re-
gion, as determined by long-distance transport of air pollu-
tion, indicate that the local control options to substantially
reduce surface ozone below health hazardous levels are lim-
ited, and that international efforts are called for. Neverthe-
less, satellite measurements indicate that tropospheric NO
2
columns in the Gulf region and in general in urban and in-
dustrial regions in the Middle East are remarkably high. Re-
ductions of air pollution emissions, which should be feasi-
ble e.g. in the transport and energy sectors, will help reduce
ozone formation.
Our model has been extensively tested for many locations
and we consider these results compelling. Further, data from
satellites, aircraft measurements and in the upwind Mediter-
ranean region indicate increasing trends of ozone and NO
x
emissions. Nevertheless, the lack of ground-based measure-
ments in the Gulf region is unsatisfactory. We recommend
that Global Atmospheric Watch stations in Saudi Arabia and
Iran report the available data and that additional stations are
set up to provide the information needed to effectively reduce
air pollution. This will be particularly important as it may be
expected that climate change will promote poor air quality
conditions while ozone precursor emissions will likely con-
tinue to increase in the region.
Acknowledgements. We are grateful to V. Thouret, the MOZAIC
(Measurements of Ozone and Water Vapor by In-service Airbus
Aircraft) and TES (Tropospheric Emission Spectrometer on
NASA’s Aura satellite) teams for the use of data to test our model.
We acknowledge the support of MOZAIC by the European Com-
mission, Airbus and INSU-CNRS. Particular thanks to Lufthansa,
Air France and Austrian Air for carrying the MOZAIC equipment
free of charge since 1994. We also thank the European Commission
for support of the EU project CIRCE (Climate Change and Impact
Research: the Mediterranean Environment).
Edited by: R. Vautard
This Open Access Publication is
financed by the Max Planck Society.
References
Ayres, J., Maynard, R., and Richards, R.: Air pollution and health,
Imperial College Press, London, 2006.
Barret, B., Ricaud, P., Mari, C., Atti
´
e, J L., Bousserez, N., Josse,
B., Le Flochmo
¨
en, E., Livesey, N.J., Massart, S., Peuch, V
H., Piacentini, A., Sauvage, B., Thouret, V., and Cammas, J
P.: Transport pathways of CO in the African upper troposphere
during the monsoon season: a study based upon the assimilation
of spaceborne observations, Atmos. Chem. Phys., 8, 3231–3246,
2008,
/>Bell, M. L., Peng, R. D., and Dominici, F.: The exposure-response
curve for ozone and risk of mortality and the adequacy of cur-
rent ozone regulations, Environ. Health Perspect., 114, 532–536,
2006.
Chen, D., Zhou, B., Beirle, S., Chen, L. M., and Wagner, T.: Tropo-
spheric NO
2
column densities deduced from zenith-sky DOAS
measurements in Shanghai, China, and their application to satel-
lite validation, Atmos. Chem. Phys. Discuss., 8, 16713–16762,
2008,
/>de Laat, A. T. J. and Lelieveld, J.: Diurnal ozone cycle in the marine
boundary layer, J. Geophys. Res., 105, 11547–11559, 2000.
Diffenbaugh, N. S., Pal, J. S., Giorgi, F., and Gao, X.: Heat stress in-
tensification in the Mediterranean climate change hotspot, Geo-
phys. Res. Lett., 34, L11706, doi:10.1029/2007GL030000, 2007.
Duncan, B. N. and Bey, I: A modeling study of the export
pathways of pollution from Europe: Seasonal and interan-
nual variations (1987–1997), J. Geophys. Res., 109, D08301,
doi:10.1029/2003JD004079, 2004.
Duncan, B. N., West, J. J., Fiore, A. M., and Ziemke, J. R.: The
influence of European pollution on ozone in the Near East and
northern Africa, Atmos. Chem. Phys., 8, 2267–2283, 2008,
/>Emberson, L., Ashmore, M., and Murray, F.: Air pollution im-
pacts on crops and forests. A global assessment, Imperial College
Press, London, 2003.
Ganzeveld, L. N., van Aardenne, J., Butler, T., Lawrence, M. G.,
Metzger, S. M., Stier, P., Zimmerman, P., and Lelieveld, J.: Tech-
nical Note: Anthropogenic and natural offline emissions and the
online EMissions and dry DEPosition (EMDEP) submodel of the
Modular Earth Submodel System (MESSy), Atmos. Chem. Phys.
Discuss., 6, 5457–5483, 2006,
/>Giorgetta, M. A., Manzini, E., Roeckner, E., Esch, M., and Bengts-
son, L.: Climatology and forcing of the quasi-biennial oscillation
in the MAECHAM5 model, J. Climate, 19, 3882–3901, 2006.
Giorgi, F. and Bi, X.: Updated regional precipitation and tem-
perature changes for the 21st century from ensembles of re-
cent AOGCM simulations, Geophys. Res. Lett., 32, L21715,
doi:10.1029/2005GL024288, 2005.
Gryparis, A., Forsberg, B., Katsouyanni, K., et al.: Acute effects
of ozone on mortality from the ”Air pollution and health: A Eu-
ropean approach” project, Am. J. Respir. Crit. Care Med., 170,
1080–1087, 2004.
Gurjar, B. R., Butler, T. M., Lawrence, M. G., and Lelieveld, J.:
Evaluation of emissions and air quality in megacities, Atmos.
Environ., 42, 1593–1606, 2008.
Held, I. M. and Soden, B. J.: Robust responses of the hydrological
Atmos. Chem. Phys., 9, 1393–1406, 2009 www.atmos-chem-phys.net/9/1393/2009/
J. Lelieveld et al.: Severe ozone air pollution in the Persian Gulf region 1405
cycle to global warming, J. Climate, 19, 5686–5699, 2006.
Intergovernmental Panel on Climate Change (IPCC): Climate
change 2007: The physical science basis; Contribution of work-
ing group I to the fourth assessment report of the IPCC, edited
by: Solomon, S., Qin, D., Manning, M., et al., Cambridge Uni-
versity Press, Cambridge, UK, and New York, 2007.
J
¨
ockel, P., Tost, H., Pozzer, A., Br
¨
uhl, C., Buchholz, J., Ganzeveld,
L., Hoor, P., Kerkweg, A., Lawrence, M. G., Sander, R., Steil,
B., Stiller, G., Tanarhte, M., Taraborelli, D., van Aardenne, J.,
and Lelieveld, J.: The atmospheric chemistry general circulation
model ECHAM5/MESSy: Consistent simulation of ozone from
the surface to the mesosphere, Atmos. Chem. Phys., 6, 5067–
5104, 2006,
/>Kerkweg, A., Sander, R., Tost, H., and J
¨
ockel, P.: Technical
note: Implementation of prescribed (OFFLEM), calculated (ON-
LEM), and pseudo-emissions (TNUDGE) of chemical species in
the Modular Earth Submodel System (MESSy), Atmos. Chem.
Phys., 6, 3603–3609, 2006,
/>Kallos, G., Kotroni, V., Lagouvardos, K., and Papadopoulos, A.: On
the long-range transport of air pollutants from Europe to Africa,
Geophys. Res. Lett., 25, 619–622, 1998.
Kentarchos, A. S., Roelofs, G J., and Lelieveld, J.: Simulation
of extratropcal synoptic-scale stratosphere-troposphere exchange
using a coupled chemistry GCM: Sensitivity to horizontal reso-
lution, J. Atmos. Sci., 57, 2824–2838, 2000.
Kouvarakis, G., Vrekoussis, M., Mihalopoulos, N., Kourtidis, K.,
Rappenglueck, B., Gerasopoulos, E., and Zerefos, C.: Spatial
and temporal variability of tropospheric ozone (O
3
) in the bound-
ary layer above the Aegean Sea (eastern Mediterranean), J. Geo-
phys. Res., 107, 8137, doi:10.1029/2000JD000081, 2002.
Lelieveld J. and Dentener, F.: What controls tropospheric ozone? J.
Geophys. Res., 105, 3531–3551, 2000.
Lelieveld, J., Berresheim, H., Borrmann, S., et al.: Global air pollu-
tion crossroads over the Mediterranean, Science, 298, 794–799,
2002.
Lelieveld, J., van Aardenne, J., Fischer, H., de Reus, M., Williams,
J., and Winkler, P.: Increasing ozone over the Atlantic Ocean,
Science, 304, 1483–1487, 2004.
Lelieveld, J., Br
¨
uhl, C., J
¨
ockel, P., Steil, B., Crutzen, P.J., Fischer,
H., Giorgetta, M. A., Hoor, P., Lawrence, M. G., Sausen, R., and
Tost, H.: Stratospheric dryness: model simulations and satellite
observations, Atmos. Chem. Phys., 7, 1313–1332, 2007,
/>Leue, C., Wenig, M. Wagner, T., Klimm, O., Platt, U., and J
¨
ahne,
B.: Quantitative analysis of NO
2
emissions from GOME satellite
image sequences, J. Geophys. Res., 106, 5493–5505, 2001.
Li., Q., Jacob, D. J., Logan, J. A., Bey, I., Yantosca, R. M., Liu,
H., Martin, R. V., Fiore, A. M., Field, B. D., and Duncan, B. N.:
A tropospheric ozone maximum over the Middle East, Geophys.
Res. Lett., 28, 3235–3238, 2001.
Nassar R., Logan, J. A., Worden, H. M., et al.: Validation of Tro-
pospheric Emission Spectrometer (TES) nadir ozone profiles us-
ing ozonesonde measurements, J. Geophys. Res., 113, D15S17,
doi:10.1029/2007JD008819, 2008.
Neftel A., Spirig, C., Pr
´
ev
ˆ
ot, A. S. H., Furger, M., Stutz, J., Vogel,
B., and Hjorth, J.: Sensitivity of photooxidant production in the
Milan Basin: An overview of results from a EUROTRAC-2 Lim-
itation of Oxidant Production field experiment, J. Geophys. Res.,
107, 8188, doi:10.1029/2001JD001263, 2002.
Osterman, G. B., Kulawik, S. S., Worden, H. ., Richards, N. A.
D., Fisher, B. M., Eldering, A., Shephard, M. W., Froidevaux,
L., Labow, G., Luo, M., Herman, R. L., Bowman, K. W., and
Thompson, A. M.: Validation of Tropospheric Emission Spec-
trometer (TES) measurements of the total, stratospheric, and tro-
pospheric column abundance of ozone, J. Geophys. Res., 113,
D15S16, doi:10.1029/2007JD008801, 2008.
Pozzer, A., J
¨
ockel, P., Tost, H., Sander, R., Ganzeveld, L., Kerk-
weg, A., and Lelieveld, J.: Simulating organic species with
the global atmospheric chemistry general circulation model
ECHAM5/MESSy1: a comparison of model results with obser-
vations, Atmos. Chem. Phys. 7, 2527–2550, 2007.
Ribas, A. and Pe
˜
nuelas, J.: Temporal patterns of surface ozone
levels in different habitats of the North Western Mediterranean
basin, Atmos. Environ., 38, 985–992, 2004.
Roeckner, E., Brokopf, R., Esch, M., Giorgetta, M., Hagemann,
S., Kornbl
¨
uh, Manzini, L. E., Schlese, U., and Schulzweida, U.:
Sensitivity of simulated climate to horizontal and vertical reso-
lution in the ECHAM5 atmosphere model, J. Climate, 19, 3771–
3791, 2006.
Rodwell, M. J. and Hoskins, B. J.: Monsoons and the dynamics of
deserts, Q. J. R. Meteorol. Soc., 122, 1385–1404, 1996.
Rodwell, M. J. and Hoskins, B. J.: Subtropical anticyclones and the
summer monsoon, J. Climate, 14, 3192–3211, 2001.
Roelofs, G. J. and Lelieveld, J.: Model study of the influence of
cross-tropopause O
3
transports on tropospheric O
3
levels, Tellus,
49B, 38–55, 1997.
Sander, R., Kerkweg, A., J
¨
ockel, P., and Lelieveld, J.: Technical
Note: The new comprehensive atmospheric chemistry module
MECCA, Atmos. Chem. Phys., 5, 445–450, 2005,
/>Seidel, D. J., Fu, Q., Randel, W. J., and Reichler, T. J.: Widening of
the tropical belt in a changing climate, Nature Geosc. 1, 21–24,
2008.
Singh, H. B., Chen, Y., Thakur, A. N., Kondo, Y., Talbot, R. W.,
Gregory, G. L., Sachse, G. W., Blake, D. R., Bradshaw, J. D.,
Wang, Y., and Jacob, D. J.: Latitudinal distribution of reactive
nitrogen in the free troposphere over the Pacific Ocean in late
winter/early spring, J. Geophys. Res., 103, 28237–28246, 1998.
Sprenger, M., Maspoli, M. C., and Wernli, H.: Tropopause folds and
cross-tropopause exchange: A global investigation based upon
ECMWF analyses for the time period March 2000 to February
2001, J. Geophys. Res., 108, 8518, doi:10.1029/2002JD002587,
2003.
Stohl, A., Eckhardt, S., Forster, C., James, P., and Spichtinger,
N.: On the pathways and timescales of intercontinen-
tal air pollution transport, J. Geophys. Res., 107, 4684,
doi:10.1029/2001JD001396, 2002.
Stavrakou, T., M
¨
uller, J F., Boersma, K. F., De Smedt, I., and van
der A., R. J.: Assessing the distribution and growth rates of NO
x
emission sources by inverting a 10-year recors of NO
2
columns,
Geophys. Res. Lett., 35, L10801, doi:10.1029/2008GL033521,
2008.
Sun, Y., Solomon, S., Dai, A., and Portmann, R. W.: How often will
it rain? J. Climate, 20, 4801–4818, 2007.
Thouret, V., Marenco, A., Logan, J. A., N
´
ed
´
elec, P., and Grouhel,
C.: Comparisons of ozone measurements from the MOZAIC air-
www.atmos-chem-phys.net/9/1393/2009/ Atmos. Chem. Phys., 9, 1393–1406, 2009
1406 J. Lelieveld et al.: Severe ozone air pollution in the Persian Gulf region
borne program and the ozone sounding network at eight loca-
tions, J. Geophys. Res., 103, 695–720, 1998.
Tost, H., J
¨
ockel, P., Kerkweg, A., Sander, R., and Lelieveld, J.:
Technical Note: A new comprehensive SCAVenging submodel
for global atmospheric chemistry modelling, Atmos. Chem.
Phys., 6, 565–574, 2006,
/>Traub., M. and Lelieveld, J.: Cross-tropopause transport over
the eastern Mediterranean, J. Geophs. Res. 108, 4712,
doi:10.1029/2003JD003745, 2003.
van der A., R. J., Eskes, H. J., Boersma, K. F., van Noije,
T. P. C., van Roozendaal, M., de Smedt, I., Peters, D. H.
M. U, and Meijer, E. W.: Trends, seasonal variability and
dominant NO
x
sources derived from a ten year record of
NO
2
measured from space, J. Geophys. Res., 113, D04302,
doi:10.1029/2007JD009021, 2008.
van Aardenne, J. A., Dentener, F., Olivier, J. G. G., Peters, J. A.
H. W., and Ganzeveld, L. N.: The EDGAR3.2 Fast Track 2000
dataset (32FT2000), Tech. rep., Joint Research Centre, Institute
for Environment and Sustainability (JRC-IES), Climate Change
Unit, TP280, 21020, Ispra (Va), Italy, />model/v32ft2000edgar/docv32ft2000/, 2005.
Vardavas, I. M. and Taylor, F. W.: Radiation and climate, Oxford
University Press, Oxford, UK, 2007.
Worden, H. M., Logan, J. A., Worden, J. R., Beer, R., Bowman,
K., Clough, S. A., Eldering A., Fischer, B. M., Gunson, M. R.,
Herman, R. L., Kulawik, S. S., Lampel., M. C., Luo, M., Megret-
skaia, I. A., Osterman, G. B., and Shephard, M. W.: Comparisons
of Tropospheric Emission Spectrometer (TES) ozone profiles to
ozonesondes: Methods and initial results, J. Geophys. Res., 112,
D03309, doi:10.1029/2006JD007258, 2007.
Zbinden, R. M., Cammas, J P., Thouret, V., N
´
ed
´
elec, P., Karcher,
F., and Simon, P.: Mid-latitude tropospheric ozone columns from
the MOZAIC program: climatology and interannual variability,
Atmos. Chem. Phys., 6, 1053–1073, 2006,
/>Atmos. Chem. Phys., 9, 1393–1406, 2009 www.atmos-chem-phys.net/9/1393/2009/