Spatial modelling of air pollution in urban areas with GIS: a case study on integrated database development doc
Bạn đang xem bản rút gọn của tài liệu. Xem và tải ngay bản đầy đủ của tài liệu tại đây (391.58 KB, 6 trang )
Advances in Geosciences, 4, 63–68, 2005
SRef-ID: 1680-7359/adgeo/2005-4-63
European Geosciences Union
© 2005 Author(s). This work is licensed
under a Creative Commons License.
Advances in
Geosciences
Spatial modelling of air pollution in urban areas with GIS: a case
study on integrated database development
L. Matejicek
Institute for Environmental Studies, Charles University, Prague, 128 01, Czech Republic
Received: 1 August 2004 – Revised: 1 November 2004 – Accepted: 15 November 2004 – Published: 9 August 2005
Abstract. A wide range of data collected by monitoring sys-
tems and by mathematical and physical modelling can be
managed in the frame of spatial models developed in GIS.
In addition to data management and standard environmen-
tal analysis of air pollution, data from remote sensing (aerial
and satellite images) can ehance all data sets. In spite of
the fact that simulation of air pollutant distribution is carried
out by standalone computer systems, the spatial database in
the framework of the GIS is used to support decision-making
processes in a more efficient way. Mostly, data are included
in the map layers as attributes. Other map layers are carried
out by the methods of spatial interpolation, raster algebra,
and case oriented analysis. A series of extensions is built
into the GIS to adapt its functionality. As examples, the spa-
tial models of a flat urban area and a street canyon with ex-
tensive traffic polluted with NO
x
are constructed. Different
scales of the spatial models require variable methods of con-
struction, data management, and spatial data sources. The
measurement of NO
x
and O
3
by an automatic monitoring
system and data from the differential absorption LIDAR are
used for investigation of air pollution. Spatial data contain
digital maps of both areas, complemented by digital eleva-
tion models. Environmental analyses represent spatial inter-
polations of air pollution that are displayed in horizontal and
vertical planes. Case oriented analyses are mostly focused
on risk assessment methods. Finally, the LIDAR monitor-
ing results and the results obtained by modelling and spatial
analyses are discussed in the context of environmental man-
agement of the urban areas. The spatial models and their
extensions are developed in the framework of the ESRI’s Ar-
cGIS and ArcView programming tools. Aerial and satellite
images preprocessed by the ERDAS Imagine represent areas
of Prague.
Correspondence to: L. Matejicek
()
1 Introduction
The recent development of spatial data management in the
framework of geographic information systems (GISs) has
created a new era of environmental modelling. More pow-
erful computers have made running air quality models at
global and local spatial scales possible. In order to under-
stand the function of more complex models, the modelling
system should consist of other subsystems (point and area
sources of pollution, spatial description of terrain elevations,
meteorological data, air quality monitoring networks). Ob-
viously, the use of GIS has become essential in providing
boundary conditions to the air quality models. Certainly, the
use of GIS in air pollution modelling can be further extended
to processing the surface data. Many models have been cou-
pled with GIS in the past decade to simulate various environ-
mental processes as described by Longley et al. (2001). Due
to the four-dimensional nature of the distribution of atmo-
spheric pollutants, the concept of GIS should be extended to
include temporal variations of three-dimensional spatial data.
The interpolations, integrations of land cover surface data,
and the GIS analyses focused on small scale spatial mod-
els carried out in the kilometer grid are discussed by Lee in
the book published by Goodchild (1996) and in the frame of
particular studies (Matejicek, 1996, 1998, 1999). In case of
large scale air quality modelling, more detailed spatial data
are needed to include the impact of buildings and other man-
made barriers on the distribution of air pollutants, (Janour,
1999; Civis, 2001). Apart from this approach, the statistical
theory is also used to indicate spatio-temporal interactions as
described by Briggs et al. (2000).
64 L. Matejicek: Spatial modelling of air pollution in urban areas with GIS
Fig. 1. The standalone software application for integrated evalua-
tion of air quality.
2 Methods of integration air quality models into GIS
A few scenarios can be established to integrate air qual-
ity models into GIS. The basic level is represented by the
standalone software application for simulation of air qual-
ity models (ISCST3, ISC-PRIME), which is accompanied by
data inputs and outputs. All data can be used independently
by other software systems (GIS, RDBMS, Surfer, WWW-
presentations). The individual programs form heterogeneous
data structures that require the transport of data into vari-
ous data formats. On the other hand, a number of com-
puter programs have been developed to integrate particular
functions of the GIS, air quality modelling, and graphic sys-
tems. Mostly, they are designed to carry out specific cal-
culations without links to other software applications. GIS
based software applications are mostly based on spatial soft-
ware libraries. The missing functions (air quality modelling,
visualisation tools) can be complemented or shared through
dynamic-link libraries. The integrated emission evaluation
systems, which offer alternative ways of using the emission
models together with selected functionality of GISs, are de-
scribed by Rebolj (1999). A number of software applications
are focused on the design of relational databases and their
interconnection together with standard air quality modelling
systems. The structure of the programs developed with spa-
tial software libraries is shown in Fig. 1.
Fig. 2. Data included into GIS map layers.
2.1 GIS data management and functionality
Considering both described scenarios of integration, the
scope and scale of urban area problems make GIS a powerful
tool for management of spatial and temporal data, complex
analyses, and visualization, (Matejicek, 2002). Due to the
ability to manage a number of spatial and temporal data for-
mats, data structures created in the framework of the GISs
open the way to building air quality information systems that
synthesize geospatial and temporal air quality data to sup-
port spatio-temporal analysis and dynamic modelling. There
L. Matejicek: Spatial modelling of air pollution in urban areas with GIS 65
is also a growing amount of digital maps in the GIS commu-
nity, which are used to support decision-making processes of
urban authorities (data sets for land cover and climatic vari-
ables, digital elevation models, which are extended by blocks
of buildings and trees, air pollution sources and monitoring
networks, soil and hydrologic properties, road and railway
networks). While much progress has been made with the
mapping of environmental data and the creation of national,
regional, and local data sets, many challenges remain. For
example, air quality models are not regularly included into
GIS. As standalone software applications, they use various
data formats, which can usually operate independently with
their own GIS database. Similarly, air quality management
agencies are creating GIS data sets to support their opera-
tions, without any data standards that can support spatio-
temporal analysis and dynamic modelling. The common
theme among these challenges is the need for the integra-
tions of different spatial and air quality data, integration of
data and modelling, and integration across spatial scales. The
requirements for the integrated spatial modelling of air qual-
ity in the framework of GIS represent a common geospatial
coordinate system, vector themes (points, lines and areas) for
description of surface objects (buildings, bridges, vegetation)
supported by raster and TIN surface data (digital elevation
models), and vector themes for representation of air pollu-
tion inputs (local point, line and area sources of pollution,
long-distance transport of air pollution). The key parts of the
projects represent data of air quality measured by monitoring
networks, terrain measurements (LIDAR) and simulation re-
sults of air quality models.
2.2 GIS data models
At present, all the mentioned properties can be accomplished
by few of the GISs. In the presented study, the ArcGIS,
distributed by the Environmental Systems Research Institute
(ESRI), has been used for the proposed operations. The Ar-
cGIS, a descendant of the widely used ArcInfo, can man-
age spatial data in various levels, such as shapefiles, cover-
ages, and geodatabases. Moreover, the ArcGIS functional-
ity is expanded by the COM technology, which uses Visual
Basic as the standard interface language, just as Microsoft
uses the Visual Basic as the interface language for other soft-
ware applications. The ArcGIS can be customized for partic-
ular applications of GIS using specially designed data mod-
els. Currently, a number of data models have been published
in hydrology (Maidment, 2002), biodiversity, forestry, etc.
Air quality modelling can be accomplished by exchanging
data between ArcGIS and the independent air quality sim-
ulation system, by constructing simulation tools attached to
a project in the ArcGIS, or by customizing the behavior of
the ArcGIS objects. The choice depends on the model com-
plexity and calculation requirements in the framework of the
various ArcGIS levels. All data are stored in the relational
database, which can be represented on the basic level by the
personal geodatabase (Microsoft Access), or by the RDBMS
(Oracle, Microsoft SQL Server). So, the data transfer among
Fig. 3. Data repository with 3-D space indexes.
other standalone software applications can be realized di-
rectly through the implemented database connections. In
case of the ArcGIS’s geodatabase, all the data are loaded into
the relational database, so that the geospatial coordinate data
of the GIS data layers are stored in the relational data tables.
Since the relational database supports relationships between
its tables, feature-to-feature spatial connections can be set up
among the GIS data layers together with linking and joining
of external data tables.
2.3 Spatial models for air quality assessment extended by
the LIDAR measurements
The data required for spatial models to serve air quality mod-
elling can be grouped into a few classes. Figure 2 shows
spatial data included into map layers in the frame of a GIS
project. It is impossible to completely enumerate all the
spatial and non-spatial data needed, since the more that is
known, the better. However, the accuracy of the model re-
sults does not depend on the data alone. The choice of ap-
propriate modelling tools and their settings represents other
key parts of air quality modelling. So, if the models do
not require or are not capable of evaluating some detailed
information, there is little benefit in putting that data in
a GIS project. To examine the functionality of the spa-
tial modelling system, the version of the Industrial Source
Complex-Short Term (ISCST3) with Plume Rise Enhance-
ments (ISC-PRIME), and the AMS/EPA Regulatory Models
(AERMOD/AERMOD-PRIME) have been included into the
projects. The ISC-AERMOD View with its preprocessing
66 L. Matejicek: Spatial modelling of air pollution in urban areas with GIS
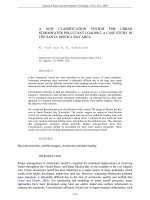
Fig. 4. Map layers of the flat urban area.
and postprocessing modules has been used as the unified in-
terface of the air dispersion models.
The spatial surface data (digital elevation model-DEM,
buildings) make up the input into the preprocessing mod-
ules (Import of the Digital terrain data in ISC-AERMOD,
Building Profile Input Program-BPIP). Other surface data
(bridges, trees, satellite and aerial images) complement spa-
tial information for display and visualization. The layers
with sources of pollution contain (in addition to the coor-
dinates and shapes) the attributes, which describe emission
properties. The surface data and data about sources of pollu-
tion have to be transferred into appropriate input formats to
run the air quality dispersion models. The primary storage in
the GIS spatial database serves furthermore for spatial anal-
ysis, display and visualization. As with the previous data,
meteorological data are also preprocessed from the database
storage into the input formats for air quality dispersion mod-
elling. The map layers, which represent monitoring networks
and LIDAR measurements, serve for the comparison of the
measured data with the predicted air pollution data calculated
by the models.
The mentioned air quality models are steady-state Gaus-
sian plume models used to assess pollutant concentrations
from a wide variety of sources mostly associated with an in-
dustrial complex. The steady state values of variables are
transferred and incorporated into the GIS database, which
can be useful in managing data time series. To accommodate
large data sets and many variables such as air quality data,
climatic data, and properties of sources of pollution, a data
repository containing all types of time series data for all fea-
tures and for all times is proposed.Time series information
can thereby be depicted in 3-D space. The three coordinate
axes mark space (S – identification code of a spatial future),
time (T – discrete time) and the variable being measured (V
– identification code of a variable). The data value indexed
by the space, the time and the variable can be defined as
D(S,T,V). Thus, each stored value is represented by a point in
three-dimensional space with its corresponding coordinates
(Fig. 3). In order to extract time series, the space and vari-
able coordinates have to be specified in a query. The result
is represented by selected records that match the conditions
of the query. Due to spatial properties of the GIS, space co-
ordinates can be derived from a spatial query in the frame of
GIS functionality. The associations between the data reposi-
tory and spatial objects in the ArcGIS geodatabase are spec-
ified by relationships, which are stored into the relationship
classes.
L. Matejicek: Spatial modelling of air pollution in urban areas with GIS 67
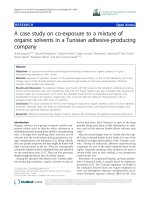
Fig. 5. Map layers of the street canyons.
3 Case studies of the urban areas
The various data sets (digital maps, aerial and satellite im-
ages, spatio-temporal data in the 3-D database, data outputs
from simulation systems) have been linked together to make
up projects for different spatial scales. The GIS, originally
design to display 2-D digital maps, has been extended into
3-D mapping and data management in the framework of the
ArcGIS. As examples, two urban areas of Prague have been
used to demonstrate the abilities of spatial modelling.
3.1 Spatial modelling of a flat urban area
The inputs of spatial data represent a digital elevation model,
which can be used for air pollution modelling, and aerial or
satellite images, which can serve for classification of the sur-
face into classes to define the surface graininess and temper-
ature. The sources of air pollution are mapped into a few
categories according to the volume of pollution. Their lo-
cations and shapes (in case of the line and area sources) to-
gether with the attributes are stored in separate themes. Influ-
ential sources of pollution, among others, are represented by
NO
x
(mostly traffic-related air pollution mapped as the line
sources) and SO
2
(mostly stationary air pollution registered
as the point sources). In addition to data from an automatic
monitoring system, the LIDAR (Zelinger, 2003), has been
used to complete the data sets. The map composition, which
contains the aerial images complemented by the layers with
sources of air pollution and 3-D LIDAR data (O
3
concentra-
tion labelled by the elevation), is illustrated in Fig. 4.
3.2 Spatial modelling of the street canyons
The streets surrounded by high buildings, in urban areas pol-
luted with traffic-related sources, are spatially modelled as
the street canyons. Accumulation of air pollution (mostly
from cars) results in high concentrations of organic and in-
organic compounds in the street canyons. Distribution and
local accumulation of pollutants can be solved by mathemat-
ical and physical modelling. In the first stage, the digital
terrain model complemented by buildings and other terrain
objects is needed to support air quality modelling. Conse-
quently, a complex analysis of all spatio-temporal data has
to be performed. Spatial modelling in the framework of the
GIS can help to accomplish nearly all these tasks. To demon-
strate GIS suitability, a case study of spatial modelling of air
quality in urban streets is illustrated in Fig. 5. The map com-
positions contain various sets of themes. The first part shows
the aerial images of the studied local area complemented by
the layers with sources of air pollution and one point of the
monitoring network. Other map compositions contain the
same area complemented by the satellite image from Land-
sat 7 (the 7th band, which refers to temperature of the sur-
face), the digital terrain model with buildings and trees, and
68 L. Matejicek: Spatial modelling of air pollution in urban areas with GIS
a sample of the spatial interpolation of air pollution in the
area. Again, in addition to standard analysis, the LIDAR
system and the results of physical modelling in the scaled
down models (simulations in wind tunnels) can be used to
complete the data sets.
4 Conclusions
Spatial modelling of air quality in this paper is mainly fo-
cused on the integration of a wide range of data in the frame-
work of the GIS spatial database. This method of data man-
agement and analysis is also promoted by the LIDAR data,
which represent measurements of compounds above the sur-
face located by 3-D coordinates. Despite the complexity
of the spatial data management, analysis, and visualization,
modelling of air pollution has to be solved independently in
the framework of standalone computer systems (mathemati-
cal modelling or physical scaled models). The GISs therefore
serve as the data stores, which can manage all the data to-
gether with model outputs to carry out risk assessment anal-
ysis and map compositions. The spatial modelling of street
canyons in the framework of the larger urban area comple-
mented by the 3-D LIDAR measurements requires more de-
tailed three dimensional mapping that can generate an exten-
sive volume of data. The spatial modelling of air pollution
extended by air dispersion models under a united interface
can therefore be used, when supported by adequate hardware,
software, and data.
Acknowledgements. The paper was carried out in the frame of
the project AVCR 1ET400760405, which is generally focused on
measurement and modelling of air pollution in urban areas and flat
landscape. The GIS projects were realized in the GIS Laboratory
supported by the Ministry of Education, Youth and Sports of the
Czech Republic in the frame of the project MSM 113100007 of
the Faculty of Natural Science, Charles University in Prague. The
digital maps used in the case studies are administrated by the
Institute of Municipal Informatics of Prague.
Edited by: P. Krause, S. Kralisch, and W. Fl
¨
ugel
Reviewed by: anonymous referees
References
Briggs, D. J.: A regression-based method for mapping traffic-
related air pollution: application and testing in four contrasting
urban environments, The science of the total environment, 253,
151–167, 2000.
Civis, S., Zelinger, Z., Strizik, M., and Janour, Z.: Simulation of Air
Pollution in a Wind Tunnel, in: Spectroscopy from Space, edited
by: Demaison, J., Kluwer Academic, Dordrecht, 275–299, 2001.
Goodchild, M. F., Steyaert, L. T., Parks, B. O., Johnston, C. A.,
Maidment, D. R., Crane, M. P., and Glendinning, S. (Eds.): GIS
and Environmental Modeling: Progress and Research Issues,
Fort Collins, CO: GIS World Books, 239–242, 1996.
Janour, Z., Zelinger, Z., and Civis, S.: Laser photoacoustic spec-
tometry and its application for simulation of air pollution in a
wind tunnel, Analyst, 124, 1205–1208, 1999.
Longley, P. A., Goodchild, M. F., Maguire, D. J., and Rhind, D.
W.: Geographic Information Systems and Science, John Wiley
& Sons, 27–58, New York, 2001.
Maidment, D. R., Merwade, V., Whiteaker, T., Blongevicz, M., and
Arctur, D.: Time Series, in: Arc Hydro: GIS for water resources,
edited by: Maidment, D. R., ESRI Press Independent Publishers
Group (IPG), Redlands, California, 141–166, 2002.
Matejicek, L.: Radionuclide deposition in the Irish Sea, Proceed-
ings of the 11th ESRI European User Conference, Imperial Col-
lege, London, />PAPERS/PN30/PN30F.HTM, 1996.
Matejicek, L.: Spatio-temporal modelling with ACSL in the GIS,
Acta Universitatis Carolinae Environmentalica, 11, 55–66, 1998.
Matejicek, L.: Modelling of groundwater flow networks in the
desktop GIS, in: Environmental modelling the dynamics of nat-
ural, agricultural, tourism and socio-economic systems, edited
by: Oxley, L. and Scrimgeour, F., Proceedings of International
Congress on Modelling and Simulation Proceedings, University
of Waikato, New Zealand, 55–60, 1999.
Matejicek, L.: Environmental Modelling in Urban Areas with GIS,
Integrated Assessment and Decision Support, Proceedings of the
1st biennial meeting of iEMSs, Lugano, 60–65, 2002.
Rebolj, D. and Sturm, P. J.: A GIS based component-oriented inte-
grated system for estimation, visualization and analysis of road
traffic air pollution, Transport and air pollution – 8th Interna-
tional Symposium, 15–21, 1999.
Zelinger, Z., Strizik, M., Janour, Z., Berger, P., and Cerny, A.: Com-
parison of model and in-situ measurements of distribution of at-
mospheric pollutants, Proceedings of PHYSMOD 2003: Interna-
tional Workshop on Physical Modelling of Flow and Dispersion
Phenomena, Italy, 6 pp., 2003.