Fuel For Life - Household Energy and Health pptx
Bạn đang xem bản rút gọn của tài liệu. Xem và tải ngay bản đầy đủ của tài liệu tại đây (1.35 MB, 23 trang )
Household Energy and Health
WHO Library Cataloguing-in-Publication Data
Fuel for life : household energy and health.
"Written and coordinated by Eva Rehfuess"–Acknowledgements.
1. Air pollution, Indoor. 2. Wood fuels. 3. Energy policy. 4. Environmental health. 5. Socioeconomic factors. 6. Developing countries. I. Rehfuess, Eva. II. World Health Organization.
ISBN 92 4 156316 8 (NLM classification: WA 754)
ISBN 978 92 4 156316 1
© World Health Organization 2006
All rights reserved. Publications of the World Health Organization can be obtained from WHO Press, World Health Organization, 20 Avenue Appia, 1211 Geneva 27, Switzerland (tel: +41
22 791 3264; fax: +41 22 791 4857; email: ). Requests for permission to reproduce or translate WHO publications – whether for sale or for noncommercial
distribution – should be addressed to WHO Press, at the above address (fax: +41 22 791 4806; email: ).
The designations employed and the presentation of the material in this publication do not imply the expression of any opinion whatsoever on the part of the World Health Organization
concerning the legal status of any country, territory, city or area or of its authorities, or concerning the delimitation of its frontiers or boundaries. Dotted lines on maps represent
approximate border lines for which there may not yet be full agreement.
The mention of specific companies or of certain manufacturers’ products does not imply that they are endorsed or recommended by the World Health Organization in preference to others
of a similar nature that are not mentioned. Errors and omissions excepted, the names of proprietary products are distinguished by initial capital letters.
All reasonable precautions have been taken by WHO to verify the information contained in this publication. However, the published material is being distributed without warranty of any
kind, either express or implied. The responsibility for the interpretation and use of the material lies with the reader. In no event shall the World Health Organization be liable for damages
arising from its use.
Printed in France
Household Energy and Health
contents
Section 2: Household energy and the
Millennium Development Goals
Foreword 4
Acknowledgements 5
Further reading 38
Annex 39
Household energy: three billion left behind 8
Health at the heart of the matter 10
The killer in the kitchen 12
Energizing the Millennium Development Goals 16
Trapped by energy poverty 18
Women and children overlooked 20
Stripping our forests, heating our planet 22
The need for a quantum leap 24
Coming clean: modern fuels, modern stoves 28
Investing in household energy pays off 30
Rolling out household energy programmes: learning from the past
32
New household energy horizons 34
Section 3: The way forward
Section 1: Household energy, indoor air
pollution and health
Key points
4
Fuel for Life: Household Energy and Health
5
nergy is essential to meet our most basic
needs: cooking, boiling water, lighting and
heating. It is also a prerequisite for good health
– a reality that has been largely ignored by the world
community.
More than three billion people still burn wood,
dung, coal and other traditional fuels inside their
homes. The resulting indoor air pollution is
responsible for more than 1.5 million deaths a year
– mostly of young children and their mothers.
Millions more suffer every day with difficulty in
breathing, stinging eyes and chronic respiratory
disease. Moreover, indoor air pollution and
inefficient household energy practices are a
significant obstacle to the achievement of the
Millennium Development Goals.
Fuel for life, food for thought. With this publication
we draw attention to a serious neglected public
health problem. Effective solutions exist and the
economic case for taking practical solutions to scale
is just as strong as the humanitarian case. Making
cleaner fuels and improved stoves available to
millions of poor people in developing countries will
reduce child mortality and improve women's health.
In addition to the health gains, household energy
programmes can help lift families out of poverty and
accelerate development progress.
We hope that Fuel for life will inspire and prompt
vigorous action to close the household energy gap.
Dr LEE Jong-wook
Director-General
World Health Organization
E
Foreword
uel for life: household energy and health was
written and coordinated by Eva Rehfuess (WHO).
It draws on many previously published as well as
previously unpublished data. The latter include an
updated assessment of the burden of disease
attributable to solid fuel use by Sophie Bonjour (WHO)
and Annette Prüss-Üstün (WHO), solid fuel use
predictions by Sophie Bonjour and Eva Rehfuess, an
analysis of World Health Survey data on solid fuel use
according to income quintiles by Nirmala Naidoo
(WHO), and a cost-benefit-analysis of household energy
interventions by Guy Hutton (Swiss Tropical Institute),
Eva Rehfuess, Fabrizio Tediosi (Swiss Tropical
Institute) and Svenja Weiss (Swiss Tropical Institute).
The following individuals provided valuable contributions
and comments on all or parts of this publication:
Grant Ballard-Tremeer, HEDON Household Energy
Network
Jamie Bartram, Public Health and Environment,
WHO
Liz Bates, The Intermediate Technology
Group/Practical Action
Sophie Bonjour, Public Health and Environment,
WHO
Verena Brinkmann, German Technical Cooperation,
Germany
Nigel Bruce, University of Liverpool, England
Lisa Büttner, Winrock International
Diarmid Campbell-Lendrum, Public Health and
Environment, WHO
Jo Chandler, Shell Foundation, England
Carlos Corvalan, Public Health and Environment,
WHO
Laura Cozzi, International Energy Agency
Carlos Dora, Public Health and Environment,
WHO
Brenda Doroski, United States Environmental
Protection Agency, United States
Charles Gilks, HIV/AIDS, WHO
Bruce Gordon, Public Health and Environment,
WHO
Marlis Kees, German Technical Cooperation, Germany
Agnes Klingshirn, German Technical Cooperation,
Germany
Marcelo Korc, WHO Regional Office for the
Americas/Pan American Health Organization
Michal Krzyzanowski, WHO Regional Office for Europe
Daniel Mäusezahl, Swiss Agency for Development
and Cooperation, Switzerland
John Mitchell, United States Environmental
Protection Agency, United States
F
Maria Neira, Public Health and Environment,
WHO
Hisashi Ogawa, WHO Regional Office for the
Western Pacific
Kevin O'Reilly, HIV/AIDS, WHO
Annette Prüss-Üstün, Public Health and
Environment, WHO
Pierre Quiblier, United Nations Environment
Programme
Sumeet Saksena, The East West Centre, United States
Hanspeter Wyss, Swiss Agency for Development
and Cooperation, Switzerland
This publication was copy-edited by Susan Kaplan.
Design and layout was provided by Paprika.
Photo credits: cover: Nigel Bruce; page 3: Nigel Bruce;
page 5: Nigel Bruce; pages 7/8: Prabir Mallik, World
Bank; page 9: Curt Carnemark/World Bank; page 10:
Ray Witlin/World Bank; page 10, black margin: Nigel
Bruce; page 11: Karen Robinson/Practical Action;
page 12, black margin: Nigel Bruce; page 13/14,
black margin: Nigel Bruce; pages 13/14: Crispin
Hughes/Practical Action; page 15/16: David
Lederman/Photoshare; pages 17/18, black margin:
Creative Collection; page 17: Nigel Bruce/Practical
Action; pages 19/20 black margin: Nigel
Bruce/Practical Action; page 20 (top): Nigel
Bruce/Practical Action; page 20 (bottom): Mark
Edwards/Still Pictures; page 22 black margin: Anne
Tinker/Photoshare; page 22: Dominic Sansoni/World
Bank; page 23: Nigel Bruce/Practical Action; page 24,
black margin: Nigel Bruce/Practical Action; pages
25/26: Ray Witlin/World Bank; page 26, black margin:
Jorgen Schytte/Still Pictures; pages 27/28: Curt
Carnemark/World Bank; page 30 (top): Nigel
Bruce/Practical Action; page 30 (bottom): Nigel
Bruce; page 30, black margin: Nigel Bruce/Practical
Action; page 31: Nigel Bruce/Practical Action; page
32, black margin: Creative Collection; page 33: Nigel
Bruce; page 34: Nigel Bruce/Practical Action; page
35: Dominic Sansoni/World Bank; page 36: Curt
Carnemark/World Bank; page 36, black margin:
Chandrakant Ruparelia/Photoshare; page 37: Danielle
Baron/CCP/Photoshare.
This publication was made possible by the generous
support of the Swiss Agency for Development and
Cooperation (SDC), the United Kingdom Department
for International Development (DFID), the Swedish
International Development Agency (SIDA) and the
Norwegian Agency for Development Cooperation
(NORAD).
Acknowledgements
section
1
Household
Energy, Indoor
Air Pollution
and Health
7
6
8
Fuel for Life: Household Energy and Health
9
ooking as an enjoyable pastime and passion
for a privileged minority – on an electric range
or a gas stove in a stylish kitchen in New York, Paris
or Tokyo. Cooking as a chore and threat to the lives
of the great majority – on an open fire in a shabby
hut in rural Africa, south Asia or Latin America.
Worldwide, more than three billion people depend
on solid fuels, including biomass (wood, dung and
agricultural residues) and coal, to meet their most
basic energy needs: cooking, boiling water and
heating (Figure 1). Opening the door to their homes
makes for a hazy welcome: thick grey smoke fills
the air, making breathing unbearable and bringing
tears to the eyes. The inefficient burning of solid
fuels on an open fire or traditional stove indoors
creates a dangerous cocktail of hundreds of
pollutants, primarily carbon monoxide and small
particles, but also nitrogen oxides, benzene,
butadiene, formaldehyde, polyaromatic hydro-
carbons and many other health-damaging
chemicals. Day in day out, and for hours at a time,
women and their small children breathe in amounts
of smoke equivalent to consuming two packs of
cigarettes per day. Where coal is used, additional
contaminants such as sulfur, arsenic and fluorine
may also be present in the air.
Yet, these families are faced with an impossible
dilemma: don't cook with solid fuels, or don't eat a
cooked meal. Being poor condemns half of
humanity to dependence on polluting household
energy practices. With increasing prosperity,
cleaner, more efficient and more convenient fuels
are replacing, step-by-step, traditional biomass
fuels and coal. Climbing up the energy ladder tends
to occur gradually as most low- and middle-income
households use a combination of fuels to meet their
cooking needs (Figure 2).
The problem of indoor air pollution has been around
since the Stone Age, yet international development
agendas still fail to recognize that missing out on
clean energy equals missing out on life.
C
"The health of the people is really the
foundation upon which all their happiness
and all their powers as a state depend."
Benjamin Disraeli,
British statesman and writer (1804—1881)
Increasing use of cleaner, more efficient and
more convenient fuels for cooking
Increasing prosperity and development
Kerosene
Electricity
Natural gas
Solid fuels
Non-solid fuels
Very low income Low income Middle income High income
Ethanol, methanol
Gas, liquefied petroleum gas
Wood
Charcoal
Crop waste,
dung
Coal
Household energy:
three billion left behind
Figure 2: The energy ladder: household energy and development
inextricably linked
0%–25%
26%–50%
51%–75%
76%–100%
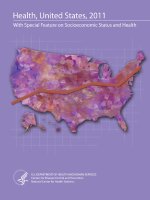
Figure 1: Energy poverty in people's homes
Percentage of population using solid fuels (Millennium
Development Goal indicator 29), 2003 or latest available data
Reproduced with permission from:
©
Myriad Editions
S
U
F
F
I
C
I
E
N
T
I
N
S
U
F
F
I
C
I
E
N
T
11
10
Fuel for Life: Household Energy and Health
lack soot covers the walls of the dwelling. It
is the pollutants in this black soot, as well as
many invisible pollutants in the air, that women and
children breathe in for many hours every day. Small
particles (with a diameter of up to 10 microns
(PM
10
)) are the most widely used indicator of the
health hazard of indoor air pollution. Fine particles
(with a diameter of up to 2.5 microns (PM
2.5
)) are
able to penetrate deep into the lungs and appear to
have the greatest health-damaging potential. It is
known that these particles can cause inflammation
of the airways and lungs and impair the immune
response, yet the precise mechanism by which
exposure to indoor air pollution translates into
disease is still unknown.
Burning solid fuels produces extremely high levels
of indoor air pollution: typical 24-hour levels of
PM
10
in biomass-using homes in Africa, Asia or
Latin America range from 300 to 3000 micrograms
per cubic metre (µg/m
3
). Peaks during cooking may
be as high as 10 000 µg/m
3
. By comparison, the
United States Environmental Protection Agency has
set the standard for annual mean PM
10
levels in
outdoor air at 50 µg/m
3
; the annual mean PM
10
limit
agreed by the European Union is 40 µg/m
3
. As
cooking takes place every day of the year, most
people using solid fuels are exposed to levels of
small particles many times higher than accepted
annual limits for outdoor air pollution (Figure 3).
The more time people spend in these highly
polluted environments, the more dramatic the
consequences for health. Women and children,
indoors and in the vicinity of the hearth for many
hours a day, are most at risk from harmful indoor air
pollution.
Since the mid-1980s, epidemiological studies have
been investigating the impacts of exposure to indoor
air pollution on health. The results of these studies
have recently been reviewed by WHO (Table 1).
Inhaling indoor smoke doubles the risk of
pneumonia and other acute infections of the lower
respiratory tract among children under five years of
age. Women exposed to indoor smoke are three
times more likely to suffer from chronic obstructive
pulmonary disease (COPD), such as chronic
bronchitis or emphysema, than women who cook
with electricity, gas or other cleaner fuels. And coal
use doubles the risk of lung cancer, particularly
among women.
B
Moreover, some studies have linked exposure to
indoor smoke to asthma; cataracts; tuberculosis;
adverse pregnancy outcomes, in particular low birth
weight; ischaemic heart disease; interstitial lung
disease, and nasopharyngeal and laryngeal cancers.
New research is needed to shed light on how
exposure to indoor smoke contributes to this long
list of health problems (see also Box 1).
Box 1: Better household energy practices to mitigate the HIV/AIDS crisis?
Winning the battle against HIV/AIDS calls for effective prevention and treatment. But it also requires that people maintain their
energy levels and physical fitness. Household energy plays a crucial role in keeping patients and their caregivers going: It is
indispensable for cooking safe, nutritious meals and for boiling water to ensure its safety for drinking. It is essential for preparing
hot compresses, heating water for bathing and sterilizing utensils for patients. And it provides warmth for those who are ill and
suffering.
In Africa, wood tends to be scarce where collected and expensive where purchased. The incomplete combustion of biomass fuels
indoors produces dense smoke, a major contributor to respiratory problems – even more so among immunocompromised HIV/AIDS
patients. Therefore, more efficient, cleaner household energy practices can help families affected by HIV/AIDS as well as those not
affected by the disease to live a healthier life.
Adapted from:
Gebert N. Mainstreaming HIV/AIDS: Participation or exclusion? Actors in the context of HIV/AIDS and project-induced measures (GTZ) for the optimized utilization of
subsistence resources. German Technical Cooperation Programme for Biomass Energy Conservation in Southern Africa (GTZ ProBEC), in press. Available at:
1
Strong evidence: Many studies of solid fuel use in developing countries, supported by evidence from studies of active and passive smoking, urban air pollution
and biochemical or laboratory studies.
Moderate evidence: At least three studies of solid fuel use in developing countries, supported by evidence from studies on active smoking and on animals.
Moderate I: strong evidence for specific age/sex groups. Moderate II: limited evidence.
2
The relative risk indicates how many times more likely the disease is to occur in people exposed to indoor air pollution than in unexposed people.
3
The confidence interval represents an uncertainty range. Wide intervals indicate lower precision; narrow intervals indicate greater precision.
Health outcome Evidence
1
Population Relative risk
2
Relative risk (95%
confidence interval)
3
Acute infections of the Strong Children aged 0–4 years 2.3 1.9–2.7
lower respiratory tract
Strong Women aged ≥ 30 years 3.2 2.3–4.8
Chronic obstructive
pulmonary disease
Moderate I Men aged ≥ 30 years 1.8 1.0–3.2
Lung cancer (coal) Strong Women aged ≥ 30 years 1.9 1.1–3.5
Moderate I Men aged ≥ 30 years 1.5 1.0–2.5
Lung cancer (biomass) Moderate II Women aged ≥ 30 years 1.5 1.0–2.1
Asthma Moderate II Children aged 5–14 years 1.6 1.0–2.5
Moderate II Adults aged ≥ 15 years 1.2 1.0–1.5
Cataracts Moderate II Adults aged ≥ 15 years 1.3 1.0–1.7
Tuberculosis Moderate II Adults aged ≥ 15 years 1.5 1.0–2.4
Health at the heart
of the matter
USEPA annual standard 50
3000
240
30
Berlin city centre Bangkok roadside Hut with open fire
USEPA, US Environmental Protection Agency.
Figure 3: Smoky streets, smoky homes
Typical 24-hour mean levels of small particles (PM
10
)
in micrograms per cubic metre (µg/m
3
), early 2000s
Table 1: Health impacts of indoor air pollution
13
12
Fuel for Life: Household Energy and Health
alaria, tuberculosis, HIV/AIDS and many other
diseases compete for newspaper headlines
–
and the attention of the public. How should decision-
makers prioritize one health problem against another?
The burden of disease combines years of life lost due to
death with the years of life lost due to disability in a
single measure that applies across diseases and health
risks. WHO investigates the contribution of a range of risk
factors, such as malnutrition, smoking and lack of
physical activity, to the burden of disease. The results for
the year 2000 unveiled cooking as a dangerous
undertaking and indoor air pollution from burning solid
fuel as one of the top ten global health risks. The "kitchen
killer" turned out to be responsible for 1.6 million deaths
and 2.7% of the global burden of disease. In poor
developing countries, only malnutrition, unsafe sex and
lack of clean water and adequate sanitation were greater
health threats than indoor air pollution.
This wake-up call placed indoor air pollution on the
international public health agenda for the first time. Yet,
the most recent and more accurate estimates show
practically no change. Globally, 1.5 million people died
from diseases caused by indoor air pollution in the year
2002. This figure includes children who died from
pneumonia and adults who died from chronic respiratory
disease and lung cancer
–
only those diseases for which
current evidence for a link with indoor air pollution is
sufficient (see Table 1). What if indoor smoke also turns out
to contribute to low birth weight and tuberculosis?
Reliance on polluting solid fuels (Figure 4) and inefficient
household energy practices varies widely around the
world, as does the death toll due to indoor smoke (Figure 5).
In 2002, Sub-Saharan Africa and South-East Asia led
with 396 000 and 483 000 deaths due to indoor smoke,
respectively. Widespread use of biomass and coal in
China plays a key role in chronic respiratory diseases
among adults, and was responsible for a large share of the
466 000 deaths in the Western Pacific in 2002.
Although the majority of the population in Latin America
and the Caribbean, the Eastern Mediterranean and
Europe use gas and other cleaner fuels for cooking, the
health burden disproportionately falls on the poorest
countries in these regions, and on the poorest members
of society among whom solid fuel use is still common (see
Figure 6 and Trapped by energy poverty).
Indoor air pollution continues to ravage rural
communities and poor urban dwellers. And it continues to
be largely ignored by the world community.
M
WHO subregion
Deaths per 100 000
0 50 100 150 200 250 300 350 400
WprB
SearD
SearB
EurC
EurB
EmrD
EmrB
AmrD
AmrB
AfrE
AfrD
Figure 5: translates into respiratory deaths
Deaths attributable to indoor air pollution per 100 000 population, by WHO subregion
1
, 2002
1
WHO distinguishes between the following geographical regions: African Region (Afr); Region of the
Americas (Amr); Eastern Mediterranean Region (Emr); European Region (Eur); South-East Asia Region
(Sear); Western Pacific Region (Wpr). WHO also differentiates between the following mortality strata: very
low child, very low adult (A); low child, low adult (B); low child, high adult (C); high child, high adult
(D); high child, very high adult (E).
WHO subregion
Percentage of population using solid fuels
0102030405060708090
WprB
SearD
SearB
EurC
EurB
EmrD
EmrB
AmrD
AmrB
AfrE
AfrD
Figure 4: Widespread solid fuel use
Percentage of population using solid fuels, by WHO subregion
1
, 2003 or latest available data
1
WHO distinguishes between the following geographical regions: African Region (Afr); Region of the
Americas (Amr); Eastern Mediterranean Region (Emr); European Region (Eur); South-East Asia Region
(Sear); Western Pacific Region (Wpr). WHO also differentiates between the following mortality strata: very
low child, very low adult (A); low child, low adult (B); low child, high adult (C); high child, high adult
(D); high child, very high adult (E).
"Are we to decide the importance of issues by
asking how fashionable or glamorous they are? Or
by asking how seriously they affect how many?"
Nelson Mandela,
South African statesman and winner
of the Nobel Prize for Peace (1918–)
The killer in the kitchen
section
2
Household
Energy and
the Millennium
Development
Goals
15
14
Figure 6: Poverty and energy poverty go hand in hand
Percentage of population using solid fuels in some of the
world's largest countries, by income quintiles in urban
(top) and rural (bottom) locations, 2003
1716
Fuel for Life: Household Energy and Health
n September 2000, the largest-ever gathering
of Heads of State committed themselves to
making the right to development a reality for
everyone. The Millennium Declaration promotes a
comprehensive approach that tackles a broad range
of problems simultaneously. By 2015, the world
aims to have achieved eight goals for combating
poverty, hunger, disease, illiteracy, environmental
degradation and discrimination against women.
There is no Millennium Development Goal on
energy. Yet, energy poverty is one of the many
manifestations of poverty and a prevailing feature of
deprived rural and urban households in developing
countries (Figure 6). Lack of energy, in particular
lack of access to modern cooking fuels and
electricity, already represents a bottleneck, holding
back progress towards achieving the goals. Rather
than squeezing through the bottleneck, the United
Nations Millennium Project proposes to confront
the energy issue directly (see The need for a
quantum leap). Improved energy services can
reduce child mortality rates, improve maternal
health, reduce the time and transport burden on
women and young girls, and lessen the pressure on
fragile ecosystems (Table 2).
Halving the number of people without effective
access to modern cooking fuels by 2015 and
making improved cooking stoves widely available
represents a stepping stone towards achieving the
Millennium Development Goals.
I
"We will spare no effort to free our fellow men, women and
children from the abject and dehumanizing conditions of
extreme poverty, to which more than a billion of them are
currently subjected."
United Nations Millennium Declaration
Energizing the Millennium
Development Goals
poorest quintile
richest quintile
Percentage of rural population using solid fuels
B
a
n
g
la
d
e
sh
B
ra
z
il
C
h
in
a
E
th
io
p
ia
In
d
ia
M
e
x
ic
o
R
u
s
sia
n
F
e
d
e
ra
tio
n
S
o
u
th
A
fric
a
100
90
80
70
60
50
40
30
20
10
0
Millennium Development Goals Contribution of improved household energy practices
Goal 1: Eradicate extreme poverty and hunger
◆
Saving time spent being ill or having to care for sick children will cut
health care expenses and increase earning capacities.
◆
Where fuels are purchased, increasing fuel efficiency and thus cutting
down on the quantity of fuel needed will ease constraints on already
tight household budgets.
◆
Improved household energy technologies and practices will open up
opportunities for income generation.
◆
Access to electricity will provide a source of light for economic
activities in the evening and a source of energy for operating, for
example, a sewing-machine or refrigerator.
Goal 2: Achieve universal primary education
◆
With less time lost in collecting fuel and due to ill health, children will
have more time available for school attendance and homework.
◆
Better lighting will allow children to study outside of daylight hours and
without putting their eyesight at risk.
Goal 3: Promote gender equality and empower women
◆
Alleviating the drudgery of fuel collection and reducing cooking time will
free women's time for productive endeavours, education and child care.
◆
Reducing the time and distance that women and girls need to travel to
collect fuel will reduce the risk of assault and injury, particularly in
conflict situations.
◆
Involving women in household energy decisions will promote gender
equality and raise women's prestige.
Goal 4: Reduce child mortality
◆
Reducing indoor air pollution will prevent child morbidity and mortality
from pneumonia.
◆
Protecting the developing embryo from indoor air pollution can help
avert stillbirth, perinatal mortality and low birth weight.
◆
Getting rid of open fires and kerosene wick lamps in the home can
prevent infants and toddlers being burned and scalded.
Goal 5: Improve maternal health
◆
Curbing indoor air pollution will alleviate chronic respiratory problems
among women.
◆
A less polluted home can improve the health of new mothers who spend
time close to the fire after having given birth.
◆
A more accessible source of fuel can reduce women's labour burdens
and associated health risks, such as prolapse due to carrying heavy
loads.
Goal 6: Combat HIV/AIDS, malaria and other diseases
◆
Lowering levels of indoor air pollution levels can help prevent 1.6
million deaths from tuberculosis annually.
Goal 7: Ensure environmental sustainability
◆
Where biomass is scarce, easing the reliance on wood for fuel through
more efficient cooking practices will lessen pressures on forests.
◆
Moving up the energy ladder and using improved stoves can increase
energy efficiency and decrease greenhouse gas emissions.
Goal 8: Develop a global partnership for development
◆
Recognition in development agendas and by partnerships of the
fundamental role that household energy plays in economic and social
development will help achieve the Millennium Development Goals by
2015.
Table 2: Cracking the energy code
Percentage of urban population using solid fuels
B
a
n
g
la
d
e
s
h
B
ra
zil
C
h
in
a
E
th
io
p
ia
In
d
ia
M
e
x
ic
o
R
u
ssia
n
F
e
d
e
ra
tio
n
S
o
u
th
A
fric
a
100
90
80
70
60
50
40
30
20
10
0
Figure 7: Energy – a major expenditure
for poor households
1918
Fuel for Life: Household Energy and Health
xtreme poverty remains a daily reality for
more than 1 billion people who survive on
less than 1$ per day
1
. Being poor means getting up
hungry in the morning, anxious where to find
enough food to make it through to the evening (Box
2). Being poor means being forced to accept any
work there is and being denied a good school
education. Being poor means living in an
overcrowded smoky dwelling that lacks sufficient
water for drinking, hand-washing and personal
hygiene. Being poor means not having the freedom
to make choices.
Millennium Development Goal 1, to eradicate
extreme poverty and hunger, represents the essence
of the Millennium Declaration. Dependence on
polluting inefficient household energy practices
stops people from breaking out of the vicious cycle
of poverty.
Good health is crucial as household livelihoods rely
on the health of family members. Being ill as a
result of indoor smoke or having to care for sick
children reduces earnings and leads to additional
expenses for health care and medication. Broken
bones, backache and snake bites endured during
fuel collection add to the problem. Reports from
war zones and refugee camps provide sad testimony
of girls and women being assaulted when they leave
the relative safety of their homes to collect fuel.
Where fuel is purchased, for example in urban
slums in Africa and Asia, spending money on large
quantities of inefficient fuels places severe
constraints on household budgets. Poor households
tend to spend a larger percentage of their income
on energy than well-off households (Figure 7).
Where fuel is collected, women and children lose
many hours a week searching for wood branches
and twigs (Figure 8). Fuel collection is not
necessarily a daily task, as the duration and
frequency of collection varies depending on the
availability of wood for use as a fuel. In rural India,
E
Trapped by energy poverty
for example, daily fuel collection time ranges from
only 20 minutes per day in Andhra Pradesh to more
than one hour per day in Rajasthan, which is mostly
covered by desert. Cooking, serving foods and
washing the soot-laden pots adds to this time
burden, eating up about three hours of women's
time every day.
Alleviating the drudgery of collecting fuel far from
home and easing the task of cooking through
ownership of more efficient devices can free
women's time for productive endeavours, education,
child care and relaxation. With less time wasted on
collecting wood and being ill, children will have
more time available to attend school, do their
homework and enjoy childhood. Finally, involving
women in household energy decisions promotes
gender equality and empowers women. Owning a
less-polluting stove raises a woman's prestige – both
by being a sign of wealth and, indirectly, through
providing a soot-free kitchen environment.
poorest quintile
richest quintile
Percentage of household income spent on energy
E
th
io
p
ia
In
d
ia
S
o
u
th
A
fric
a
U
g
a
n
d
a
16
14
12
10
8
6
4
2
0
Box 2: Too little wood for too many people: household
energy and hunger
Where wood supplies are scarce, unsustainable harvesting of fuel
endangers agricultural production and threatens a stable supply
of crops. Deforestation and ensuing erosion damage formerly
fertile fields; this is particularly true where trees are felled for
charcoal production to supply urbanizing areas of Africa with
fuel. Resorting to dung as a lower-grade fuel interrupts the
normal composting process and diverts the dung from being used
as a natural soil fertilizer. In the absence of any chemical
fertilizers, this will ultimately reduce field productivity.
For these reasons, improving household energy practices will also
boost agricultural productivity and food security. By restoring
natural soil fertility, they reduce expenditure on chemical
fertilizers. Higher fuel efficiency frees women's time for growing
food and tending animals.
1
$ Purchasing power parities (PPPs): These conversion rates
equalize the purchasing power of different currencies by
eliminating the differences in price levels between countries.
Adapted with permission from:
International Energy Agency, OECD. World Energy
Outlook 2002. Paris, International Energy Agency and
OECD, 2002. Table 13.1.
Figure 8: Time ticking away
Daily hours that women spend collecting fuel in different African
geographical settings, by country, 1990–2003
Hours per day
B
o
ts
w
a
n
a
B
u
rk
in
a
F
a
so
E
th
io
p
ia
G
h
a
n
a
K
e
n
y
a
M
a
la
w
i
N
a
m
ib
ia
N
ig
e
r
N
ig
e
ria
S
o
u
th
A
fric
a
U
g
a
n
d
a
U
n
ite
d
R
e
p
u
b
lic
o
f T
a
n
z
a
n
ia
Z
a
m
b
ia
Z
im
b
a
b
w
e
4.5
4
3.5
3
2.5
2
1.5
1
0.5
0
Sources:
Dutta S. Energy as a key variable in eradicating extreme poverty and hunger: A gender and
energy perspective on empirical evidence on MDG 1. In: Gender as a key variable in energy
interventions. Draft background paper for ENERGIA/DfID/KaR Research Project R8346. 2005.
Available at: />Hutton G, Rehfuess E, Tediosi F, Weiss S. Evaluation of the costs and benefits of household energy
and health interventions at global and regional levels. Geneva, World Health Organization, in press.
Figure 10: African and South-East Asian children suffer
disproportionately
Deaths in children aged under five years from pneumonia
and other acute infections of the lower respiratory tract due
to indoor air pollution, by WHO region, 2002
21
20
Fuel for Life: Household Energy and Health
ver 10 million children aged under five years
die every year – 99% of them in developing
countries. "To reduce by two-thirds the under-five
mortality rate between 1990 and 2015" may be the
most ambitious of the Millennium Development
Goals.
Globally, pneumonia remains the single most
important child killer and is responsible for 2 million
deaths every year (Figure 9). Newborns and infants
are often carried on their mother's back while she
is cooking, or kept close to the warm hearth.
Consequently, they spend many hours breathing
polluted air during their first year of life when their
developing airways and their immature immune
systems make them particularly vulnerable. Indoor
smoke is one of the underlying causes and to
blame for nearly 800 000 child deaths annually.
These deaths are not equally distributed
throughout the world: more than one third of the
child deaths due to indoor smoke, that is 358 000
deaths, occur on the African continent, and
another 288 000 child deaths occur in South-East
Asia (Figure 10).
In most societies, women are in charge of cooking.
Day after day, and often throughout the course of a
lifetime, they spend many hours in the vicinity of
the fire or stove. The acrid smoke depositing soot in
their lungs is responsible for 511 000 of the 1.3
million deaths due to COPD among women
worldwide per year. In contrast, only 173 000 of a
total of 1.4 million deaths from COPD among men
are due to indoor smoke (Figure 11). Inefficient
household energy practices may be of particular
significance to the health of pregnant women:
carrying heavy loads during fuel collection may
bring about prolapse during pregnancy, and
exposure of the developing embryo to harmful
pollutants may lead to low birth weight as well as
stillbirth.
Users of solid fuels in developing countries tend to
be poor and, especially in rural areas, are unlikely
to live in the vicinity of health care facilities. Their
ability to afford medical treatment and to seek
medical care for themselves and their sick children
is limited. Consequently, trying to reduce the
number of deaths from pneumonia through
treatment may not benefit the poorest of the poor.
O
"Her three children were blinking at me in the darkness from behind her skirt. The
woman was extremely ill and had a racking cough, and I remember the blackness
inside the home and the stench of wood smoke which was overpowering."
Hilary Benn,
currently Secretary of State for International Development,
United Kingdom, reminiscing about a visit to Northern Ethiopia
Women and children
overlooked
And, even if a child is successfully treated for
pneumonia, he or she will have to return to a home
where high levels of indoor air pollution prevail in
combination with other threats to health, such as
overcrowding and an inadequate diet.
In contrast, switching to cleaner fuels and
increasing fuel efficiency through better stoves can
reduce health risks for all family members. Beyond
curbing respiratory problems, a more secure
household energy situation enables water to be
boiled and thus helps reduce the incidence of
water-borne diseases. It can also increase the
number of hot meals consumed per day and thus
improve food safety and nutrition. A closed, raised
stove prevents infants and toddlers falling into the
fire or knocking over pots of hot liquid and being
burned or scalded.
Closing the household energy gap can therefore be
a springboard for achieving the health-related
Millennium Development Goals.
Figure 9: Pneumonia is a major child killer
Percentage of deaths in children under five years of age, by cause, 2000–2003
Other, 7%
Tetanus, 7%
Diarrhoea, 3%
Sepsis, pneumonia, 26%
Asphyxia, 23%
Congenital, 8%
Preterm, 28%
Neonatal
37%
Malaria
8%
Diarrhoea
17%
Pneumonia
19%
Others
10%
HIV/AIDS
3%
Injuries
3%
Measles
4%
Causes of neonatal deaths
Undernutrition is an underlying cause of 53% of deaths among children under five years of age.
Number of deaths (000)
400
350
300
250
200
150
100
50
0
WHO distinguishes between the following geographical regions: African Region
(Afr); Region of the Americas (Amr); Eastern Mediterranean Region (Emr); European
Region (Eur); South-East Asia Region (Sear); Western Pacific Region (Wpr).
Afr Amr Emr Eur Sear Wpr
WHO region
Figure 11: Women most at risk
Deaths from chronic obstructive pulmonary disease due to
indoor air pollution, by gender and WHO region, 2002
Number of deaths (000)
350
300
250
200
150
100
50
0
WHO distinguishes between the following geographical regions: African
Region (Afr); Region of the Americas (Amr); Eastern Mediterranean Region
(Emr); European Region (Eur); South-East Asia Region (Sear); Western Pacific
Region (Wpr).
Afr Amr Emr Eur Sear Wpr
WHO region
Women
Men
2322
Fuel for Life: Household Energy and Health
uman survival and prosperity are critically
dependent on the environment. Complex
ecosystems ensure a continuous supply of food and
fresh water and provide wood and other natural
resources for our use. They regulate our climate and
protect us from floods and other natural disasters.
Ecosystems have shown a remarkable capacity to
accommodate more and more of our needs, yet, this
very foundation of our existence is now threatened
by population growth and the unsustainable use of
natural resources.
2.4 billion people burn biomass fuels on a daily
basis to boil water and to cook food. As a result 2
million tonnes of biomass are going up in smoke
every day. This may not pose a problem where the
growth of new trees outpaces human demand. Yet,
where wood is scarce and the population is dense,
wood collection can put considerable pressure on
forests. During the 1990s, forest plantations
rendered unproductive due to illegal cutting of
wood for fuel were a common sight in China and
provided the main motivation for the establishment
of the Chinese National Improved Stoves
Programme (see Rolling out household energy
programmes: learning from the past). In
geographical hotspots in parts of Latin America and
South-East Asia, alarming rates of deforestation are
leading to land degradation and desertification.
Many countries in sub-Saharan Africa have
witnessed the depletion of more than three quarters
of their forest cover (Figure 12).
As plants, soils and oceans struggle to absorb rising
emissions, carbon dioxide (CO
2
) is building up in
the atmosphere. This greenhouse gas is beginning
to change our climate, leading to increased
temperatures, changes in rainfall patterns and more
frequent extreme weather events. The use of
biomass fuels and coal for cooking and heating
accounts for between 10% and 15% of global
energy use. Yet household use of these fuels does
not feature prominently in discussions on global
warming and climate change. Moreover, because
they are classified as renewable sources of energy,
it is mistakenly assumed that biomass fuels are
always harvested and used in a sustainable way.
The burning of biomass fuels in poor homes in the
developing world does not convert all fuel carbon
into CO
2
and water. Open fires and traditional
stoves tend to be highly inefficient and lose a large
H
"Over the last 50 years, humans have changed ecosystems more
rapidly and extensively than in any comparable period of time in
human history, largely to meet rapidly growing demands for food, fresh
water, timber, fibre and fuel The degradation of ecosystem services
could grow significantly worse during the first half of this century and
is a barrier to achieving the Millennium Development Goals."
Millennium Ecosystem Assessment, 2005
Stripping our forests,
heating our planet
percentage of the fuel energy as so-called products
of incomplete combustion. These include the
potent greenhouse gas methane (CH
4
), which stays
in the atmosphere for decades. When combining
the emissions of CO
2
and other greenhouse gases in
a single index, wood, crop residues and dung score
much higher than fossil fuels, such as kerosene and
liquefied petroleum gas (LPG) (Figure 13). This
holds true, even where biomass fuels are renewably
harvested. Notably, to deliver the same amount of
energy, dung used in a biogas digestor produces
only 1% of the greenhouse gas emissions of those
produced by dung burnt in a traditional stove (see
Box 6).
Introducing household energy practices that, in
addition to decreasing levels of indoor smoke, save
fuel and reduce greenhouse gas emissions can
make an important contribution to achieving
Millennium Development Goal 7. This is why the
proportion of the population using solid fuels is one
of the indicators used to assess progress towards
reversing the loss of environmental resources (see
Figure 1).
Figure 12: World's forests on the decline
Percentage change in forest cover per year, 2000–2005
Reproduced with permission from:
Food and Agricultural Organization. Global Forest Resources Assessment 2005. Available at: />> 0.5% decrease per year > 0.5% increase per year change rate below 0.5% per year
Grams carbon as CO
2
per MJ delivered
0 100 200 300 400 500 600
Biogas
LPG
Kerosene
Wood (sustainable
harvesting)
Wood (unsustainable
harvesting)
Crop residues
Dung
Figure 13: Household energy and global warming
Adapted with permission from:
Smith KR, et al. Greenhouse implications of household stoves: an analysis for India. Annual Review of Energy and the Environment,
2000, 25:741–763
20-year greenhouse gas emissions in grams carbon as CO
2
emitted per megajoule (MJ)
◆
based on established greenhouse gases, carbon dioxide (CO
2
), methane (CH
4
) and nitrogen dioxide (N
2
O);
◆
based on established and additional greenhouse gases, carbon monoxide (CO) and non-methane hydrocarbons (NMHC).
Emissions from different fuel/stove combinations in India were systematically assessed using a standardized cooking test.
established
greenhouse gases
additional
greenhouse gases
2524
Fuel for Life: Household Energy and Health
nergy enables basic human needs to be met:
cooking food, providing light and hauling water
from a well. Energy underlies all economic activity,
such as growing crops, selling agricultural products
in a shop and delivering them to consumers.
The United Nations Millennium Project highlights
the role of energy services, in particular, modern
cooking fuels, as a prerequisite for development
(see Energizing the Millennium Development
Goals). It calls on countries to adopt the following
energy target to pave the way for achieving the
Millennium Development Goals: "By 2015, to
reduce the number of people without effective
access to modern cooking fuels by 50%, and make
improved cooking stoves widely available". For this
target to become a reality, 1.7 billion people will
need to gain access to LPG, natural gas, biogas
and other modern fuels (Figure 14). In other
words, every day, between now and 2015, these
energy services will need to be extended to 485
000 people. Reaching the target would still leave
1.5 billion people cooking with solid fuels.
An ever-changing world adds to the challenge.
Globally, 840 000 more people were using cleaner
fuels in 2003 than in 1990, corresponding to a
drop in solid fuel use from 58% to 52% of the
population. Yet, because of population growth, the
actual number of people using solid fuels has not
gone down but rather gone up by 170 000. Energy
poverty goes hand in hand with lack of energy
infrastructure, such as a distribution network for
LPG or an electricity grid. And lack of energy
infrastructure is a common feature of isolated
rural communities and rapidly growing urban
slums. Achieving the energy target requires
outpacing population growth and reaching those
hardest to reach.
A way to escape energy poverty, a way to escape
poverty. According to the International Energy
Agency (IEA), we can only halve poverty by 2015
if the number of people relying on traditional
biomass for cooking and heating is reduced to less
than 1.85 billion. According to the IEA's reference
scenario, however, this number will increase to
2.55 billion in 2015 (Figure 15). Electricity is
E
unlikely to become an important cooking fuel in
most developing countries in the foreseeable
future. Yet, access to electricity has a profound
impact on people's lives, and represents a
necessary precondition to moving up the
development ladder. Nevertheless the number of
people without electricity in 2015 will remain
practically unchanged and a long way from the 1
billion required to halve the proportion of people
living on less than 1$ per day (Figure 15).
A rigorous acceleration of energy provision is needed
to break the vicious cycle of energy poverty and lack
of development in the world's poorest countries.
Figure 14: Trends in solid fuel use
Population using solid fuels (millions), 1990, 2003 (mid-point) and 2015
Reproduced with permission from:
International Energy Agency, OECD. World
Energy Outlook 2004. Paris, International
Energy Agency and OECD, 2004. Figure 10.11.
Data for 2015 are based on:
◆
a business-as-usual scenario that applies the observed annual increase in the
number of people with access to cleaner fuels from 1990 to 2003 to the
period 2003 to 2015;
◆
the voluntary Millennium Development Goal (MDG) target proposed by the UN
Millennium Project to halve the number of people without access to modern
cooking fuels between 1990 and 2015.
Non-solid fuel users
Solid fuel users
million people
8000
7000
6000
5000
4000
3000
2000
1000
0
1990 2003 2015
2015 MDG
WHO region
People to gain access
to cleaner fuels to
reach the voluntary
MDG energy target
Figure 15: Better access to household energy can lift people out of poverty
Million people in developing countries without electricity and relying on traditional biomass, 2002 and 2015
Data for 2015 are based on:
◆
the International Energy Agency
(IEA) reference scenario;
◆
the energy requirement to achieve
the Millennium Development Goal
(MDG) target to halve poverty.
2002
2015 reference scenario
2015 MDG target
million people
2500
2000
1500
1000
500
0
People without electricity
People relying on traditional biomass
People to
switch away
from traditional
biomass to
reach MDG
People to gain
access to
electricity to
reach MDG
The need
for a quantum leap
section
3
The Way
Forward
27
26
2928
Fuel for Life: Household Energy and Health
ractical solutions to the indoor smoke problem
must reduce pollution levels substantially to curb
disease. But first and foremost, interventions must
meet the needs of users at least as well as the facilities
they started off with. Women should be able to prepare
typical dishes with ease, as well as baking bread or
following other local customs. In cold regions, tackling
heating requirements should be part of the planning
process. Beyond meeting the users' immediate energy
needs, interventions should also cut the amount of fuel
needed, minimize the risk of burns and relieve the
drudgery of women and children.
These interventions do exist (Table 3). Switching from
wood, dung or charcoal to more efficient modern fuels,
such as kerosene, LPG and biogas, brings about the
largest reductions in indoor smoke. A study in rural
Tamil Nadu, India, compared the levels of respirable
particles between homes where cooking was done
using gas or kerosene and homes using wood or animal
dung. Average pollution levels of 76 µg/m
3
and 101
µg/m
3
in kitchens using kerosene and gas, respectively,
contrasted with levels of 1500 to 2000 µg/m
3
in
kitchens where biomass fuels were used.
In many poor rural communities, however, access to
these alternatives is limited and biomass remains the
most practical fuel. Here, improved stoves
– provided they are adequately designed, installed and
maintained – can cut back indoor smoke levels
considerably. Cheap wood-burning stoves in East Africa
lower pollution by 50%; plancha stoves in Latin
America reduce indoor smoke levels by as much as
90%. These stoves reduce a family's exposure to
P
Coming clean: modern
fuels, modern stoves
harmful pollutants by optimizing combustion, venting
smoke to the outside through a flue and chimney and,
in some cases, reducing cooking times. A recent World
Bank study in Bangladesh found that stove location
and housing construction matter and that better
ventilation of the cooking and living area may be a
partial remedy. Eaves spaces, extraction through smoke
hoods (Box 3) and even keeping doors open during
cooking can curb levels of carbon monoxide and
particulate matter substantially.
Changing behaviours also plays a role in reducing
exposure to indoor smoke. Drying fuel wood before use
improves combustion and lowers smoke production.
Using lids on pots cuts cooking time. Young children
who are kept away from the smoking hearth breathe in
less of the health-damaging pollutants. Such changes
are unlikely to bring about reductions as great as those
from switching to a cleaner fuel or the installation of a
chimney stove, but they are important supporting
measures for all interventions.
Yet, one crucial link is missing: By how much do we
need to lower pollution levels to make a real difference
to people's health? As illustrated above, several
intervention studies have documented a reduction in
indoor air pollution levels, but have not made the link
with health. To date, only one study has investigated
the impact of an improved stove on childhood
pneumonia and women's respiratory health (Box 4).
Therefore, we cannot yet draw clear-cut conclusions
about which interventions are most effective in saving
children's and women's lives. Additional research is
urgently needed to answer this question.
Box 3: A hooded solution for a Maasai community
in rural Kenya
In Kenya, 96% of the population lack access to grid electricity
and more than 80% of the population rely on solid fuels. Maasai
women in the Kajiado region cook and heat with wood, cattle
dung and crop residues. Fires are often kept smouldering
throughout the day and night, leading to very high levels of
indoor smoke. The Intermediate Technology Development
Group/Practical Action (ITDG/Practical Action) has worked with
local women to solve this problem.
Participatory approaches accompanied the solution from
beginning to end. Repeated talks with the Maasai community
revealed the many health and social problems associated with
indoor smoke. From a range of options, the women cooks decided
on a simple and affordable smoke hood as the solution that best
suited their needs. Together with local artisans, ITDG/Practical
Action developed and tested a hood that draws smoke straight
from the fire and out through the roof. Installed into people's
homes, this smoke hood cut down the concentration of respirable
particles by up to 80%, from more than 4300 µg/m
3
to about
1000 µg/m
3
.
Adapted from:
ITDG/Practical Action. Reducing indoor air pollution in rural households in Kenya: working
with communities to find solutions. The ITDG Smoke and Health Project, 1998–2001.
Available at: />Box 4: Testing the plancha stove in the highlands
of Guatemala
The first ever randomized controlled trial of an improved chimney stove
has just been completed in the province of San Marcos in Western
Guatemala. Researchers from the Universidad del Valle, the University
of California at Berkeley, United States, and the University of Liverpool,
England, are trying to find out whether the plancha stove makes a real
difference to the health of children and their mothers.
A new stove was installed in 250 homes in the small mountainous
community of San Lorenzo; 250 so-called control homes continued to cook
on an open fire. Over a two-year period, all children aged less than 18
months were assessed for pneumonia to compare the health of children
living in a home with a plancha stove with that of children living in a home
with an open fire. Every week, field workers visited the homes to identify
any sick children and to refer them to the study physicians for a thorough
examination. The researchers also collected information on differences
between smoke levels, women's respiratory health, heart disease and
childhood asthma in the homes with and without the plancha stove.
The Guatemala trial represents the most sophisticated intervention
study undertaken to date. The health and household energy community
is waiting with great interest for the results to shed light on how much
an improved stove can reduce childhood pneumonia.
Adapted from:
University of California at Berkeley. Stove intervention study in the Guatemalan highlands.
Available at: />Changing the source of pollution Improving the living environment Modifying user behaviour
Improved cooking devices Improved ventilation Reduced exposure by changing cooking practices
◆
Improved stoves without flues
◆
Smoke hoods
◆
Fuel drying
◆
Improved stoves with flues
◆
Eaves spaces
◆
Pot lids to conserve heat
◆
Windows
◆
Food preparation to reduce cooking
Alternative fuel-cooker combinations time (e.g. soaking beans)
◆
Briquettes and pellets Kitchen design and placement of the stove
◆
Good maintenance of stoves,
◆
Kerosene
◆
Kitchen separate from house reduces exposure chimneys and other appliances
◆
Liquefied petroleum gas of family (less so for cook)
◆
Biogas
◆
Stove at waist height reduces direct exposure Reduced exposure by avoiding smoke
◆
Natural gas, producer gas of the cook leaning over fire
◆
Keeping children away from smoke
◆
Solar cookers (e.g.in another room if available and
◆
Modern biofuels (e.g. ethanol, plant oils) safe to do so)
◆
Electricity
Reduced need for fire
◆
Retained heat cooker (haybox)
◆
Efficient housing design and construction
◆
Solar water heating
◆
Pressure cooker
Table 3: Getting rid of smoke and soot
"All scientific work is incomplete – whether it be observational
or experimental. All scientific work is liable to be upset or
modified by advancing knowledge. That does not confer upon us
a freedom to ignore the knowledge we already have, or to
postpone the action that it appears to demand at a given time."
Sir Austin Bradford Hill,
English epidemiologist
and statistician (1897–1991)
3130
Fuel for Life: Household Energy and Health
aking sound policy decisions is hard. Too many
problems need to be tackled, and too many
priorities compete for too little money. This holds even
more true for household energy, an issue that concerns
many sectors and tends to fall between the cracks of
responsibilities: It is an energy problem, but it is not a
traditional concern of the energy sector. It is a health
problem, but the answer only partly lies within the health
sector. It is an environmental problem, but the environment
sector is often too isolated to put solutions into practice.
First and foremost, we need to identify those technical
fixes and strategies that can effectively solve the problem
(see Coming clean: modern fuels, modern stoves and
Rolling out household energy programmes: learning from
the past). Moreover, we should try to make the best use
of scarce resources. One of the tools that can help
decision-makers allocate their limited budgets is
economic evaluation.
Cost-effectiveness analysis can help in judging the
potential return on investment in one health intervention
against another. For example, how can the Ministry of
Health make the best use of US$ 1 million to reduce
child mortality due to pneumonia? Cost-effectiveness
analysis can help them to decide whether it is better to
invest in a new vaccination programme against
Haemophilus influenza b, one of the most common
infectious agents causing pneumonia, or to scale up
existing efforts to treat sick children with antibiotics.
WHO has applied this approach to interventions to reduce
indoor air pollution (Table 4). The results should,
however, be treated with caution, as cost-effectiveness
analysis only considers the benefits of these interventions
from the point of view of the health sector.
Cost-benefit analysis, on the other hand, values all
benefits against all costs from the point of view of society
as a whole. It is thus a more suitable tool for investigating
investments with many different impacts on people's lives.
The Ministry of Finance may ask how it can best reduce
rural poverty over a ten-year timeframe? Should the top
priority be to intensify educational programmes for rural
children? Or is it best to provide people with access to
electricity, thus providing opportunities for evening study
and additional activities to generate income?
As highlighted in this publication, household energy
interventions bring about a wide range of benefits: they
improve children's and women's health, save time and
money, promote gender equality, reduce deforestation
and curb greenhouse gas emissions. A cost-benefit
M
Investing in household
energy pays off
"Strong reasons make strong actions."
William Shakespeare,
English dramatist and poet
(1564–1616)
analysis, recently conducted by WHO, evaluated different
intervention scenarios for meeting the voluntary MDG
energy target (see The need for a quantum leap). Globally,
the analysis shows a payback of US$ 91 billion a year
from the US$ 13 billion a year invested to halve the
number of people cooking with solid fuels by providing
them with access to LPG by 2015. (For ethanol, due to
higher fuel prices and lower fuel efficiency, the
investment increases to US$ 43 billion a year for the
same economic benefit.) Making improved stoves
available, by 2015, to half of those still burning biomass
fuels and coal on traditional stoves, would result in a
negative intervention cost of US$ 34 billion a year as the
fuel cost savings due to greater stove efficiency exceed
the investment costs. This generates an economic return
of US$ 105 billion a year over a ten-year period (Table 5).
Time gains from reduced illness, fewer deaths, less fuel
collection and shorter cooking times, valued at Gross
National Income (GNI) per capita, account for more than
95% of the benefits. There is debate on the appropriate
valuation of time. When these time gains are
conservatively valued at 30% of GNI per capita for adults
and 0% of GNI for children, the economic payback
decreases to US$ 31 billion a year for LPG and US$ 33
billion a year for improved stoves.
A global cost-benefit analysis is highly dependent on data
quality and assumptions. To guide decision-making at the
national level, an analysis should be conducted for a given
country or setting. Nevertheless, the global cost-benefit
analysis illustrates the enormous potential of household
energy interventions and suggests that these are a
worthwhile investment. It is time to roll out programmes
that can make a real difference to the lives of the poor and
that open up the road to the modern world.
Intervention scenarios:
1
Providing 100% of the population with access to liquefied petroleum gas.
2
Providing 100% of the population with improved stoves.
3
Providing 50% of the population with liquefied petroleum gas and 45% with improved stoves.
Table 4: Improved stoves and clean fuels can be cost-effective health interventions
Cost-effectiveness ratios for interventions to reduce indoor air pollution (International $ (I$) per healthy year gained), 2002
Intervention Africa The Americas Eastern Mediterranean Europe South-East Asia Western Pacific
scenario
1
2
3
AfrD AfrE AmrB AmrD EmrB EmrD EurB SearB SearD WprB
Table 5: Remarkable returns from investing in household energy
Benefits of household energy and health interventions (US$ million), by type of benefit, 2005
If 50% of the population cooking If 50% of the population cooking
If 50% of the population cooking
with solid fuels in 2005 switch with solid fuels in 2005 switch with solid fuels in 2005 switch
to cooking with liquefied to cooking with modern to cooking on an improved
petroleum gas by 2015 biofuels by 2015 stove by 2015
Health care savings 384 384 65
Time savings due to childhood 1 460 1 460 510
and adult illness prevented:
school attendance days gained
for children and productivity gains
for children and adults
Time savings due to less time 43 980 43 980 88 100
spent on fuel collection and
cooking: productivity gains
Value of deaths averted among 38 730 38 730 13 560
children and adults
Environmental benefits 6 070 5 610 2 320
Total benefits 90 624 90 164 104 555
Costs and benefits of different intervention scenarios were estimated using 2005 as the base year and a 10-
year time horizon, taking into account demographic changes over this period. The analysis was conducted
for 11 WHO subregions to reflect variations in (i) the availability, use and cost of different fuels and stoves;
(ii) disease prevalence; (iii) health care seeking as well as quality and cost of health care; (iv) the amount
of time spent on fuel collection and cooking; (v) the value of productive time based on Gross National
Income per capita; and (vi) variations in environmental and climatic conditions. A 3% discount rate was
applied to all costs and benefits. See Evaluation of the costs and benefits of household energy and health
interventions at global and regional levels for a detailed description of the method and the results of a range
of intervention scenarios by WHO subregion as well as of the sensitivity analysis.
6 270 11 050 14 050 7 500 24 200 11 020 17 740 15 120 7 350 1 410
500 730 - 5 880 - 7 800 - 1 180 610 32 240
3 750 6 440 16 330 6 770 - 9 780 19 870 8 970 4 280 1 570
33
32
Fuel for Life: Household Energy and Health
million stoves rolled out in China!
The Chinese National Improved
Stoves Programme is one of the big household energy
success stories. In the 1980s and 1990s, the Chinese
government implemented the programme in a
decentralized fashion, reducing bureaucratic hurdles and
speeding up financial payments. A commercialization
strategy helped to set up rural energy enterprises;
national-level stove challenges generated healthy
competition. On the one hand, the central production of
critical stove components, such as parts of the
combustion chamber, enforced quality control. On the
other hand, the modification of general designs ensured
that the stove would meet the needs of local users. The
programme thus managed to shift societal norms: most
biomass stoves now on sale in China are improved stoves.
The last decades have witnessed many household energy
initiatives, ranging from ambitious government-run
programmes, such as the Chinese programme, to small-
scale community-led projects. Technologies promoted
include smoke hoods (Box 3), improved stoves (Box 4
and Figure 16), kerosene, LPG (Box 5), biogas (Box 6)
and solar cookers. The Indian national programme
distributed more than 33 million stoves between 1983
and 2000. In Africa, more than 5 million improved
stoves are now in use.
These initiatives have provided important insights into
the ingredients needed to promote household energy
solutions successfully:
Social marketing can overcome the low awareness of
the health risks of indoor air pollution and highlight
the numerous benefits of solutions.
Involving users, in particular women, is crucial. Too
often, cooks fail to adopt, use or maintain equipment
provided in intervention programmes, because it does
not meet their needs.
Local artisans, shops and markets should offer a
choice of interventions. In this way, they can respond
to different demands and abilities to pay.
Micro-credit facilities and targeted subsidies can
overcome financial barriers, in particular among the
poorest of the poor.
Appropriate policies in the energy, health,
environment and other sectors should make sure that
local projects do not operate in a vacuum (Table 6).
These lessons learnt from past programmes should
guide the implementation of programmes in the future.
Rolling out household
energy programmes: learning from the past
"It is often necessary to make decisions on the basis of information
sufficient for action, but insufficient to satisfy the intellect."
Immanuel Kant,
German philosopher (1724–1804)
200
Box 5: How to promote new markets for liquefied
petroleum gas
LPG is often perceived as an exclusively urban fuel. Yet, it is also
an up-and-coming alternative in those rural areas where wood,
charcoal or kerosene are already being purchased. The LPG Rural
Energy Challenge is dedicated to setting up viable markets and
supply chains in developing countries. In so-doing, this initiative,
jointly run by the United Nations Development Programme and the
World LPG Association, can draw on a few key lessons that have
already been learnt:
Micro-credit schemes should emphasize that switching to LPG
may ultimately cut expenditure and add to income generation.
One-time subsidies on gas cookers may be an incentive for people
to consider switching to a cleaner fuel and thus to become lifetime
customers. Similarly, introducing smaller and more affordable gas
bottles could remove barriers to adoption. LPG is very clean and
fuel-efficient, yet there are concerns about the safe handling of
this explosive gas. Awareness-raising among fuel sellers and
consumers and tougher regulations can ensure the correct refilling
and transportation of gas bottles and, most importantly,
contribute to the safe use of LPG. Government leadership in
developing policies for successful market expansion of LPG is
essential.
Adapted from:
McDade S. Fueling development: the role of LPG in poverty reduction and growth.
Energy for Sustainable Development, 2004, 8:74–81.
Box 6: The Nepal biogas programme
Biogas systems convert cattle dung and other animal or
human wastes into methane. This flammable gas is a simple-
to-use fuel for lighting and cooking: it burns cleanly and
efficiently on a conventional low-pressure gas burner.
In Nepal, the Biogas Support Programme has installed more
than 120 000 biogas plants over the last 13 years. About 3%
of Nepalese homes now benefit from much lower levels of
indoor air pollution. Moreover, 72% of the biogas plants are
connected to latrines, leading to improved cleanliness and
reduced health risks in the vicinity of the home. The residual
slurry is a valuable organic fertilizer.
This biogas programme was the first to be recognized under
the Clean Development Mechanism. It trades certified
emission reductions; each operational biogas plant is worth
4.6 tonnes of CO
2
equivalent per year. This success story
points to new synergies between household energy
programmes and efforts to reduce climate change (see
Stripping our forest, heating our planet).
Adapted from:
Netherlands Development Organization and Biogas Sector Partnership-Nepal.
The Nepal Biogas Support Programme: a successful model for rural household
energy supply in developing countries. Executive summary. 2004. More
information is available at: www
.snvworld.org and www.bsipnepal.org.np
Table 6: Policy instruments for effective household energy programmes
Policy instruments Examples
Information, education and communication
◆
Health professionals
◆
Community
◆
Schools
◆
Media
Taxes and subsidies
◆
Tax on fuels and appliances
◆
Subsidy on fuels and appliances
Regulation and legislation
◆
Air quality standards
◆
Design standards for appliances
Direct expenditures
◆
Public programme for provision of appliances
◆
Funding of finance schemes
Research and development
◆
Surveys
◆
Development and evaluation of interventions
◆
Studies of health impacts
◆
Research capacity development
Adapted from:
Bruce N, et al. Indoor air pollution. In: Jamison DT et al., eds. Disease control priorities in developing countries. 2nd ed. New York,
Oxford University Press, 2006.
3534
Fuel for Life: Household Energy and Health
ousehold energy projects and programmes
currently under way around the world have
set out to reach nearly 4 million households with
improved stoves by 2011 (Figure 16). These
initiatives should be accompanied by careful
evaluation and monitoring to answer two
fundamental questions: Can the technical fix
reduce indoor smoke levels, improve health and
bring about other benefits? And, how can a
programme reach a large number of households in
a sustainable way?
To date, few household energy projects or
programmes have undergone rigorous evaluation,
and if they have, the results have been mixed. In
India, improved stoves currently account for less
than 7% of all stoves, many of them in poor working
order due to improper installation and lack of
maintenance. Even in Chinese households
benefiting from an improved stove, levels of
particles and carbon monoxide still exceed the
national standard for indoor air. Consequently,
despite the success of the Chinese programme, a
large proportion of the rural population is still
chronically exposed to high levels of harmful
pollutants. These findings suggest that improved
stoves are an important step towards reducing
indoor smoke levels, but are probably not the
ultimate means to prevent 1.5 million deaths a
year. Moreover, improved stoves tend to shift the
problem outdoors: by venting smoke to the outside
they contribute to ambient air pollution. A large-
scale switch to cleaner fuels, on the other hand,
eliminates nearly 100% of the health risk (Box 7).
Beyond kerosene, LPG and biogas, latest-generation
biofuels may become a healthy and environmentally
friendly cooking alternative in the future (Box 8).
Evaluating the impacts of projects and programmes
will shed light on how to fine-tune different
technical solutions to maximize their health, social
and environmental benefits. Compiling knowledge
from around the world will generate a menu of
solutions from which decision-makers at all levels
can choose. Learning from their experience will
provide a recipe for putting into action successful,
large-scale programmes.
And, there are new opportunities on the horizon.
Frequently, the same families who breathe polluted
air inside their homes also drink contaminated
water and make do without even a simple latrine.
H
New household
energy horizons
Lack of safe drinking-water and adequate sanitation
is responsible for 1.7 million deaths from diarrhoea
every year, mostly of young children. Indoor smoke
is to blame for 1.5 million deaths from respiratory
illness every year. Again, young children bear the
brunt of the burden. Why not join forces to reduce
diarrhoea and respiratory disease in an integrated
manner?
In both cases, interventions at the household level
can prevent disease and death because they are
effective, inexpensive and rapidly deployable.
Generating demand among users and meeting this
demand with a range of solutions is a challenge for
implementers of interventions to improve water
quality and sanitation as well as household energy
use. For both, the private sector plays a major role
in developing appropriate supply chains. And poor
people often need to draw on micro-credit or to
benefit from targeted subsidies to be able to afford
to make a change to their homes. In some locations,
existing programmes to promote household water
treatment could be the entry-point for sensitizing
families about indoor air pollution. In others, a
successful household energy programme could
provide an organizational structure for introducing
improvements to water supplies and sanitation.
Exploiting these synergies to tackle two priority public
health issues at once has an enormous potential to
save lives. And it puts people at the centre.
Figure 16: Taking improved stoves to scale
Thousands of households to be reached by selected improved stove programmes
(cumulative projection), 2005–2011
Number of households to be reached (000)
4000
3000
2000
1000
0
Many improved stove programmes are currently under way around the world. Important implementing
agencies include the German Technical Cooperation (GTZ), the Intermediate Technology Development
Group/Practical Action, Winrock International, Development Alternatives and the Appropriate Rural
Technology Institute. Major agencies funding these programmes include the Dutch Development
Cooperation, the United Kingdom Department for International Development, the United States
government, the German Ministry for Development and the Shell Foundation.
2005 2006 2007 2008 2009 2010 2011
Year
Box 7: Cleaner fuels save lives
On average, 100 million more homes using
liquefied petroleum gas, biogas or modern biofuels
for cooking would lead to:
473 million fewer men, women and children
exposed to harmful indoor air pollution;
282 000 fewer deaths from respiratory diseases
per year.
Box 8: Fuels of the future: biofuels and plant oils
"The use of plant oil as fuel may seem insignificant today.
But such products can in time become just as important
as kerosene and these coal-tar-products of today."
Rudolf Diesel, German inventor of the diesel engine
(1858–1913)
Rising oil prices and a global move towards
renewable energy sources triggered the search for
biofuels, primarily as alternatives to diesel for
running cars. Ethanol, usually obtained from the
residues from sugar production, is the most common
biofuel. Methanol or "wood alcohol", its close relative,
is currently derived from natural gas but can be
produced by gasifying biomass. The last few years
have also witnessed experiments with a range of
domestic plants, such as rape seeds, and wild oil
plants, such as Jatropha curcas.
The development of biofuel stoves is a first step in
pulling this "green gold" away from the automotive
sector into the household sector. Field-testing of
simple as well as more sophisticated technologies is
under way in several developing countries. The first
results are promising: plant oils, ethanol and
methanol burn cleanly and are safe to use. Produced
locally at competitive prices, they may well turn into
the cooking fuels of the future.
aking household energy
solutions to scale will overcome
a major barrier to achieving the
Millennium Development Goals.
Practical solutions to the household energy
problem do exist. Liquefied petroleum gas,
biogas and other cleaner fuels represent the
healthiest alternative. Switching from a
traditional stove to an improved stove
substantially reduces indoor smoke. Improved
household energy practices promote education,
empower women, save the lives of children and
their mothers and benefit our forests and our
climate.
arefully documenting experience
with solutions will serve to
maximize the health and broader
benefits of large-scale programmes.
Many household energy projects and programmes
are currently under way around the world.
Evaluating the impacts of these initiatives will
shed light on how different technical solutions
could be fine-tuned to maximize their health,
social and environmental benefits. Learning from
their experience will provide a recipe for putting
into action successful, large-scale programmes.
very year, indoor air pollution from cooking with
solid fuels is responsible for 1.5 million deaths.
Indoor air pollution has dramatic consequences for health. Cooking
with wood, dung, coal and other solid fuels is a major risk factor for
pneumonia among children and chronic respiratory disease among
adults, with more than two thirds of these deaths occurring in South-
East Asia and sub-Saharan Africa. Every year, the killer in the kitchen
is responsible for 1.5 million deaths. Curbing indoor air pollution will
put an end to this needless loss of life.
rogress since 1990 has been negligible.
To halve, by 2015, the population cooking
with solid fuels, 485 000 people need to gain
access to cleaner fuels every day.
Progress in access to modern cooking fuels since 1990 has been
negligible, as the small gains made are lagging behind population
growth. To halve, by 2015, the number of people without access to
such fuels, 485 000 people will need to gain access to modern
energy services every day for the next 10 years. Innovative policy
approaches and a rigorous acceleration of investments is needed now
to save lives and enable development.
ealth and productivity gains can more than pay
for lifting people out of energy poverty.
Investing US$ 13 billion per year to halve, by 2015, the number of
people worldwide cooking with solid fuels by providing them with
access to liquefied petroleum gas shows a payback of US$ 91 billion
per year. Making improved stoves available to half of those still
burning biomass fuels and coal on traditional stoves would result in
a negative intervention cost of US$ 34 billion a year and generate an
economic return of US$ 105 billion a year over a 10-year-period.
Health and productivity gains make household energy solutions
potentially good value for money.
key points
E
P
H
T
C
36 37
3938
Fuel for Life: Household Energy and Health
Annex
Country Total population Percentage of Percentage of Under-five Maternal mortality Carbon dioxide
(thousands) population living population using mortality rate rate per 100 000 emissions per
below $1 (PPP) solid fuels per 1000 live live births capita (metric tons)
per day births
Year 2003 2003 or latest 2003 or latest 2003 or latest 2000 2002
available data available data available data
Afghanistan 23 897 no data >95 257 1 900 0
Albania 3 166 2 50 21 55 0.8
Algeria 31 800 2 <5 41 140 2.9
Andorra 71 no data <5 7 no data no data
Angola 13 625 no data >95 260 1 700 0.5
Antigua and Barbuda 73 no data 46 12 no data 4.7
Argentina 38 428 3 <5 20 82 3.5
Armenia 3 061 13 26 33 55 1.0
Australia 19 731 no data <5 6 8 18.3
Austria 8 116 no data <5 5 4 7.8
Azerbaijan 8 370 4 49 91 94 3.4
Bahamas 314 no data <5 14 60 6.7
Bahrain 724 no data <5 15 28 30.6
Bangladesh 146 736 36 88 69 380 0.3
Barbados 270 no data <5 13 95 4.6
Belarus 9 895 0 19 17 35 6.0
Belgium 10 318 no data <5 5 10 6.8
Belize 256 no data 43 39 140 3.1
Benin 6 736 no data 95 154 850 0.3
Bhutan 2 257 no data no data 85 420 0.2
Bolivia 8 808 14 25 66 420 1.2
Bosnia and Herzegovina 4 161 no data 51 17 31 4.8
Botswana 1 785 31 65 112 100 2.3
Brazil 178 470 8 12 35 260 1.8
Brunei Darussalam 358 no data no data 6 37 17.7
Bulgaria 7 897 5 17 15 32 5.3
Burkina Faso 13 002 45 >95 207 1 000 0.1
Burundi 6 825 55 >95 190 1 000 0.0
Cambodia 14 144 34 >95 140 450 0.0
Cameroon 16 018 17 83 166 730 0.2
Canada 31 510 no data <5 6 6 16.5
Cape Verde 463 no data 36 35 150 0.3
Central African Republic 3 865 67 >95 180 1 100 0.1
Chad 8 598 no data >95 200 1 100 0.0
Chile 15 806 2 <5 9 31 3.6
China 1 311 709 17 80 37 56 2.7
Colombia 44 222 8 15 21 130 1.3
Comoros 768 no data 76 73 480 0.1
Congo 3 724 no data 84 108 510 0.6
Cook Islands 18 no data no data 21 no data 1.5
Costa Rica 4 173 2 23 10 43 1.4
Côte d'Ivoire 16 631 11 74 192 690 0.4
Croatia 4 428 2 12 7 8 4.7
Cuba 11 300 no data 21 8 33 2.1
Cyprus 802 no data <5 5 47 8.3
Czech Republic 10 236 2 <5 4 9 11.2
Democratic People's Republic of Korea
22 664 no data no data 55 67 6.5
Democratic Republic of the Congo 52 771 no data >95 205 990 0.0
Denmark 5 364 no data <5 4 5 8.9
Djibouti 703 no data 6 138 730 0.5
Further reading
Household energy and the Millennium Development Goals
Rehfuess E, Mehta S, Prüss-Üstün A. Assessing
household solid fuel use – multiple implications for
the millennium development goals. Environmental
Health Perspectives, 2006, 114(3):373–378.
United Nations. United Nations Millennium
Declaration. New York, United Nations, 2000.
United Nations. The Millennium Development
Goals Report. New York, United Nations, 2005.
United Nations Statistics Division. Millennium
Development Goal Indicators Database. Available at:
/>United Nations Millennium Project. Investing in
development. A practical plan to achieve the Millennium
Development Goals. London, Sterling, VA, Earthscan and
United Nations Millennium Project, 2005.
Economic analysis of household energy interventions
Mehta S, Shahpar C. The health benefits of
interventions to reduce indoor air pollution from
solid fuel use: a cost-effectiveness analysis. Energy
for Sustainable Development, 2004, 8:53–59.
Hutton G, Rehfuess E. Guidelines for conducting
cost-benefit analysis of household energy and
health interventions to improve health. Geneva,
World Health Organization, in press.
Hutton G, Rehfuess E, Tediosi F, Weiss S. Evaluation
of the costs and benefits of household energy and
health interventions at global and regional levels.
Geneva, World Health Organization, in press.
Household energy and climate change
Bond T, Venkataraman C, Masera O. Global
atmospheric impacts of residential fuels. Energy for
Sustainable Development, 2004, 8:54–66.
Millennium Ecosystem Assessment. Ecosystems
and human well-being: synthesis. Washington, DC,
Island Press, 2005.
Smith KR, et al. Greenhouse implications of household
stoves: an analysis for India. Annual Review of Energy
and the Environment, 2000, 25:741–763.
Household energy, indoor air pollution and poverty
Bruce N, et al. Indoor air pollution. In: Jamison DT et al.,
eds. Disease control priorities in developing countries.
2nd ed. New York, Oxford University Press, 2006.
International Energy Agency, OECD. World energy outlook
2004. Paris, International Energy Agency and OECD, 2004.
United Nations Development Programme. World
energy assessment: energy and the challenge of
sustainability. New York, United Nations
Development Programme, 2000.
World Health Organization. Addressing the links
between indoor air pollution, household energy and
human health. Based on the WHO-USAID
Consultation on the Health Impact of Household
Energy in Developing Countries (Meeting Report).
Geneva, World Health Organization, 2002.
World Health Organization. Addressing the impact
of household energy and indoor air pollution on the
health of the poor: implications for policy action
and intervention measures. Paper prepared for the
Commission on Macroeconomics and Health.
Geneva, World Health Organization, 2002.
Health impacts of indoor air pollution
Bruce NG, Perez-Padilla R, Albalak R. Indoor air
pollution in developing countries: a major
environmental and public health challenge. Bulletin of
the World Health Organization 2000, 78:1078–1092.
Smith KR, Mehta S, Feuz M. Indoor air pollution from
household use of solid fuels. In: Ezzati M et al., eds.
Comparative quantification of health risks: global and
regional burden of disease attributable to selected major
risk factors. Geneva, World Health Organization, 2004.
World Health Organization. World Health Report
2002: Reducing risks, promoting healthy life.
Geneva, World Health Organization, 2002.
Gordon B, Mackay R, Rehfuess E. Inheriting the world:
the atlas of children's health and the environment.
Geneva, World Health Organization, 2004.
World Health Organization. WHO air quality guidelines:
global update 2005. Working Group Meeting, Bonn,
Germany, 18–20 October 2005. In press.
4140
Fuel for Life: Household Energy and Health
Country Total population Percentage of Percentage of Under-five Maternal mortality Carbon dioxide
(thousands) population living population using mortality rate rate per 100 000 emissions per
below $1 (PPP) solid fuels per 1000 live live births capita (metric tons)
per day births
Year 2003 2003 or latest 2003 or latest 2003 or latest 2000 2002
available data available data available data
Annex
Madagascar 17 404 61 >95 126 550 0.1
Malawi 12 105 42 >95 178 1 800 0.1
Malaysia 24 425 2 <5 7 41 6.3
Maldives 318 no data no data 72 110 3.4
Mali 13 007 72 >95 220 1 200 0.0
Malta 394 no data <5 6 21 7.5
Marshall Islands 53 no data no data 61 no data no data
Mauritania 2 893 26 65 107 1 000 1.1
Mauritius 1 221 no data <5 18 24 2.6
Mexico 103 457 10 12 28 83 3.7
Micronesia, Federal States of 109 no data no data 23 no data no data
Monaco 34 no data <5 4 no data 6.2
Mongolia 2 594 27 51 68 110 3.3
Morocco 30 566 2 5 39 220 1.4
Mozambique 18 863 38 80 147 1 000 0.1
Myanmar 49 485 no data 95 107 360 0.2
Namibia 1 987 35 63 65 300 1.1
Nauru 13 no data no data 30 no data 10.8
Nepal 25 164 39 80 82 740 0.2
Netherlands 16 149 no data <5 5 16 9.4
New Zealand 3 875 no data <5 6 7 8.7
Nicaragua 5 466 45 58 38 230 0.7
Niger 11 972 61 >95 262 1 600 0.1
Nigeria 124 009 70 67 198 800 0.4
Niue 2 no data no data no data no data 2.0
Norway 4 533 no data <5 4 16 12.2
Oman 2 851 no data <5 12 87 12.1
Pakistan 153 578 13 72 98 500 0.7
Palau 20 no data no data 28 no data 11.9
Panama 3 120 7 33 24 160 2.0
Papua New Guinea 5 711 no data 90 93 300 0.4
Paraguay 5 878 16 58 29 170 0.7
Peru 27 167 18 33 34 410 1.0
Philippines 79 999 15 47 36 200 0.9
Poland 38 587 2 <5 7 13 7.7
Portugal 10 061 2 <5 5 5 6.0
Qatar 610 no data <5 15 7 53.1
Republic of Korea 47 700 2 <5 5 20 9.4
Republic of Moldova 4 267 22 63 32 36 1.6
Romania 22 334 2 23 20 49 4.0
Russian Federation 143 246 2 7 21 67 9.9
Rwanda 8 387 52 >95 203 1 400 0.1
Saint Kitts and Nevis 42 no data <5 22 no data 2.8
Saint Lucia 149 25 63 18 no data 2.4
Saint Vincent and the Grenadines 120 no data 31 27 no data 1.6
Samoa 178 no data 70 24 130 0.8
San Marino 28 no data <5 5 no data 7.5
Sao Tome and Principe 161 no data 95 118 no data 0.6
Saudi Arabia 24 217 no data <5 26 23 15.0
Senegal 10 095 22 41 137 690 0.4
Country Total population Percentage of Percentage of Under-five Maternal mortality Carbon dioxide
(thousands) population living population using mortality rate rate per 100 000 emissions per
below $1 (PPP) solid fuels per 1000 live live births capita (metric tons)
per day births
Year 2003 2003 or latest 2003 or latest 2003 or latest 2000 2002
available data available data available data
Dominica 79 no data 21 14 no data 1.5
Dominican Republic 8 745 2 14 35 150 2.5
Ecuador 13 003 18 <5 27 130 2.0
Egypt 71 931 3 <5 39 84 2.1
El Salvador 6 515 31 33 36 150 1.0
Equatorial Guinea 494 no data no data 146 880 0.4
Eritrea 4 141 no data 80 85 630 0.2
Estonia 1 323 2 15 9 63 11.8
Ethiopia 70 678 23 >95 169 850 0.1
Fiji 839 no data 40 20 75 1.6
Finland 5 207 no data <5 5 6 12.0
France 60 144 no data <5 5 17 6.2
Gabon 1 329 no data 28 91 420 2.6
Gambia 1 426 54 >95 123 540 0.2
Georgia 5 126 3 42 45 32 0.7
Germany 82 476 no data <5 5 8 9.8
Ghana 20 922 45 88 95 540 0.4
Greece 10 976 no data <5 5 9 8.5
Grenada 80 no data 48 23 no data 2.3
Guatemala 12 347 16 62 47 240 0.9
Guinea 8 480 no data >95 160 740 0.1
Guinea-Bissau 1 493 no data 95 204 1 100 0.2
Guyana 765 3 59 69 170 2.2
Haiti 8 326 no data >95 118 680 0.2
Honduras 6 941 21 57 41 110 0.9
Hungary 9 877 2 <5 8 16 5.6
Iceland 290 no data <5 4 0 7.7
India 1 065 462 35 74 87 540 1.2
Indonesia 219 883 8 72 41 230 1.4
Iran, Islamic Republic of 68 920 2 <5 39 76 5.3
Iraq 25 175 no data <5 125 250 3.0
Ireland 3 956 no data <5 6 5 11.0
Israel 6 433 no data <5 6 17 11.0
Italy 57 423 no data <5 4 5 7.5
Jamaica 2 651 2 45 20 87 4.1
Japan 127 654 no data <5 4 10 9.4
Jordan 5 473 2 <5 28 41 3.2
Kazakhstan 15 433 2 5 73 210 9.9
Kenya 31 987 23 81 123 1 000 0.2
Kiribati 88 no data no data 66 no data 0.3
Kuwait 2 521 no data <5 9 5 24.6
Kyrgyzstan 5 138 2 76 68 110 1.0
Lao People's Democratic Republic 5 657 26 >95 91 650 0.2
Latvia 2 307 2 10 12 42 2.7
Lebanon 3 653 no data <5 31 150 4.7
Lesotho 1 802 36 83 110 550 no data
Liberia 3 367 no data no data 235 760 0.1
Libyan Arab Jamahiriya 5 551 no data <5 16 97 9.1
Lithuania 3 444 2 <5 11 13 3.6
Luxembourg 453 no data <5 5 28 21.1
42
Fuel for Life: Household Energy and Health
Annex
Country Total population Percentage of Percentage of Under-five Maternal mortality Carbon dioxide
(thousands) population living population using mortality rate rate per 100 000 emissions per
below $1 (PPP) solid fuels per 1000 live live births capita (metric tons)
per day births
Year 2003 2003 or latest 2003 or latest 2003 or latest 2000 2002
available data available data available data
Serbia and Montenegro 10 527 no data no data 14 11 4.4
Seychelles 81 no data <5 15 no data 6.8
Sierra Leone 4 971 no data 92 284 2 000 0.1
Singapore 4 253 no data <5 3 30 13.8
Slovakia 5 402 2 <5 8 3 6.8
Slovenia 1 984 2 8 4 17 7.8
Solomon Islands 477 no data 95 22 130 0.4
Somalia 9 890 no data no data 225 1 100 no data
South Africa 45 026 11 18 66 230 7.4
Spain 41 060 no data <5 4 4 7.3
Sri Lanka 19 065 8 67 15 92 0.5
Sudan 33 610 no data >95 93 590 0.3
Suriname 436 no data no data 39 110 5.1
Swaziland 1 077 8 68 153 370 0.9
Sweden 8 876 no data <5 3 2 5.8
Switzerland 7 169 no data <5 5 7 5.7
Syrian Arab Republic 17 800 no data 32 18 160 2.8
Tajikistan 6 245 7 75 95 100 0.7
Thailand 62 833 2 72 26 44 3.7
The former Yugoslav Republic of Macedonia
2 056 2 30 11 23 5.1
Timor-Leste 778 no data no data 124 660 no data
Togo 4 909 no data 76 140 570 0.3
Tonga 104 no data 56 19 no data 1.1
Trinidad and Tobago 1 303 4 8 20 160 31.9
Tunisia 9 832 2 5 24 120 2.3
Turkey 71 325 2 11 39 70 3.0
Turkmenistan 4 867 10 <5 102 31 9.1
Tuvalu 11 no data no data 51 no data no data
Uganda 25 827 85 >95 140 880 0.1
Ukraine 48 523 2 6 20 35 6.4
United Arab Emirates 2 995 no data <5 8 54 25.1
United Kingdom 59 251 no data <5 6 13 9.2
United Republic of Tanzania 36 977 49 >95 165 1 500 0.1
United States of America 294 043 no data <5 8 17 20.1
Uruguay 3 415 2 <5 14 27 1.2
Uzbekistan 26 093 14 72 69 24 4.8
Vanuatu 212 no data 79 38 130 0.4
Venezuela, Bolivarian Republic of 25 699 14 5 21 96 4.3
Viet Nam 81 377 2 70 23 130 0.8
Yemen 20 010 16 42 113 570 0.7
Zambia 10 812 64 85 182 750 0.2
Zimbabwe 12 891 56 73 126 1 100 1.0
For further information on data sources and data limitations see:
United Nations Statistics Division. Millennium Development Goal Indicators Database. Available at: />