2012 Search Marketing - SEO Edition - Research and Insights on Creating and Capitalizing on a Rich End-User Search Experience potx
Bạn đang xem bản rút gọn của tài liệu. Xem và tải ngay bản đầy đủ của tài liệu tại đây (1.7 MB, 18 trang )
BENCHMARK
REPORT
2012 Search Markeng - SEO Edion
Research and Insights on
Creang and Capitalizing on a
Rich End-User Search Experience
sponsored by
BENCHMARK
REPORT
MarketingSherpa 2012 Search Marketing Benchmark Report – SEO Edition
i
© Copyright 2000–2011 MarketingSherpa LLC, a MECLABS Group Company.
It is forbidden to copy this report in any manner. For permissions, contact
2012 Search Marketing – SEO Edition
Benchmark Report
Research and Insights on Creating and Capitalizing on a Rich End -User Search
Experience
Author
Kaci Bower, Research Analyst
Contributors
Sergio Balegno, Research Director
Jen Doyle, Senior Research Manager
Jeff Rice, Research Analyst
Adam Sutton, Reporter
Amie Bolton, Research Analyst
Production Editor
Brad Bortone, Editor
2012 Search Marketing Benchmark Report –
SEO Edition
Copyright © 2011 by MarketingSherpa LLC
All rights reserved. No part of this report may be reproduced or transmitted in any form or by any
means, electronic or mechanical, including photocopying, recording, faxing, emailing, posting
online or by any information storage and retrieval system, without written permission from the
Publisher.
To purchase additional copies of this report, please visit
Bulk discounts are available for multiple copies. Contact:
Customer Service
MarketingSherpa LLC
+1 (877) 895-1717 (outside US, call +401-247-7655)
Service@SherpaStore.
MarketingSherpa 2012 Search Marketing Benchmark Report – SEO Edition
ii
© Copyright 2000–2011 MarketingSherpa LLC, a MECLABS Group Company.
It is forbidden to copy this report in any manner. For permissions, contact
TABLE OF CONTENTS
Table of Contents ii
Executive Summary 1
New Research and Insights on Creating and Capitalizing on a Rich End-User Search Experience 1
Key finding: Developing a strategy is a top challenge…but bottom objective 2
Chart: Comparing most frustrating SEO challenges with most important SEO objectives 2
Key finding: Content creation works the best, but takes the most work 3
Chart: Three dimensional view of SEO tactics 3
Key finding: Incremental SEO improvements add up to large gains 4
Chart: Organic traffic lead quality and conversion rates, by SEO maturity phase 4
Key finding: Future investments in SEO backed by having SEO process in place 5
Chart: Expected 12-month SEO budget change, by SEO maturity phase 5
Key finding: Local business listing tactics are underutilized 6
Chart: Local business listing tactics used for local search purposes 6
Chapter 1: SEO Objectives and Challenges 7
Informal processes still define SEO marketing maturity 7
Chart: Organizations with a process for planning, executing and measuring SEO programs 7
Chart: Organizations in each phase of SEO marketing maturity, by primary channel 8
Chart: Organizations in each phase of SEO marketing maturity, by industry 9
Challenges hampering SEO effectiveness over last 12 months 10
Chart: Web traffic and lead generation are top challenges for SEO 10
Chart: Most frustrating SEO challenges, by primary channel 11
Chart: Most frustrating SEO challenges, by organization size 12
Chart: Most frustrating SEO challenges, by SEO maturity phase 13
Chart: Most frustrating SEO challenges, by industry 14
Objectives for SEO programs in next 12 months 15
Chart: Increasing web traffic and lead generation top the list for SEO objectives 15
Chart: Most important SEO objectives, by primary channel 16
Chart: Most important SEO objectives, by organization size 17
Chart: Most important SEO objectives, by SEO maturity phase 18
Chart: Most important SEO objectives, by industry 19
Marketer insights on developing SEO marketing strategies 20
Chapter 2: SEO Tactics 23
Majority of organizations run SEO campaigns in-house 23
Chart: Popularity of in-house versus outsourced SEO campaign management 23
Chart: SEO campaign management, by primary channel 24
Chart: SEO campaign management, by organization size 25
Chart: SEO campaign management, by SEO maturity phase 26
Chart: SEO campaign management, by SEO maturity phase 27
MarketingSherpa 2012 Search Marketing Benchmark Report – SEO Edition
iii
© Copyright 2000–2011 MarketingSherpa LLC, a MECLABS Group Company.
It is forbidden to copy this report in any manner. For permissions, contact
Keyword-focused tactics are the most popular 28
Chart: SEO tactics used by organizations cover many angles 28
Chart: SEO tactics, by primary channel 29
Chart: SEO tactics, by organization size 30
Chart: SEO tactics, by SEO maturity phase 31
Chart: SEO tactics, by industry 32
Good content is great link bait…but difficult to create 33
Chart: SEO tactics vary widely in their degree of difficulty to execute 33
Chart: SEO tactics deemed very or somewhat difficult, by primary channel 34
Chart: SEO tactics deemed very or somewhat difficult, by organization size 35
Chart: SEO tactics deemed very or somewhat difficult, by SEO maturity phase 36
Chart: SEO tactics deemed very or somewhat difficult, by industry 37
Content creation may be difficult, but it is effective 38
Chart: Content creation and keyword research considered most effective SEO tactics 38
Chart: SEO tactics deemed very effective, by primary channel 39
Chart: SEO tactics deemed very effective, by organization size 40
Chart: SEO tactics deemed very effective, by SEO maturity phase 41
Chart: SEO tactics deemed very effective, by industry 42
Marketer insights on success with SEO tactics 43
Chapter 3: Monitoring and Tracking Metrics 47
Web conversion often defined as multiple-field form completion 47
Chart: How organizations define a website conversion 47
Chart: Definition of website conversion, by primary channel 48
Chart: Definition of website conversion, by organization size 49
Chart: Definition of website conversion, by SEO maturity phase 50
Chart: Definition of website conversion, by industry 51
Median conversion rate on organic traffic is 4% 52
Chart: Organizations experience wide variability in conversion rates on organic traffic 52
Page 1 of SERPs not out of reach for most marketers 53
Chart: Targeted key terms yield good rankings for many 53
Chart: Organic ranking for targeted key terms, by primary channel 54
Chart: Organic ranking for targeted key terms, by organization size 55
Chart: Organic ranking for targeted key terms, by SEO maturity phase 56
Chart: Organic ranking for targeted key terms, by industry 57
Organic search plays minor role in total lead volume 58
Chart: Percent of total lead volume from organic search 58
Chart: Percent of total lead volume from organic search, by primary channel 59
Chart: Percent of total lead volume from organic search, by organization size 60
Chart: Percent of total lead volume from organic search, by SEO maturity phase 61
Chart: Percent of total lead volume from organic search, by industry 62
Organic search yields mixed results for lead quality, with some standouts 63
Chart: Quality of leads from organic search 63
MarketingSherpa 2012 Search Marketing Benchmark Report – SEO Edition
iv
© Copyright 2000–2011 MarketingSherpa LLC, a MECLABS Group Company.
It is forbidden to copy this report in any manner. For permissions, contact
Chart: Quality of leads from organic search, by primary channel 64
Chart: Quality of leads from organic search, by organization size 65
Chart: Quality of leads from organic search, by SEO maturity phase 66
Chart: Quality of leads from organic search, by industry 67
Free analytics solutions are the most widely used 68
Chart: Analytics and monitoring solutions for tracking SEO metrics 68
Chart: SEO analytics and monitoring solutions, by primary channel 69
Chart: SEO analytics and monitoring solutions, by organization size 70
Chart: SEO analytics and monitoring solutions, by SEO maturity phase 71
Marketer insights on using analytics to optimize SEO performance 72
Chapter 4: Planning and Tracking Budgets 75
Biggest budget increases expected in inbound marketing 75
Chart: Expected marketing budget changes over 12 months 75
Chart: Expected marketing budget increases over 12 months, by primary channel 76
Chart: Expected marketing budget increases over 12 months, by organization size 77
Chart: Expected marketing budget increases over 12 months, by SEO maturity phase 78
Chart: Expected marketing budget increases over 12 months, by industry 79
Half of marketing budgets go to online marketing, on average 80
Chart: Percentage of total marketing budget allocated to online marketing varies widely 80
PPC, SEO and Website take big share of online marketing budget 81
Chart: Allocation of online marketing dollars 81
Chart: Allocation of online marketing dollars, by primary channel 82
Chart: Allocation of online marketing dollars, by organization size 83
Chart: Allocation of online marketing dollars, by SEO maturity phase 84
Chart: Allocation of online marketing dollars, by industry 85
Staff salaries comprise the largest portion of total SEO budgets 86
Chart: Total SEO budget allocation 86
Chart: Total SEO budget allocation, by primary channel 87
Chart: Total SEO budget allocation, by organization size 88
Chart: Total SEO budget allocation, by SEO maturity phase 89
Chart: Total SEO budget allocation, by organization size 90
Budgets earmarked for SEO programs 91
Chart: SEO program budgets, by organization size 91
Chart: SEO program budgets, by SEO maturity phase 92
SEO budgets expected to stay the same or grow 93
Chart: Expected 12-month SEO budget change 93
Chart: Expected 12-month SEO budget change, by primary channel 94
Chart: Expected 12-month SEO budget change, by organization size 95
Chart: Expected 12-month SEO budget change, by SEO maturity phase 96
Chart: Expected 12-month SEO budget change, by industry 97
Marketer insights on the value returned from SEO budget invested 98
Chapter 5: Integrating Social Media and SEO 101
MarketingSherpa 2012 Search Marketing Benchmark Report – SEO Edition
v
© Copyright 2000–2011 MarketingSherpa LLC, a MECLABS Group Company.
It is forbidden to copy this report in any manner. For permissions, contact
Rankings and links are top goals for social integration 101
Chart: Top goals for integrating social media with SEO 101
Chart: Goals for integrating social media with SEO, by primary channel 102
Chart: Goals for integrating social media with SEO, by organization size 103
Chart: Goals for integrating social media with SEO, by primary channel 104
Chart: Goals for integrating social media with SEO, by industry 105
Blogs considered most effective social media platform 106
Chart: Level of effectiveness by social media platform 106
Chart: Social media platforms deemed very or somewhat effective, by primary channel 107
Chart: Social media platforms deemed very or somewhat effective, organization size 108
Chart: Social media platforms deemed very or somewhat effective, by SEO maturity phase 109
Chart: Social media platforms deemed very or somewhat effective, by industry 110
Inbound marketing lead sources are growing in importance 111
Chart: Lead sources increasing and decreasing in importance over last 12 months 111
Chart: Lead sources growing in importance over last 12 months, by primary channel 112
Chart: Lead sources growing in importance over last 12 months, by organization size 113
Chart: Lead sources growing in importance over last 12 months, by SEO maturity phase 114
Chart: Lead sources growing in importance over last 12 months, by industry 115
Inbound leads cost 66% less than outbound leads, on average 116
Chart: Cost of inbound versus outbound lead 116
Table: Cost of inbound leads, by segment 117
Table: Cost of outbound leads, by segment 117
Marketer insights on achieving results from social media and SEO integration 118
Chapter 6: The Importance of Content in a Search Marketing Strategy 119
Web pages and social media are the most used content products 119
Chart: Mix of content products used as part of total search marketing strategy 119
Chart: Content marketing products, by primary channel 120
Chart: Content marketing products, by organization size 121
Chart: Content marketing products, by SEO maturity phase 122
Chart: Top 12 content marketing products, by industry 123
Many content products require high level of time, effort, expense 124
Chart: Degree of difficulty required in creating content products 124
Chart: Content products deemed very or somewhat difficult to create, by primary channel 125
Content products deemed very or somewhat difficult to create, by organization size 126
Content products deemed very or somewhat difficult to create, by SEO maturity phase 127
Customer reviews considered the most effective content product 128
Chart: Level of effectiveness in achieving marketing objectives, by content product 128
Chart: Level of effectiveness in achieving marketing objectives, by primary channel 129
Chart: Level of effectiveness in achieving marketing objectives, by organization size 130
Chart: Level of effectiveness in achieving marketing objectives, by SEO maturity phase 131
Chapter 7: Capitalizing on Local Search 133
Local search viewed as having positive impact on objectives 133
MarketingSherpa 2012 Search Marketing Benchmark Report – SEO Edition
vi
© Copyright 2000–2011 MarketingSherpa LLC, a MECLABS Group Company.
It is forbidden to copy this report in any manner. For permissions, contact
Chart: Impact of search products on marketing objectives 133
Chart: Search products deemed to have a positive impact, by primary channel 134
Chart: Search products deemed to have a positive impact, by organization size 135
Chart: Search products deemed to have a positive impact, by SEO maturity phase 136
Chart: Search products deemed to have a positive impact, by industry 137
Many still have no local business listing on search engines 138
Chart: Organizations claiming local business listing on search engines 138
Chart: Organizations claiming local business listing, by primary channel 139
Chart: Organizations claiming local business listing, by organization size 140
Chart: Organizations claiming local business listing, by SEO maturity phase 141
Chart: Organizations claiming local business listing, by industry 142
Many local business listing tactics are not being put into play 143
Chart: Local business listing tactics used for local search purposes 143
Chart: Local business listing tactics used for local search, by primary channel 144
Chart: Local business listing tactics used for local search, by organization size 145
Chart: Local business listing tactics used for local search, by SEO maturity phase 146
Chart: Local business listing tactics used for local search, by SEO industry 147
Optimizing for local terms is not commonly practiced by most 148
Chart: Percent of organizations optimizing for local terms as part of organic search strategy 148
Chart: Percent of organizations optimizing for local terms, by primary channel 149
Chart: Percent of organizations optimizing for local terms, by organization size 150
Chart: Percent of organizations optimizing for local terms, by SEO maturity phase 151
Chart: Percent of organizations optimizing for local terms, by industry 152
Developing local content is top local optimization tactic 153
Chart: Top local search optimization tactics 153
Chart: Local search optimization tactics, by primary channel 154
Chart: Local search optimization tactics, by organization size 155
Chart: Local search optimization tactics, by SEO maturity phase 156
Chart: Local search optimization tactics, by industry 157
Marketer insights on the challenges of optimizing for local search 158
Marketer insights on successfully optimizing for local search 161
Chapter 8: Making Sense of Mobile Search 163
Mobile search is considered the least critical 163
Chart: Degree of importance search products play in achieving search marketing objectives 163
Chart: Search products deemed critical or important for achieving search marketing objectives, by
primary channel 164
Chart: Search products deemed critical or important for achieving search marketing objectives, by
organization size 165
Chart: Search products deemed critical or important for achieving search marketing objectives, by
SEO maturity phase 166
Chart: Search products deemed critical or important for achieving search marketing objectives, by
industry 167
Ad campaigns enabled more often than actually optimized for mobile 168
MarketingSherpa 2012 Search Marketing Benchmark Report – SEO Edition
vii
© Copyright 2000–2011 MarketingSherpa LLC, a MECLABS Group Company.
It is forbidden to copy this report in any manner. For permissions, contact
Chart: Mobile search tactics are not widely exercised 168
Chart: Mobile search tactic usage, by primary channel 169
Chart: Mobile search tactic usage, by organization size 170
Chart: Mobile search tactic usage, by SEO maturity phase 171
Chart: Mobile search tactic usage, by industry 172
Marketer insights on their challenges with mobile search 173
Marketer insights on their successes with mobile search 175
Chapter 9: Search Marketing Success Stories 177
Case Briefing: Optimizing early to capture future seasonal traffic lifts 177
Case Briefing: Finding and testing niche content increases organic traffic 40% 178
Case Briefing: Content marketing campaign generates surge in traffic 179
Case Briefing: Turning a YouTube channel into a powerful inbound marketing hub 180
Case Briefing: Revamped and optimized web content doubles lead conversions 181
Case Briefing: Using social media boosts leads 30% and revenue 114% 182
Chapter 10: Agency Perspectives 183
Client investment in SEO is driven by measurable ROI 183
Chart: Client perception of SEO's ability to produce ROI 183
Agencies expect 72% of clients to increase SEO budgets up to 50% 184
Chart: Expected changes in clients' SEO spending 184
Majority of client organizations get Page 1 organic rankings 185
Chart: Typical client organization's organic ranking on targeted key terms 185
Agencies and clients agree on Top 3 most effective SEO tactics 186
Chart: Level of effectiveness of SEO tactics, rated by agencies 186
Agency insights on their successes with SEO campaigns 187
Agency insights on most effective tactics for improving rankings 190
Search and Display networks voted most effective by agencies 193
Chart: Level of effectiveness by advertising network, rated by agencies 193
Despite variety of ad formats, text ads still reign supreme 194
Chart: Level of effectiveness per ad format, rated by agencies 194
Social media part of search marketing mix for over 50% of clients 195
Chart: Extent of social media integration by clients 195
Clients expected to increase usage of Facebook, YouTube, Twitter 196
Chart: Expected usage levels of social media platforms by clients 196
Appendix 197
Benchmark survey demographics 197
Chart: In which geographic region is your organization based? 197
Chart: Which best describes the type of organization you work for? 198
Chart: Which best describes your organization's primary sales channel? 199
Chart: Please select the approximate number of employees in your organization. 200
Chart: Which best describes your role and decision-making authority in the organization? 201
Search Engine marketing glossary 202
MarketingSherpa 2012 Search Marketing Benchmark Report – SEO Edition
viii
© Copyright 2000–2011 MarketingSherpa LLC, a MECLABS Group Company.
It is forbidden to copy this report in any manner. For permissions, contact
An A-to-Z glossary of common search marketing terms 202
MarketingSherpa 2012 Search Marketing Benchmark Report – SEO Edition
1
© Copyright 2000–2011 MarketingSherpa LLC, a MECLABS Group Company.
It is forbidden to copy this report in any manner. For permissions, contact
EXECUTIVE SUMMARY
NEW RESEARCH AND INSIGHTS ON CREATING AND CAPITALIZING ON A RICH END-USER
SEARCH EXPERIENCE
A rich end-user experience has become the hallmark of search marketing. Searchers now receive instant,
real-time, personalized and local information. Blended search supports these developments by generating
results pages that include not only blue links, but also video, images, news, press releases, customer
reviews and real-time social media content.
This colorful backdrop of search activity is the setting for MarketingSherpa’s eighth annual benchmark
report of search engine marketing. Last year’s study looked at managing the evolving search and social
climate to achieve optimal results; this year’s report builds on that by examining the fast-paced and
growing shift to inbound marketing efforts. The role of content, including optimized local content, also
comes under study. Marketers rated content creation as the most difficult (yet most effective) SEO tactic.
This comes as no surprise, since content marketing sits at the intersection of search and social. To achieve
good organic rankings and ensure that their products and services are found across all formats and venues,
organizations must be strategic with their planning and processes,
and ever-savvy with the creation and optimization of all digital
assets. Simply put, good content makes for a better end-user
experience.
Organized for fast and easy reference
The 2012 Search Marketing Benchmark Report – SEO Edition is a
comprehensive reference guide containing more than 150 charts
with analytical commentary, hundreds of informative insights from
your peers, several abridged case studies of real-life search and
inbound marketing campaigns and more. To help you quickly locate
the information most relevant to your marketing situation, we have
segmented data throughout this report by:
Average of all respondents
Primary marketing channels
Organization size
Phases of search marketing maturity
Key industry sectors
Highlights of this year’s study
The alignment of search marketing objectives against the most difficult SEO challenges
The usage, effectiveness and level of effort required for SEO tactics and content products
How organizations are allocating marketing dollars and where they are shifting their efforts
What marketers are doing to fare well in local and mobile search results
How agencies view their clients’ SEO and inbound marketing efforts
Benchmark Report
MarketingSherpa Benchmark
Reports provide marketing
executives and practitioners the
comprehensive research data
and insights needed to compare
an organization’s practices and
performance against industry
benchmarks in order to guide
strategic decisions and tactical
planning.
MarketingSherpa 2012 Search Marketing Benchmark Report – SEO Edition
2
© Copyright 2000–2011 MarketingSherpa LLC, a MECLABS Group Company.
It is forbidden to copy this report in any manner. For permissions, contact
KEY FINDING: DEVELOPING A STRATEGY IS A TOP CHALLENGE…BUT BOTTOM OBJECTIVE
In planning for the upcoming year, marketers’ SEO program objectives frequently addressed the previous
year’s challenges head-on. Bringing in more website traffic and increasing the volume and quantity of leads
generated were cited as last year’s top challenges. These now are top objectives for the coming year.
Developing a strategy should be a top objective, especially in light of the fact that developing an effective
strategy had been a top challenge for the previous 12 months. A strategy would also serve to guide
prioritization decisions for other objectives. Nevertheless, many organizations sidestepped this and zeroed
in on clear revenue drivers such as Web traffic, leads, online sales and brand awareness. Interestingly,
increasing measurable ROI ranked higher as an objective than developing an actual strategy to do so!
Chart: Comparing most frustrating SEO challenges with most important SEO objectives
11%
20%
20%
14%
44%
55%
38%
47%
27%
62%
72%
11%
17%
26%
27%
29%
31%
37%
39%
42%
48%
53%
Improving public relations
Increasing offline sales revenue
Integrating search marketing data
with CRM and other marketing systems
Integrating search marketing
analytics into a single dashboard
Increasing online sales revenue
Improving brand/product
awareness or reputation
Integrating with social media
Achieving or increasing measurable ROI
Developing an effective
and methodical strategy
Increasing lead generation
Increasing website traffic
Challenges from last 12 months
Objectives for next 12 months
Source: ©2011 MarketingSherpa Search Marketing Benchmark Survey
Methodology: Fielded April 2011, N=1,530
MarketingSherpa 2012 Search Marketing Benchmark Report – SEO Edition
3
© Copyright 2000–2011 MarketingSherpa LLC, a MECLABS Group Company.
It is forbidden to copy this report in any manner. For permissions, contact
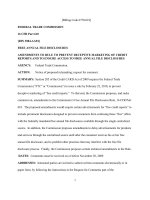
KEY FINDING: CONTENT CREATION WORKS THE BEST, BUT TAKES THE MOST WORK
Keyword and keyphrase research is an old standby. When done well, this research delivers results and
creates a competitive advantage, explaining its popular levels of usage. Creating title tags is another
keyword-related and commonly used tactic – one which marketers considered to be equally effective.
Content creation stands apart in the cluster of tactics, both for its difficulty and its effectiveness. Good
content creates buzz and attracts links. For this reason, marketers who commit to the effort required in
creating quality content can improve their SEO positions.
Chart: Three dimensional view of SEO tactics
But, what is good and effective content? From the perspective of marketers surveyed, Web pages ranked
highly, with half of marketers stating that they are very effective in helping them achieve their marketing
objectives. Many Web pages also act as SEO landing pages if they serve as an entry point from search
results. When pages have strong customer-oriented language, good layouts and clear call-to-actions, there
is a greater likelihood of “click through” than “click back.”
Webinars and whitepapers were other leading examples of good content, with 46 percent and 40 percent
of marketers, respectively, rating these as very effective content products.
Digital
asset
optimization
Competitor
Benchmarking
SEO landing
pages
Blogging
Social
media
integration
External link
building
Content
creation
Internal
linking
URL
structure
Meta description
tags
Title tags
Keyword and
keyphrase
research
0%
10%
20%
30%
40%
50%
60%
0% 10% 20% 30% 40% 50% 60% 70% 80% 90%
Level of Effectiveness
Degree of Difficulty
Sphere size indicates level of usage
Source: ©2011 MarketingSherpa Search Marketing Benchmark Survey
Methodology: Fielded April 2011, N=1,530
MarketingSherpa 2012 Search Marketing Benchmark Report – SEO Edition
4
© Copyright 2000–2011 MarketingSherpa LLC, a MECLABS Group Company.
It is forbidden to copy this report in any manner. For permissions, contact
KEY FINDING: INCREMENTAL SEO IMPROVEMENTS ADD UP TO LARGE GAINS
Organizations that routinely follow a formal process and thorough guidelines for their SEO practices and
programs reap the biggest bottom-line benefits. One example is lead quality. Organizations in the Trial or
Transition phases for SEO performance management each had a percentage of natural search leads
deemed "low-quality." In contrast, only organizations in the Strategic phase could declare that all leads
from natural search traffic were either of the highest quality or of mixed quality.
Chart: Organic traffic lead quality and conversion rates, by SEO maturity phase
Not only do the efforts of strategically minded organizations pay off through a larger percentage of high-
quality leads from organic search traffic, but they also convert more of these leads. When looking at
median conversion rates, Strategic organizations tend to convert 150 percent more leads than Trial
organizations and 25 percent more than Transition organizations, or those with informal processes and
guidelines.
3% 24% 27%
2%
4%
5%
8%
9%
10%
0%
5%
10%
15%
20%
25%
30%
0%
2%
4%
6%
8%
10%
12%
TRIAL
We have no process or
guidelines for performing SEO
TRANSITION
We have an informal process
with a few guidelines we
sporadically perform
STRATEGIC
We have a formal process
with thorough guidelines we
routinely perform
Highest Quality Leads Median Conversion Rate Average Conversion Rate
Source: ©2011 MarketingSherpa Search Marketing Benchmark Survey
Methodology: Fielded April 2011, N=1,530
MarketingSherpa 2012 Search Marketing Benchmark Report – SEO Edition
5
© Copyright 2000–2011 MarketingSherpa LLC, a MECLABS Group Company.
It is forbidden to copy this report in any manner. For permissions, contact
KEY FINDING: FUTURE INVESTMENTS IN SEO BACKED BY HAVING SEO PROCESS IN PLACE
Who doesn’t like to get the biggest bang for the buck? Organizations in the Transition and Strategic phases
of SEO maturity convert more high-quality leads from natural search visits. As such, it makes sense for
organizations to put more money into these programs.
Chart: Expected 12-month SEO budget change, by SEO maturity phase
Organizations that are relatively immature with their SEO processes are still investing money into SEO. The
overwhelming majority of these organizations spend their SEO budgets on staff salaries, whereas Transition
and Strategic organizations tend to divide their budgets across staff salaries, outsourced agency services,
and for-fee SEO marketing and analytics tools.
5%
5%
47%
44%
36%
5%
28%
14%
16%
11%
18%
5%
3%
9%
TRIAL
We have no process or
guidelines for performing
SEO
TRANSITION
We have an informal
process with a few
guidelines we sporadically
perform
STRATEGIC
We have a formal process
with thorough guidelines
we routinely perform
Increase > 50%
Increase 20% to 50%
Increase < 20%
No change
Decrease < 20%
Decrease 20% to 50%
Source: ©2011 MarketingSherpa Search Marketing Benchmark Survey
Methodology: Fielded April 2011, N=1,530
MarketingSherpa 2012 Search Marketing Benchmark Report – SEO Edition
6
© Copyright 2000–2011 MarketingSherpa LLC, a MECLABS Group Company.
It is forbidden to copy this report in any manner. For permissions, contact
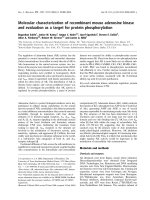
KEY FINDING: LOCAL BUSINESS LISTING TACTICS ARE UNDERUTILIZED
Local business listings and reviews now sit atop natural search results; therefore, it is critical to be found
through local search. Despite this reality, only 37 percent of organizations surveyed claimed a local business
listing on one or more search engines. Of those, most did not fully employ available listing tactics.
Chart: Local business listing tactics used for local search purposes
Even fewer organizations, namely 27 percent, had optimized for local search as part of their organic search
(SEO) strategy. Adding local content to Web pages, blog posts and titles was the most popular local
optimization tactic for this group, with 81 percent committed to this effort. By contrast, posting customer
reviews or making customers aware of a customer review site (e.g. Yelp, Places) were efforts that ranked
low in their execution. With local search algorithms placing weight on the quantity of reviews and citations,
the importance of encouraging more (unbiased, non-incentivized) reviews cannot be overrated.
Interestingly, marketers indirectly agreed with this in another question, where 88 percent said that
customer reviews were the most effective content product for helping them achieve their marketing
objectives.
5%
11%
16%
20%
43%
47%
48%
48%
60%
81%
Mobile coupons added to listing
Google Boost
Coupons added to listing
Videos added to listing
Listing associated with a range of
related business categories
Google Tags
Listing enhanced with custom details
Images added to listing
Listing description optimized
with target keywords
Phone number included with listing
Source: ©2011 MarketingSherpa Search Marketing Benchmark Survey
Methodology: Fielded April 2011, N=1,530
Get free case studies and how-to arcles from our reporters
Join 237,000 weekly newsleer readers. Receive free, in-depth case studies and how-to arcles based
on hundreds of hour-long interviews with brand-side markeng VPs and directors about Inbound
Markeng every year.
Inbound Markeng
Keep up with the latest trends in the ever-changing world of
search, social, and content markeng. Bi-Weekly
Subscribe for FREE
www.markengsherpa.com/newsleers
First email my PDF copy to:
Then mail my printed copy to:
Name Title
Organization
Address
City State/Prov Country Zip/Postal
Phone (in case of questions)
Charge my: MasterCard Visa AMEX
Card# Exp. Date
Print Cardholder Name
Signature
OR
Bill Me* Check Enclosed to MarketingSherpa LLC
* Billing: I understand I will not receive the Guides until payment is received
(we respect your privacy)
About
Praised by The Economist, Harvard Business
School’s Working Knowledge Site, and
Entrepreneur.com, MarketingSherpa is a research
rm publishing benchmark data and how-to
guidance for marketing professionals.
237,000 marketers read our exclusive Case Study
newsletters every week, and thousands attend our
annual Summits on email, subscription sales, and
b-to-b marketing.
100% SATISFACTION GUARANTEE
MarketingSherpa guarantees your satisfaction.
If anything we sell doesn’t meet your
satisfaction, return it for a 100% hassle-free refund
immediately!
MarketingSherpa LLC
499 Main Street, Warren, RI, 02885
Phone: 877-895-1717
(if outside the US call 401-247-7655)
Fax: (401) 247-1255
I want the most recent resource available with new data
and insights in the 2012 Search Marketing Benchmark
Report - SEO Edition. I want to take advantage of the
$100 discount and I know my order is risk-free because
it’s covered by MarketingSherpa’s 100% satisfaction
guarantee.
YES!
Fax form to: (401) 247-1255
Fax form to: (401) 247-1255
Special Discount: Save $100
185 Pages
Order Now:
or
Call: 877-895-1717
New 2012 Search Marketing Report- SEO
Edition Includes:
• 161Chartsandanalyticalcommentary
• 1,530Surveyedmarketersused
•Specialsectionsoncontent,searchmarketing
strategy, local and mobile search, and integration
• TopSEOtaticsincludingcontentcreation,external
link building, keyword and keyphrase research
• Searchmarketingsuccessstories:Usingsocialmedia
boosts leads 30% and revenue 114%
PDF + Print Copy
($347 +Postage & Handling)
PDF Only
($297)
Special Rate Sponsor: