Báo cáo khoa học: Differential expression of liver and kidney proteins in a mouse model for primary hyperoxaluria type I pdf
Bạn đang xem bản rút gọn của tài liệu. Xem và tải ngay bản đầy đủ của tài liệu tại đây (414.48 KB, 9 trang )
Differential expression of liver and kidney proteins in a
mouse model for primary hyperoxaluria type I
Juan R. Herna
´
ndez-Fernaud
1
and Eduardo Salido
2
1 Max Planck Institute for Biochemistry, Department of Proteomics and Signal Transduction, Klopferspitz, Martinsried, Germany
2 Hospital Universitario Canarias, Center Biomedical Research on Rare Diseases (CIBERER) and Institute of Biomedical Technologies (ITB),
Tenerife, Spain
Introduction
Primary hyperoxaluria type I (PHI) is a rare autosomal
recessive disease caused by mutations in the alanine-gly-
oxylate aminotransferase gene (AGXT). Alanine-glyoxy-
late aminotransferase (AGT) (or alanine-glyoxylate
aminotransferase 1, AGT1), the protein encoded by
AGXT, plays an important physiological role in glyoxy-
late detoxification by converting it into glycine. The
enzyme is present in peroxisomes and ⁄ or mitochondria
in different mammalian species, with peroxisomal AGT
being mainly responsible for the detoxification of glyco-
late-derived glyoxylate, and mitochondrial AGT playing
a major role in the metabolism of hydroxyproline-
derived glyoxylate [1]. In humans, insufficient AGT
activity in peroxisomes leads to increased cytosolic
conversion of glyoxylate to oxalate. Excessive renal
excretion of oxalate causes calcium oxalate deposition
(nephrocalcinosis and urolithiasis) and eventual loss of
renal function. After renal failure, calcium oxalate depo-
sition becomes widespread and life-threatening unless
liver and kidney transplantation are performed. With a
better understanding of glyoxylate metabolism, sub-
strate depletion may potentially be a useful intervention
in patients with PHI [2].
In order to further analyze the mechanisms of PHI
disease, and to explore new therapeutic approaches, we
have developed an Agxt knockout (AgxtKO) mouse
that reproduces some key features of PHI [3].
Homozygous Agxt
) ⁄ )
mice show severe hyperoxaluria,
Keywords
hyperoxaluria; kidney; liver; mouse model;
subcellular fractions
Correspondence
E. C. Salido, Hospital Universitario Canarias,
Center Biomedical Research on Rare
Diseases (CIBERER) and Institute of
Biomedical Technologies (ITB), Tenerife
38320, Spain
Fax: +34 922 647 112
Tel: +34 922 319 338
E-mail:
(Received 29 July 2010, revised 3
September 2010, accepted 10 September
2010)
doi:10.1111/j.1742-4658.2010.07882.x
Mutations in the alanine-glyoxylate aminotransferase gene (AGXT) are
responsible for primary hyperoxaluria type I, a rare disease characterized
by excessive hepatic oxalate production that leads to renal failure. A deeper
understanding of the changes in the metabolic pathways secondary to the
lack of AGXT expression is needed in order to explore substrate depletion
as a therapeutic strategy to limit oxalate production in primary hyperoxal-
uria type I. We have developed an Agxt knockout (AgxtKO) mouse that
reproduces some key features of primary hyperoxaluria type I. To improve
our understanding of the metabolic adjustments subsequent to AGXT defi-
ciency, we performed a proteomic analysis of the changes in expression lev-
els of various subcellular fractions of liver and kidney metabolism linked
to the lack of AGXT. In this article, we report specific changes in the liver
and kidney proteome of AgxtKO mice that point to significant variations
in gluconeogenesis, glycolysis and fatty acid pathways.
Abbreviations
AGT1, alanine-glyoxylate aminotransferase 1; AGT2, alanine-glyoxylate aminotransferase 2; AGXT, alanine-glyoxylate aminotransferase gene;
Agxt
) ⁄ )
, alanine-glyoxylate aminotransferase homozygous knockout; ML, mitochondrial ⁄ lysosomal; PHI, primary hyperoxaluria type I; SPT,
serine-pyruvate aminotransferase; 2-DE, two-dimensional electrophoresis.
4766 FEBS Journal 277 (2010) 4766–4774 Journal compilation ª 2010 FEBS. No claim to original German government works
and males develop calcium oxalate crystalluria and cal-
culi in the urine bladder, although no deposits in the
renal parenchyma (nephrocalcinosis) are observed
unless the animals are subjected to metabolic overload.
To better characterize this model, and provide
evidence useful in substrate depletion strategies, we
report in this article a proteomic analysis of the
changes in expression levels of various enzymes of liver
and kidney metabolism linked to the lack of AGT.
Results
We first attempted to detect differences in protein
expression between hyperoxaluric and control mice at
the whole-organ proteome level, using either liver
or kidney samples. This approach yielded insufficient
protein spots and lower reproducibility than that based
on subcellular fractionation, and was not pursued fur-
ther. However, for each subcellular fraction studied,
more than 300 protein spots were detected in each two-
dimensional electrophoresis (2-DE) gel. For each frac-
tion, three 2-DE silver- and Coomassie-stained gels were
integrated and analyzed, and high reproducibility was
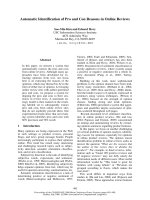
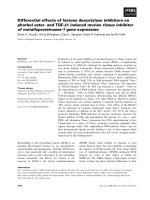
achieved (Fig. 1). By image analysis, using the relative
spot volume parameter, the comparison between gels of
wild-type and knockout kidney proteomes revealed 22
spots whose protein levels were significantly different
between groups (P < 0.01), with three exclusive of
knockout mice. Twenty of these differentially expressed
proteins were correctly matched to protein candidates
in the database (Table 1) according to their peptide
mass fingerprints analyzed by MALDI-TOF MS.
pH3 10
AB
CDE
F
GH
pH3 10
Fig. 1. Comparison of 2-DE patterns among
different extraction methods and cell
fractions. (A, B) Total extraction protein
method of kidney and liver organs,
respectively. (C, D, E) Mitochondrial-
lysosomal, peroxisomal and cytosolic
fractions of kidney. (F, G, H) Mitochondrial-
lysosomal, peroxisomal and cytosolic
fractions of liver. Total protein (300 lg) was
subjected to 2-DE (first dimension: glass
capillaries; pH 3–10; 12 cm; second
dimension: 10% polyacrylamide SDS ⁄ PAGE;
18 · 18 cm
2
). Proteins were visualized by
silver staining.
J. R. Herna
´
ndez-Fernaud and E. Salido Proteome changes in primary hyperoxaluria
FEBS Journal 277 (2010) 4766–4774 Journal compilation ª 2010 FEBS. No claim to original German government works 4767
Database search and functional exploration of these
proteins revealed that they were associated with dif-
ferent metabolic aspects, such as oxidoreductase activ-
ity, glycolysis, glycine, glyoxylate, fatty acid and
pyruvate metabolism. Hydroxyacid oxidase 3 was
two-fold more abundant in knockout mice than in
controls. In contrast, d-amino acid oxidase 1 was 2.3-
fold downregulated in hyperoxaluric mice. Enolase 1
and malic enzyme were upregulated. Furthermore,
acyl-coenzyme A dehydrogenase, mercaptopyruvate
sulfotransferase and abhydrolase domain protein were
only detected in knockout mouse kidneys (Table 1,
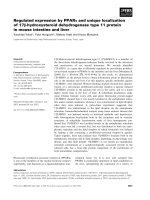
Fig. 2A).
In liver fractions, 18 spots were identified with protein
levels significantly different between the groups
(P < 0.01), and two were exclusively detected in knock-
out mice. In 14 of the 18 spots, MALDI peptide mass
fingerprints allowed the identification of the correspond-
ing proteins in the database (Table 2). Database search
and functional exploration of these proteins revealed
that they were associated with gluconeogenesis and
glycolysis. In this sense, fructose bisphosphatase was
2.4-fold upregulated in knockout mice. However, alde-
hyde dehydrogenase, carbonic anhydrase, enolase and
malic enzyme were downregulated (Table 2, Fig. 2B). In
cytosolic fractions, the fumarylacetoacetate hydrolase
and peroxiredoxin 6 appeared, with shifted pI from
approximately 6.9 to 7 and 6 to 5.5, respectively.
Western blot analysis was used to confirm the main
differences in expression found in 2-DE gels, provided
that antibodies were available.
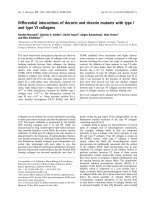
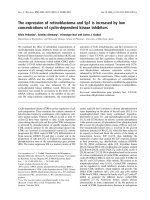
The results are summarized in Fig. 3A. In AgxtKO
mice, kidney enolase was clearly overexpressed, as were
liver fructose bisphosphatase and catalase, whereas
liver enolase and carbonic anhydrase 3 were downregu-
lated. Comparable amounts of b-actin were present in
AgxtKO and wild-type cytosolic fractions, and the
absence of AGT1 protein in AgxtKO samples was also
confirmed by western blot.
The changes in expression levels observed in these
few proteins are in agreement with 2-DE results, which
is consistent with the reliability of our comparative
proteomic study.
To assess the tissue specificity of the liver and kid-
ney response, we also performed western blot analysis
of skeletal muscle proteins. We observed high variabil-
ity and could not reproduce the detected differences in
liver and kidney samples (Fig. 3B).
Discussion
We have analyzed the changes in protein expression
within the liver and kidney of Agxt
) ⁄ )
deficient mice
compared with wild-type controls by 2-DE separation
and MS. The analysis of specific subcellular fractions
was necessary to obtain highly informative and repro-
ducible 2-DE gels. The modified fractionation protocol
adopted has been used previously in proteomic studies
[4], but does not result in highly pure fractions, which
is likely to be the reason for some inconsistencies
between the fraction in which we detected a differen-
tially expressed protein and their accepted subcellular
localization. For instance, we detected d-amino acid
oxidase in the mitochondrial ⁄ lysosomal (ML) fraction
of kidney, whereas its accepted localization is either
cytosolic or peroxisomal. Most likely, our ML fraction
contained peroxisomes that cosedimented during the
procedure used. Similarly, liver catalase was detected
in our cytosolic fraction, indicating that peroxisomes
and ⁄ or peroxisomal proteins were still present in the
supernatant after the 7300 g centrifugation. Under
standard purification procedures, peroxisomal proteins
are known to contaminate other subcellular fractions
because of peroxisomal fragility. With this limitation,
our fractionation method was mainly useful as a sim-
ple way to reduce the complexity of the proteome,
facilitating the differential expression analysis between
wild-type and AgxtKO mice.
Agxt
) ⁄ )
mice have impaired glyoxylate detoxifica-
tion, with subsequent oxalate overproduction by the
liver and increased urinary oxalate excretion, similar to
patients with PHI [3]. However, significant differences
between mouse and human glyoxylate and glucose
metabolism must be considered. Although human
AGT1, the product of the AGXT gene, is predomi-
nantly localized in the peroxisome, the mouse Agxt1
gene is transcribed into two different mRNA species,
coding for mitochondrial and peroxisomal variants [5].
Indeed, rodent AGT1 is also known as serine-pyruvate
aminotransferase (SPT) because the mitochondrial
form participates in gluconeogenesis from serine,
whereas the conversion of glyoxylate to glycine takes
place largely in peroxisomes. No alterations of glucose
metabolism have been described in patients with PHI.
In AgxtKO mice, we detected an increase in liver
fructose-1,6-bisphosphatase, an enzyme involved in the
hydrolysis of fructose-1,6-bisphosphate, which plays an
important regulatory role in gluconeogenesis [6]. In the
same hepatic fractions, a decrease in cytosolic malic
enzyme 1 was observed, pointing to a reduction in
NADPH available for fatty acid biosynthesis. Taken
together, these results seem to be indicative of an adap-
tation in favor of liver gluconeogenesis in response to
the lack of AGT1. Other downregulated enzymes,
such as aldehyde dehydrogenase 2, enolase 1, UDP-
glucose pyrophosphorylase 2 and fumarylacetoacetate
Proteome changes in primary hyperoxaluria J. R. Herna
´
ndez-Fernaud and E. Salido
4768 FEBS Journal 277 (2010) 4766–4774 Journal compilation ª 2010 FEBS. No claim to original German government works
Table 1. Summary of kidney proteins that are differentially expressed (P < 0.01) in mitochondrial ⁄ lysozome (ML), peroxisomal (P) and cytosolic (C) fractions.
Group
number Protein name Short name NCBI no.
Theorical
MW (Da) ⁄ pI
Matched
peptide
Sequence
coverage (%)
Mascot
score
Missed
cleavage
Fold ko
expression
Vol
(%) Fraction
431 Enolase 1, a non-neuron Eno1 gi: 13278078 47 322 ⁄ 6.36 12 37 135 1 +2.27 – ML
577
D-Amino acid oxidase 1 Dao1 gi: 198572 39 017 ⁄ 7.19 10 35 130 1 )2.35 – ML
722 Hydroxyacid oxidase 3 Hao3 gi: 20379611 39 145 ⁄ 7.55 9 29 124 1 +2 – ML
976
a
Mercaptopyruvate sulfotransferase Mpst gi: 13278579 33 100 ⁄ 6.12 11 33 123 1 Only ko 0.25 ML
1280
a
Acyl-coenzyme A dehydrogenase,
short chain
Acads gi: 16740777 45 146 ⁄ 8.68 13 33 115 2 Only ko 0.225 ML
96 PDZ domain containing 1 Pdzk1 gi: 15488745 56 862 ⁄ 5.34 10 25 133 1 +15.15 – P
227 Hydroxyacid oxidase 3 Hao3 gi: 20379611 39 145 ⁄ 7.55 7 23 71 2 +18.65 – P
257 Endoplasmic reticulum protein 29 Erp29 gi: 16877776 28 862 ⁄ 5.90 10 37 120 2 )3.3 – P
67 Aconitase 1 Aco1 gi: 110347487 98 705 ⁄ 7.23 10 19 103 1 )3.61 – C
129 Malic enzyme 1, NADP(+)-dependent,
cytosolic
Me1 gi: 13096987 64 426 ⁄ 6.87 9 13 91 2 +3.22 – C
165 DnaJ (Hsp40) homolog, subfamily A,
member 1
DnaJA1 gi: 81894107 45 581 ⁄ 6.65 7 31 74 2 +1.56 – C
202 Apolipoprotein A-IV ApoA4 gi: 14789706 44 545 ⁄ 5.48 13 40 128 1 +1.68 – C
216 Actin, b, cytoplasmic ActB gi: 387083 39 446 ⁄ 5.78 8 33 109 1 +1.92 – C
224 NSFL1 (p97) cofactor (p47) Nsfl1C gi: 12850132 40 685 ⁄ 5.04 15 44 178 1 +1.92 – C
240 Aminoacylase 1 Acy1 gi: 13542872 45 980 ⁄ 5.89 9 29 82 1 +3.76 – C
300 Phosphoglycerate mutase 1 Pgam1 gi: 12805529 28 797 ⁄ 6.75 7 21 89 1 )3.28 – C
303 Indolethylamine N-methyltransferase Inmt gi: 15488762 30 068 ⁄ 6.0 4 30 64 0 )4.73 – C
311 Peroxiredoxin 6 Prdx6 gi: 15488685 24 838 ⁄ 5.72 7 37 90 1 )9.28 – C
313 Apolipoprotein A-I ApoA1 gi: 109571 30 358 ⁄ 5.52 7 25 77 1 +7.69 – C
337
a
Abhydrolase domain containing 14b Abhd14b gi: 18043201 22 551 ⁄ 6.82 5 30 63 1 Only ko 0.191 C
a
The figures show the magnified comparison maps between wild-type (wt) and knockout (ko) of spots 1280, 976 and 337.
337
wt ko
1280
wt ko
976
wt ko
J. R. Herna
´
ndez-Fernaud and E. Salido Proteome changes in primary hyperoxaluria
FEBS Journal 277 (2010) 4766–4774 Journal compilation ª 2010 FEBS. No claim to original German government works 4769
hydrolase, appear to support this observation. These
results are consistent with our previous observation
that AgxtKO mice did not seem to show a deficit in
gluconeogenesis despite the absence of the AGXT1
gene product [3]. There is also a significant level of
another aminotransferase, AGT2, in mouse liver [7],
although kinetic studies [8] indicate that its alanine-
glyoxylate aminotransferase activity is not favored
over aminobutyrate-pyruvate, b-alanine-pyruvate and
dimethylarginine-pyruvate aminotransferase activities.
In the rat, gluconeogenesis from l-serine takes place
mainly through l-serine dehydratase, whereas the flux
through SPT ⁄ AGT in gluconeogenesis from serine has
been shown to be significant only after the liver mito-
chondrial form of the AGT1 enzyme had been induced
by glucagon [9]. However, the peroxisomal form of
SPT ⁄ AGT predominates during constitutive expression
of rat and mouse AGXT genes, and the gluconeogenic
flux from serine also takes place in this organelle to
some extent [10]. Amino acid metabolism is considered
to be a major contributor to endogenous oxalate syn-
thesis, justifying the study of changes in liver enzymes
in the context of primary hyperoxaluria. It could be
speculated that our finding of enhanced liver gluconeo-
genesis in the PHI mouse model is an adaptation to
the lack of serine flux through AGT, and modifications
that potentiate neoglucogenesis might be beneficial in
primary hyperoxaluria, reducing the oxalate contribu-
tion from amino acid metabolism. These modifications
might be seen as a form of substrate depletion. How-
ever, the above-mentioned differences in AGT subcel-
lular localization between humans and laboratory
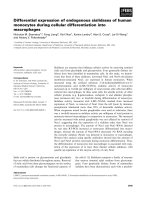
Fig. 2. Metabolic kidney (A) and liver (B)
enzymes upregulated (+) and downregulated
()) in knockout mice, or spots only present
in knockout mice. Acads, acyl-coenzyme A
dehydrogenase, short chain; Aco1,
aconitase 1; Agt
)
, alanine-glyoxylate
aminotransferase knockout; Aldh2, aldehyde
dehydrogenase 2; Car3, carbonic anhydr-
ase 3; Cat, catalase; Dao1,
D-amino acid
oxidase 1; Eno1, enolase 1, a non-neuron;
Fah, fumarylacetoacetate hydrolase; Fbp1,
fructose bisphosphatase 1; Hao3,
hydroxyacid oxidase 3; Me1, malic
enzyme 1, NADP(+)-dependent; Mpst,
mercaptopyruvate sulfotransferase; Pgam1,
phosphoglycerate mutase 1; Prdx6,
peroxiredoxin 6; Ugp2, UDP-glucose
pyrophosphorylase 2.
Proteome changes in primary hyperoxaluria J. R. Herna
´
ndez-Fernaud and E. Salido
4770 FEBS Journal 277 (2010) 4766–4774 Journal compilation ª 2010 FEBS. No claim to original German government works
Table 2. Summary of liver proteins that are differentially expressed (P < 0.01) in mitochondrial ⁄ lysosomal (ML), peroxisomal (P) and cytosolic (C) fractions.
Group
number Protein name
Short
name NCBI nr
Theorical
MW (Da) ⁄ pI
Matched
peptide
Sequence
coverage (%)
Mascot
score
Missed
cleavage
Fold ko
expression
Vol
(%) Fraction
250 Aldehyde dehydrogenase 2,
mitochondrial
Aldh2 gi:13529509 57 015 ⁄ 7.53 14 29 149 1 )1.90 – ML
265 Eukaryotic translation
elongation factor 2
Eef2 gi:192989 30 212 ⁄ 6.2 6 32 76 1 +2.27 – ML
333 Fructose bisphosphatase 1 Fbp1 gi:9506589 37 288 ⁄ 6.15 8 33 99 1 +2.44 – ML
219 Carbonic anhydrase 3 Car3 gi:15029812 29 502 ⁄ 6.97 10 55 130 1 )2.99 – P
220 Carbonic anhydrase 3 Car3 gi:15029812 29 502 ⁄ 6.97 10 55 130 1 )3.69 – P
109 Malic enzyme 1,
NADP(+)-dependent
Me1 gi:13096987 64 426 ⁄ 6.87 7 14 84 0 )2.11 – C
120 Catalase Cat gi:157951741 59 882 ⁄ 7.72 8 21 97 0 +4.54 – C
145 UDP-glucose pyrophosphorylase 2 Ugp2 gi:21314832 55 634 ⁄ 6.92 9 27 116 1 )1.79 – C
203 Fumarylacetoacetate hydrolase Fah gi:14789698 46 416 ⁄ 6.92 11 28 120 0 )1.67 – C
146
a
Fumarylacetoacetate hydrolase Fah gi:14789698 46 416 ⁄ 6.92 8 21 86 0 Only ko 1.18 C
215 Enolase 1, a non-neuron Eno1 gi:55491 47 322 ⁄ 6.36 7 18 79 0 )2.50 – C
258 Carbonic anhydrase 3 Car3 gi:15029812 29 502 ⁄ 6.97 8 45 121 0 )3.86 – C
267 Peroxiredoxin 6 Prdx6 gi:15488685 24 925 ⁄ 5.98 9 53 127 1 )2.49 – C
201
a
Peroxiredoxin 6 Prdx6 gi:15488685 24 925 ⁄ 5.98 7 43 96 1 Only ko 0.561 C
a
The figures show the magnified comparison maps between wild-type (wt) and knockout (ko) of spots 146 and 201.
146
wt ko
201
wt ko
J. R. Herna
´
ndez-Fernaud and E. Salido Proteome changes in primary hyperoxaluria
FEBS Journal 277 (2010) 4766–4774 Journal compilation ª 2010 FEBS. No claim to original German government works 4771
rodents pose a major limitation to our study and the
inferences that can be based on our findings. Further
studies of the sources of endogenous oxalate synthesis
in humans are needed.
The phenotypic features of Agxt
) ⁄ )
mice are proba-
bly the direct consequence of impaired glyoxylate
detoxification, with subsequent oxalate overproduction
by the liver and increased urinary oxalate excretion.
As AGT1 is not expressed at significant levels in the
kidney, the changes observed in the kidney proteome
could be a consequence of variations in filtered metab-
olites, such as oxalate, present at high levels in
AgxtKO mice. Nephrocalcinosis is essentially absent in
Agxt
) ⁄ )
mice, despite high urinary oxalate excretion,
unless glyoxylate precursors are administered. Thus,
the response in the kidney proteome to AGT1 deficit is
unlikely to be secondary to serious tissue damage. The
increase in kidney enolase points to an enhanced gly-
colysis, whereas higher levels of hydroxyacid oxidase 3
could represent adjustments in medium-chain hydroxy-
fatty acid metabolism. The overexpression of enolase 1
and malic enzyme 1 supports the induction of fatty
acid metabolism. The reduction in d-amino acid oxi-
dase 1 expression in the kidney proteome is interesting,
in view of the contribution of this enzyme to glyoxy-
late production from glycine. Thus, it could be specu-
lated that a decrease in d-amino acid oxidase 1
expression might be aimed at reducing the glyoxylate
overload in the kidney of AgxtKO mice.
In conclusion, changes in the proteome contents of
hyperoxaluric liver and kidney subcellular fractions
should improve our understanding of the metabolic
adjustments subsequent to AGXT deficiency, and
might provide relevant clues for future developments
of substrate depletion approaches in the treatment of
primary hyperoxaluria.
Experimental procedures
Animals
Mice were bred and maintained in a pathogen-free facility,
with free access to standard chow (A04, SAFE, Augy,
France) and water. Male mice from heterozygous
(Agxt
+ ⁄ )
) breeders (B6.129SvAgxt
tm1Ull
) were used and
genotyped as reported previously [3]. All the experiments
were performed in accordance with Spanish and European
law regarding the use of animals in research (European
Community Council Directive of 24 November 1986,
86 ⁄ 609 ⁄ EEC), following a protocol that had been approved
by our Institutional Committee on Ethics in Animal Experi-
mentation (CEBA-HUC). Mice were sacrificed by cervical
dislocation, performed by trained personnel, in accordance
with CEBA-HUC-approved protocols. Immediately after
brain death, laparotomy and bilateral thoracotomy were
performed and the organs were harvested, making sure that
the animals did not suffer at any stage of the procedure.
Tissues from eight, 3-month-old male mice allocated to
0
1
2
3
4
5
6
7
8
9
Eno1-K Fbp1-L
FML
Car3-L
FP
Car3-L
FC
Cat-L
FC
Eno1-L Agt-L
FP
Actin-L
FC
Grhpr-L
FML
Grhpr-K
FML
Eno1-M
FML
Fbp1-M
FML
FP FC FC
Eno1-M
FC
0
1
2
3
A
B
Fig. 3. (A) Western blot analyses of enolase
(Eno1-K) and glyoxylate reductase ⁄ hydroxy-
pyruvate reductase (Grhpr-K) from kidney
and fructose bisphosphatase (Fbp1-L),
carbonic anhydrase 3 (Car3-L), catalase
(Cat-L), enolase (Eno1-L), alanine-glyoxylate
aminotransferase (Agt-L), actin (Actin-L) and
glyoxylate reductase ⁄ hydroxypyruvate
reductase (Grhpr-L) from liver. (B) Western
blot analyses of enolase (Eno1-M), fructose
bisphosphatase (Fbp1-M), carbonic anhydr-
ase 3 (Car3-M) and catalase (Cat-M) from
muscle. The analyses are in mitochon-
drial ⁄ lysosomal (FML), peroxisomal (FP) and
cytosolic (FC) fractions. Densitometry of
western blot bands was performed and
units of selected proteins were calculated.
A representative western blot band for each
protein of each experimental group is
shown. Relative molecular weights were 47,
74, 29, 60, 45, 40 and 36 kDa for Eno1,
Fbp1, Car3, Cat, Agt, Actin and Grhpr,
respectively.
Proteome changes in primary hyperoxaluria J. R. Herna
´
ndez-Fernaud and E. Salido
4772 FEBS Journal 277 (2010) 4766–4774 Journal compilation ª 2010 FEBS. No claim to original German government works
Agxt
) ⁄ )
(hyperoxaluric) and from homozygous wild-type
(Agxt
+ ⁄ +
; control) mice were harvested, sliced and thor-
oughly rinsed in ice-cold saline before freezing.
Sample preparation
Tissues for whole-protein extraction were frozen and
crushed in liquid nitrogen. The powder was lyophilized and
10 mg were extracted, during 1 h at 4 °C, in 350 lLof
extraction buffer with 8 m urea, 4% Chaps, 40 mm Tris,
65 mm 1,4-dithioerythritol, 0.05% SDS and 2% ampho-
lytes. Next, the sample was centrifuged at 13 000 g for
30 min at 4 °C to form a pellet of insoluble material.
Subcellular fractionation by differential centrifugation was
performed as described previously [4]. The tissue was imme-
diately minced in ice-cold isotonic buffer (5 : 1, v ⁄ w) contain-
ing 250 mm sucrose, 10 mm Tris ⁄ HCl, pH 7.5, and 1 mm
EDTA. The cells were ruptured by 20 strokes in a glass
homogenizer, and the lysate was centrifuged at 200 g for
10 min to sediment the nuclei. The supernatant was
centrifuged again at 2000 g for 10 min to sediment a
mitochondria-containing pellet that was homogenized in
1 mL of isotonic buffer and centrifuged at 7300 g for 10 min
to obtain a crude mitochondrial pellet. The 2000 g superna-
tant was centrifuged at 7300 g for 10 min to obtain a crude
peroxisomal fraction. The peroxisome pellet was homoge-
nized and centrifuged once again, and the supernatant was
centrifuged for 60 min at 7300 g to remove additional organ-
elles from the cytosolic fraction. Proteins in the cytosolic
fraction were precipitated with cold acetone (1 : 1, v ⁄ v) for
60 min at )20 °C and centrifuged at 13 000 g for 30 min at
4 °C. The pellet was washed with cold acetone, centrifuged
once and air dried. Organelle and protein pellets were
solubilized in the extraction buffer and centrifuged at
13 000 g for 30 min at 4 °C. The supernatants were recov-
ered and stored at )20 °C. The protein concentration was
determined by the Bradford method with BSA as the pro-
tein standard.
2-DE
Isoelectric focusing was performed using glass capillary
tubes (inside diameter, 1.5 mm; length, 12 cm). For separa-
tion in the pH 5–8 range, capillary tubes were filled with
solution containing 3% acrylamide, 7 m urea, 0.6% Triton
X-100, 0.75% ampholytes pH 5–8, 0.22% ampholytes
pH 3–10 and 0.22% ampholytes pH 7–9, 0.045%
N,N,N¢,N¢-tetramethylethylenediamine and 0.08% ammo-
nium persulfate. For separation in the pH 3–10 range,
0.75% ampholytes pH 3–10 and 0.22% ampholytes pH 5–8
were used instead. Samples containing approximately
300 lg of total protein were applied to the basic end of the
tube gel. Cathodic and anodic buffers were 20 mm NaOH
and 8.7 mm H
3
PO
4
, respectively. Isoelectric focusing steps
consisted of 1 h at 100 and 1 h at 300 V, followed by
17.5 h at 1000 V and 30 min at 2000 V. Next, the capillar-
ies were equilibrated for 15 min in reducing buffer contain-
ing 50 mm Tris ⁄ HCl, pH 8.8, 30% glycerol, 6 m urea, 2%
SDS and 1% dithiothreitol, followed by a blocking step in
similar buffer containing 2.5% iodoacetamide instead of
dithiothreitol for another 15 min. The capillary gels were
then transferred to the top of 18 · 18 cm
2
, 1.5-mm-thick,
10% polyacrylamide gels (SDS ⁄ PAGE) and embedded in
0.5% low-melting agarose containing a trace of bromophe-
nol blue. SDS ⁄ PAGE was run at 15 °C, initially at 20 mA
for 15 min and then at 50 mA per gel until the blue
front reached the bottom. For external calibrations, molec-
ular mass markers (Sigma, St. Louis, MO, USA) were
loaded onto the second dimension. The protein spots
were visualized by staining with either Coomassie blue
R-250 for preparative gels [11] or silver nitrate for analyti-
cal gels [12].
Image capture and analysis
Gels were scanned using a UMAX scanner (Amersham
Biosciences, Barcelona, Spain) and the images were ana-
lyzed with melanie version
5.0 software (GeneBio,
Geneva, Switzerland), including spot detection, quantifica-
tion, normalization, data analysis and statistics. Compara-
tive analysis of protein spots was performed by matching
corresponding spots across different gels. Each of the
matched protein spots was rechecked manually. Intensity
volumes of individual spots were normalized with the total
intensity volume of all spots present in each gel before per-
forming differential expression analysis. The Kolmogorov–
Smirnov test was used to assess the statistical significance
of the differences between the normalized intensity volumes
of individual spots of the control (Agxt
+ ⁄ +
) and those of
the hyperoxaluric (Agxt
) ⁄ )
) group. Only differentially
expressed proteins were excised and subjected to subsequent
identification by MS.
MALDI-TOF MS
Protein spots were manually excised from Coomassie-
stained gels, and tryptic in-gel digestion and desalting steps
were performed using 96-well ZipPlates (Millipore, Bedford,
MA, USA) according to the manufacturer’s instructions.
The resulting peptides were mixed with 1 lLofa-cyano-4-
hydroxycinnamic acid (1 mgÆmL
)1
) and spotted on Anchor-
chip plates as described by the manufacturer (Bruker
Daltonics, Bremen, Germany). Peptide mass fingerprint
spectra were measured on an Autoflex MALDI-TOF mass
spectrometer (Bruker-Daltonics) in a positive ion reflection
mode at an accelerating voltage of 20 kV, and spectra in
the 900–3200 Da range were recorded. For one main spec-
trum, 30 subspectra with 30 shots per subspectrum were
accumulated. A pepmix calibration kit (Bruker-Daltonics)
was used for calibration and the standard mass deviation
J. R. Herna
´
ndez-Fernaud and E. Salido Proteome changes in primary hyperoxaluria
FEBS Journal 277 (2010) 4766–4774 Journal compilation ª 2010 FEBS. No claim to original German government works 4773
was < 10 ppm. The peak lists were created with flex
analysis (v
2.4) software. The selected settings were as fol-
lows: SNAP peak detection algorithm; signal-to-noise ratio,
10; quality factor threshold, 30; maximal 100 peaks per
spot. The peptide mass fingerprints were rechecked manu-
ally. Peptide mass fingerprint data were submitted to the
MASCOT search engine for protein identification using the
Mascot database. The search parameters were set according
to the following criteria: Mus musculus for taxonomy; carb-
amidomethyl (C) for fixed modifications; oxidation (M) for
variable modifications; and ±100 ppm for peptide ion mass
tolerance.
Western blot
Subcellular fractions from six mice were obtained as
described above. Protein concentration was measured using
the Bradford method, and 50 lg of protein were analyzed
by immunoblotting [13] with anti-AGT affinity-purified rab-
bit serum, anti-carbonic anhydrase 3 (1:1000 dilution) goat
serum or anti-fructose-1,6-bisphosphatase (1:1000) rabbit
serum (Santa-Cruz Biotechnologies, Santa Cruz, CA,
USA), anti-enolase (1:1000 dilution) rabbit serum
(ABCAM, Cambridge, UK) and anti-catalase (1:5000 dilu-
tion) mouse IgG1 (Sigma-Aldrich, St Louis, MO, USA).
Peroxidase-conjugated anti-rabbit IgG, anti-mouse IgG or
anti-goat IgG (Jackson Immunoresearch, West Grove, PA,
USA) was used as secondary antibody and the chemilumi-
nescence substrate was obtained from Pierce (Rockford, IL,
USA). Controls to ensure that equal amounts of protein
were loaded per lane involved Coomassie staining of
parallel gels, and reprobing the membranes with mouse
anti-b-actin (1 : 10 000; Sigma) and rabbit anti-glyoxylate
reductase ⁄ hydroxypyruvate reductase (1 : 10 000, raised
against recombinant protein) antibodies. Inmunoreactive
specific bands were quantified using a UMAX scanner
(Amersham Biosciences) and melanie version
5.0 software
(GeneBio). The signal was normalized against each
group to obtain the protein changes as expression
ratios.
Acknowledgements
We are grateful to Cristina Paz for excellent technical
help. The study was supported by grant 2007-62343
(Spanish Ministry of Science).
References
1 Behnam JT, Williams EL, Brink S, Rumsby G &
Danpure CJ (2006) Reconstruction of human
hepatocyte glyoxylate metabolic pathways in stably
transformed Chinese-hamster ovary cells. Biochem J
394, 409–416.
2 Danpure CJ (2006) Primary hyperoxaluria type 1: AGT
mistargeting highlights the fundamental differences
between the peroxisomal and mitochondrial protein
import pathways. Biochim Biophys Acta 1763, 1776–1784.
3 Salido EC, Li XM, Lu Y, Wang X, Santana A,
Roy-Chowdhury N, Torres A, Shapiro LJ &
Roy-Chowdhury J (2006) Alanine-glyoxylate amino-
transferase-deficient mice, a model for primary
hyperoxaluria that responds to adenoviral gene transfer.
Proc Natl Acad Sci USA 103, 18249–18254.
4 Singh H, Beckman K & Poulos A (1994) Peroxisomal
beta-oxidation of branched chain fatty acids in rat liver.
Evidence that carnitine palmitoyltransferase I prevents
transport of branched chain fatty acids into mitochon-
dria. J Biol Chem 269, 9514–9520.
5 Li XM, Salido EC & Shapiro LJ (1999) The mouse
alanine:glyoxylate aminotransferase gene (Agxt1):
cloning, expression, and mapping to chromosome 1.
Somat Cell Mol Genet 25, 67–77.
6 Pilkis SJ & Granner DK (1992) Molecular physiology
of the regulation of hepatic gluconeogenesis and
glycolysis. Annu Rev Physiol 54, 885–909.
7 Noguchi T, Okuno E, Takada Y, Minatogawa Y,
Okai K & Kido R (1978) Characteristics of hepatic
alanine-glyoxylate aminotransferase in different
mammalian species. Biochem J 169, 113–122.
8 Baker PR, Cramer SD, Kennedy M, Assimos DG &
Holmes RP (2004) Glycolate and glyoxylate metabolism
in HepG2 cells. Am J Physiol Cell Physiol 287, C1359–
C1365.
9 Xue HH, Fujie M, Sakaguchi T, Oda T, Ogawa H,
Kneer NM, Lardy HA & Ichiyama A (1999) Flux of
the L-serine metabolism in rat liver. The predominant
contribution of serine dehydratase. J Biol Chem 274,
16020–16027.
10 Xue HH, Sakaguchi T, Fujie M, Ogawa H & Ichiyama
A (1999) Flux of the L-serine metabolism in rabbit,
human, and dog livers. Substantial contributions of
both mitochondrial and peroxisomal serine:pyru-
vate ⁄ alanine:glyoxylate aminotransferase. J Biol Chem
274, 16028–16033.
11 Neuhoff V, Arold N, Taube D & Ehrhardt W (1988)
Improved staining of proteins in polyacrylamide gels
including isoelectric focusing gels with clear background
at nanogram sensitivity using Coomassie Brilliant Blue
G-250 and R-250. Electrophoresis 9, 255–262.
12 Mortz E, Krogh TN, Vorum H & Gorg A (2001)
Improved silver staining protocols for high sensitivity
protein identification using matrix-assisted laser
desorption ⁄ ionization-time of flight analysis.
Proteomics 1, 1359–1363.
13 Sambrook J & Russell DW (2001) Molecular Cloning:
A Laboratory Manual. Cold Spring Harbor Laboratory
Press, Cold Spring Harbor, NY.
Proteome changes in primary hyperoxaluria J. R. Herna
´
ndez-Fernaud and E. Salido
4774 FEBS Journal 277 (2010) 4766–4774 Journal compilation ª 2010 FEBS. No claim to original German government works