THE PORT AUTHORITY OF NY & NJ pptx
Bạn đang xem bản rút gọn của tài liệu. Xem và tải ngay bản đầy đủ của tài liệu tại đây (2.57 MB, 55 trang )
v!
PORr
AUTlIORRY
OF
NY
& NJ
January
31,2012
The
Honorable
Chris
Christie
The
Honorable
Andrew
M.
Cuomo
Governor
Governor
State of
New
Jersey State of
New
York
State
House
State
Capitol
Trenton
, NJ 08625
Albany,
NY 12224
Dear
Governors:
In
response
to last
year
's toll
and
fare increase,
on
August
18, 2011, you
charged
the
Board of
Commissioners
of
the
Port
Authority
of
New
York
and
New
Jersey to
undertake
a
comprehensive
review
and
audit
of
the
entire
agency,
covering
its finances,
operations
,
and
ten-
year
Capital
Plan.
On
September
19
, 2011, a Special
Committee
of
the Board
was
organized
to
oversee
that
directive,
and
thereafter it
retained
the
international
firms of
Navigant
Consulting
,
Inc.
and
Rothschild
Inc. to assist
in
this effort.
We
present
herewith
the
Phase
I
Interim
Report.
It
is the Special
Committee's
intent
that
this Report
together
with
our
subsequent
final
report
will
present
a
thorough
assess
ment
of the
Port
Authority's
current
business
model
, finances,
and
operations
, as well as
provide
corrective
recommendations
and
measures.
The
findings
and
recommendations
of
the
Report
will be
presented
to the
Port
Authority's
Board for
consideration
and
appropriate
action.
We
note
that
the
Report
finds an "
organization
at
a
crossroads
"
and
indicates
that the
Port
Authority
needs
a
top-to-bottom
overhaul
of its
management
structure
.
Navigant's
preliminary
review
revealed
, in their assessment,
"a
challenged
and
dysfunctional
organization
suffering from a lack
of
consistent
leadership,
a siloed
underlying
bureaucracy
,
poorly
coordinated
capital
planning
processes, insufficient cost controls,
and
a lack of
transparent
and
effective
oversight
of
the
World
Trade
Center
program
that
has
obscured
full
awareness
of
billions of
dollars
in
exposure
to the
Port
Authority
."
As
can
be
seen
in the Report,
the
World
Trade
Center
redevelopment
costs
grew
from
an
estimate
of
approximately
$11 billion in 2008 to a
current
estimate
of
approximately
$14.8
billion,
with
the
estimated
net
cost to the
Port
Authority
after
third-party
reimbursements
growing
from
approximately
$6 billion to
appro
x
imately
$7.7 billion.
Given
that
enormous
burden
, we
are
committed
to
taking
the
steps
necessary
to
mitigate
the
Port
Authority
's
exposure
at
the
World
Trade
Center
site by:
•
Establishing
new
financial
and
management
controls
,
and
value
engineering
all
possible
aspects
of
the
World
Trade
Center
project.
This
crucial
step
should
help
225
Park Avenue South
New
York NY 70003
T:
272
435
7000
THE
PORT
AUlHORnY
OF
NY
&
NJ
Hon.
Chris
Christie
Hon.
Andrew
M.
Cuomo
- 2 -
January
31, 2012
limit or
mitigate
the
approximately
$1
billion of
potential
incremental cost
exposure
identified
in
the Report;
•
Maximizing
the recovery of costs
spent
on
behalf of
third-party
stakeholders
and
strictly limiting
any
new
financial
commitments
related to increased scope
and
third-party
work. As
noted
in the Report, the
Port
Authority
already
needs
to
recover
approximately
$1.6 billion from public agencies
and
private
entities,
such
as
the
National
September
11
Memorial
&
Museum;
•
Leveraging
private
sector expertise. The
Port
Authority
has
made
advances
in
this
direction
by
forming a joint
venture
with
the
Durst
Organization
on
Tower
1
and
actively
negotiating
a joint
venture
with
Westfield
on
the retail
components
of
the
World
Trade
Center
site. As
suggested
by
the
Report,
the
Port
Authority
underestimated
approximately
$1
billion of costs
that
were
subsequently
identified
by
the
involvement
of experienced,
private
partners. There
may
have
been
an
opportunity
to
mitigate
some
of these costs
had
they been identified
earlier;
and
•
Pursuing
the
feasibility of
third-party
capital
sources
to
fund
the commercial
aspects
of
the
site. Alternative
methods
of
funding
the
infrastructure
needs
of
the
Port
Authority
may
come
from
monetizing
certain assets
at
the
World
Trade
Center
site.
The
amount
of
debt
at
the
end
of 2001 ($9.1 billion)
grew
to $19.5 billion at
year-end
2011,
and
is
expected
to increase
further
to
approximately
$20.8 billion
by
the
end
of 2012. This
significant
increase
in
the
agency's
debt
load
will
remain
a
burden
for years to come.
Gross
compensation
at the
Port
Authority
has
grown
in
the
last five years by
approximately
19%,
from
$629 million to $749 million,
primarily
as the
result
of
"add-on"
compensation
such
as overtime,
unused
vacation
exchange
and
"longevity"
programs
.
During
this
same
timeframe, the cost of benefits for
employees
increased
by
approximately
35%, from
$341 million to
more
than
$458 million.
These
findings
underscore
the Special
Committee's
objective of finding
ways
of
lowering
operating
costs
and
increasing
operational
efficiencies across
the
agency. The Special
Committee
is
strongly
committed
to
bringing
employee
compensation
and
benefits in line
with
appropriate
public
employee
benchmarks
and
has
already
asked
our
executive
management
team
to
examine
the
following measures:
•
Requiring
contributions
to healthcare.
If
implemented
for all employees,
these
contributions
would
result
in expected
savings
of
approximately
$103.8 million
over
the
course
of the
next
four
years;
THE
PORT
AUTHORITY
OF
NY
&NJ
Hon.
Chris
Christie
Hon.
Andrew
M.
Cuomo
- 3 -
January
31, 2012
•
Eliminating
"add-on"
compensation
programs
,
such
as
unused
vacation
exchange
and
"longevity."
The
estimated
annual
savings
for
eliminating
these
programs
for
non-represented
employees
is
approximately
$9.1
million;
•
Implementing
a
merit
driven
compensation
program;
•
Imposing
sh
·
onger
controls
on
overtime
;
and
• Revising vacation
and
other
compensated
time policies.
Aside
from
these findings
and
recommendations,
the
Report
includes
preliminary
observations
on
the
Port
Authority's
current
$25.1 billion Capital
Plan
and
underlying
capital
planning
process.
The
majority of
that
capital,
more
than
$18 billion, is
planned
for assets
excluding
the
World
Trade
Center
site, reflecting significant state-of-good-repair
and
other
needs
of
our
core
transportation
assets. Yet the
Report
observes
that
the capital
planning
process
does
not
necessarily align
with
the
agency's
overall priorities. Line functions
promote
projects to
maintain
their
own
asset base,
while
management
roles
and
responsibility for
oversight of the
planning
and
project execution process are
not
clearly defined.
Furthermore,
senior
management
lacks key
performance
metrics to
drive
accountability for
the
execution of
the Capital Plan.
The
next
phase
of
the
Special
Committee's
work
will
further
the detailed
review
of the
hundreds
of projects in
the
Capital Plan.
However,
it
is clear
that
the
Port
Authority
must
refocus its
organization
and
processes to increase the
speed
of project delivery
and
reduce
project costs.
Already,
our
executive
management
team
is focusing
on
various
steps
to achieve
these goals,
including:
•
Streamlining
pre-construction
approval
processes;
•
Reducing
"soft
costs" associated
with
project
development;
•
Requiring
financial
department
review of all transactions before they are
brought
to
the
Board;
and
.
•
Improving
communications
internally to foster
better
collaboration
and
decision-
making
for critical projects.
These
important
steps, together
with
other
improvements
such
as
greater
use of
electronic
systems
to
improve
management
of
our
real estate
and
leaSing contracts,
and
improving
the
timely collection of
revenues
owed
to us, will
improve
the
value
to the agency,
and
to the public,
of
the
capital dollars
we
spend
.
The
above
findings, along
with
the others in
the
Report,
make
abundantly
clear
something
that
we
already
knew
:
we
must
now
move
to a
new
era for the
Port
Authority.
In
2011, the Board
had
already
begun
this process
by
implementing
significant changes to
THE
PORT
AUTHORITY
OF
NY
&
NJ
Hon.
Chris Christie
Hon.
Andrew
M.
Cuomo
- 4 -
January
31,2012
reinvigorate the
agency
. For example, in the
past
months
it
has
moved
forward
in
a proactive
way
with
positive
changes
in
governance
and
transparency
by:
•
Posting
online the
compensation
of all
employees
of the
Port
Authority
and
committing
the agency to
quarterly
updates;
•
Implementing
the elimination of the
non-revenue
component
of
the
Port
Authority's
E-ZPass
program
for certain
employees
and
retirees;
•
Hiring
the
first
new
independent
auditor
for the
agency
in
31
years;
•
Strengthening
the
Port
Authority's
internal
Enterprise Risk
Management
System
to
allow
the
Board to
better
anticipate
and
mitigate
potential
problems;
•
Establishing
an
Insurance
Working
Group
to
examine
the
Port
Authority's
insurance
practices
and
costs;
and
•
Approving
Preliminary
Operating
and
Capital
Budgets
for 2012 expressly subject
to
any
measures
adopted
by
the Board as a
result
of the Special
Committee's
reVIew.
Beyond
these
recent
steps
and
the
aforementioned
commitments,
much
more
needs
to
be
done.
The
Special
Committee's
continued
review will
serve
as the vehicle for this change,
and
as
we
move
into
Phase
II with
the
guidance
of
Navigant
and
Rothschild,
the
principal
objectives will
remain
the same: to
reduce
costs,
improve
efficiencies,
and
fulfill the
Port
Authority's
mission
as
the
engine
for economic
growth
and
job creation in the
New
York/New
Jersey region.
We
look
forward
to
your
continued
support.
Respectfully,
THE
SPECIAL COMMITTEE OF
THE
BOARD OF COMMISSIONERS
OF THE
PORT
AUTHORITY OF
NEW YORK
AND
NEW
JERSEY
David
Samson
Scott Rechler
Chairman
V
ice-Chairman
William
"Pat"
Schuber
Jeffrey Lynford
Commissioner
Commissioner
PhaseIInterimReport
Presentedto:
TheSpecialCommitteeoftheBoardofCommissionersof
January31,2012
Presentedby:
PhaseIInterimReporttotheSpecialCommitteeofthePortAuthorityofNewYorkandNewJersey
2
TableofContents
I. EXECUTIVESUMMARY 5
PRELIMINARYORGANIZATIONALDESIGN&OPERATIONALASSESSMENT 5
INITIALCOSTREVIEWOFWTCPROGRAM 6
PRELIMINARYCAPITALPLANNINGASSESSMENT 7
II. NATUREOFENGAGEMENT&SCOPE 7
III. GENERALAPPROACH 9
COMPENSATION&BENEFITSREVIEW 9
INITIALCOSTREVIEWOFTHEWTCPROGRAM 9
PRELIMINARYCAPITALPLANNINGASSESSMENT 9
IV. BACKGROUND 9
V. PORTAUTHORITYOVERVIEW 11
Observations&Findings 13
PreliminaryRecommendations&NextSteps 15
VI. PRELIMINARYGENERALORGANIZATIONALOBSERVATIONS 15
VII. PRELIMINARYCOMPENSATIONANDBENEFITSASSESSMENT 18
SCOPE 18
METHODOLOGY 18
PRELIMINARYGENERALOBSERVATIONS 19
EMPLOYEEHEADCOUNT 20
Observations&Findings 20
PreliminaryRecommendations&NextSteps 22
COMPENSATION 22
Observations&Findings 23
PreliminaryRecommendations&NextSteps 28
BENEFITS 29
Observations&Findings 30
PreliminaryRecommendations&NextSteps 34
REPRESENTEDEMPLOYEESCONTRACTCONSIDERATIONS 35
Observations&Findings 35
PreliminaryRecommendations&NextSteps 36
VIII. INITIALCOSTREVIEWOFWTCPROGRAM 36
BACKGROUND 36
SCOPE&METHODOLOGY 37
Observations&Findings 38
PreliminaryRecommendations&NextSteps 43
IX. PRELIMINARYCAPITALPLANNINGASSESSMENT 44
BACKGROUND 44
SCOPE&METHODOLOGY 44
Observations&Findings 44
PreliminaryRecommendations&NextSteps 45
X. OVERVIEWOFPHASEII 46
PHASEII–ORIGINALMANDATE 46
PhaseIInterimReporttotheSpecialCommitteeofthePortAuthorityofNewYorkandNewJersey
3
PHASEII–ADDITIONALRECOMMENDATIONS 46
XI. APPENDIX–A 48
XII. APPENDIX‐B 50
XIII. APPENDIX–C 51
Tables
Table1–PortAuthorityCoreFunctions 12
Table2‐Cumulat iveNetIncomebyLineDepartment(Inception–2010) 13
Table3–SummaryFinancialTrendsbyYear(2001–2011) 14
Table4–ExecutiveDirectorTenure 16
Table5–“Actual”vs.“Authorized”StaffingTrends(2006‐YTDNov2011) 21
Table6–TotalCompensationTrend(2006–2010) 22
Table7–TotalCompensation&BenefitsTrendperActiveEmployee(2006–2010) 23
Table8‐PortAuthorityBenchmarkingAmongPeers,Aviation 25
Table9‐PortAuthorityBenchmarkingAmongPeers,TB&T 25
Table10‐PortAuthorityBenchmarkingAmongPeers,PortCommerce 26
Table11‐PortAuthorityBenchmarkingAmongPeers,PATH 26
Table12–“Add‐on”CompensationforNon‐Represented&RepresentedEmployees(2010) 27
Table13–Existing“Add‐on”CompensationProgramsforNon‐RepresentedEmployees 27
Table14–TrendsinEmployeeBenefitExpenses(2006–2010) 29
Table15‐BreakoutofHealthBenefitExpensesbyEmployeeType(2010) 30
Table16–PortAuthorityHealthBenefitContributionvs.StatesofNYandNJ 31
Table17‐ExpectedSavingsfromHealthCareInitiatives 31
Table18‐PaidTimeOffandCash‐OutPoliciesofPortAuthorityvs.StatesofNY&NJ 33
Table19‐Top10OvertimeRecipients,PublicSafety(2010) 36
Table20‐PublicSafetyOvertime(2006–YTDNov2011) 36
Table21–PeriodicWTCEACComparison(Dec2006–CurrentEstimate) 37
Table22‐PeriodicWTCEACComparison(Dec2006–Nov2008) 39
Table23‐PeriodicWTCEACComparison(Nov2008–CurrentEstimate) 40
Table24–WTCCurrentEstimateandPotentialExposure 42
PhaseIInterimReporttotheSpecialCommitteeofthePortAuthorityofNewYorkandNewJersey
4
Figures
Figure1–PortAuthorityKeyHistoricalMilestones 13
Figure2–OperatingCashFlowAvailableforInvestmentinFacilities(2001–2010) 14
Figure3–StaffingAllocationTrend(2001–YTDNov2011) 21
Figure4‐AverageEmployeeBaseSalarybyPublicAgency&Authority(2010) 24
Figure5‐Top25EmployeesAverageBaseSalarybyPublicAuthorit y(2010) 24
Figure6–NumberofNon‐RepresentedEmployeesbyEmployeeGroup 28
Figure7–AverageCostofVacationDayExchange&BankingofDays,perEmployee(2006–2010) 32
PhaseIInterimReporttotheSpecialCommitteeofthePortAuthorityofNewYorkandNewJersey
5
I. EXECUTIVESUMMARY
The Port Authority of New York and New Jersey (the “Port Authority”) is a complex
organization, comprised of billions of dollars of vital infrastructure and transportation
operationsaswellassignificantrealestateholdings.NavigantConsulting,Inc.’s(“Navigant”)
preliminaryreviewrevealedachallengedanddysfunctionalorganizationsufferingfromalack
of
consistentleadership, asiloedunderlyingbureaucracy, poorlycoordinatedcapitalplanning
processes, insufficient cost controls, and a lack of transparent and effective oversight of the
World Trade Center (the “WTC”) program that has obscured full awareness of billions of
dollarsinexposuretothePortAuthority.
Theorganizationisata
crucialcrossroads.ThePortAuthoritymustre‐affirmitscoremission,
and support it with a viable long range strategic and capital plan and an organization with
renewed focus on operating efficiency and effectiveness, in order to sustain its relevance as a
primary contributor to the economic growth of the region
in the 21st Century.A significant
undertaking will be required including both organizational and financial realignments to
properly position the agency to address the challenges inherited by the recently appointed
leadership.The following represents certain preliminary findings associated with the Phase I
report commissioned by the Special Committee of the
Board of Commissioners of the Port
AuthorityattherequestoftheGovernorsofNewYorkandNewJersey.
PRELIMINARYORGANIZATIONALDESIGN&OPERATIONALASSESSMENT
ThePortAuthoritymustconductameaningfultop‐to‐bottomorganizationalredesign
focusedonoperatingefficienciesandrootedinclearlydefinedrolesandresponsibilities,
transparency,accountability,andalignedincentives
ThePortAuthorityisalongstandingbureaucracythatisinherentlyresistanttochange,
lackseffectivecollaborationbetweenitsstrategic
businesses,andwouldbenefitfromthe
effectivedevelopmentofasharedsupportservicesfunction.
Promotionwithintheorganizationisprimarilybasedonseniority,withlittleevidenceof
advancementorcompensation beingtiedtoperformance.Asaresult,theorganization
hasaconcentrationoflongtenuredseniorandmiddlemanagement
employees.
Themagnitudeofgrowthinsizeandcostofthesecurityapparatus warrantsanindepth
reviewofitsefficiencyandrelativeeffectiveness,asiscurrently beingconducted.
Overtime and otherformsof“add‐on” compensation resultedinanadditional $20,559
peremployeein2010.Overtimeexpensesalone
topped$85millionin2010.
Total “add‐on” compensation, when combined with all other benefits, results in
incrementalaveragecostperemployeeequivalenttoapproximately70%ofbasesalary,
arelativelyhighfringebenefitrate.
93%ofemployees makenocontribution totheir healthcare;bycontrast, 100%
of New
YorkStateandNewJerseyStateemployeescontributetohealthcare.
TotalcostofcompensationandbenefitsfortheaverageactivePortAuthorityemployee
isestimatedtoexceed$143,000annually.
PhaseIInterimReporttotheSpecialCommitteeofthePortAuthorityofNewYorkandNewJersey
6
In addition to the scrutiny and curtailment of rapidly growingʺadd‐onʺ compensation
and benefit costs, represented labor contracts (and the current application of related
practices)meritadetailedreviewwithconsiderationofpotentialmodificationstowork
rulestoremoveimpedimentstoproductivityandefficiencygains.
INITIALCOSTREVIEWOFWTCPROGRAM
WTC costshavegrown significantly and gross costs will likely exceedapproximately
$14.8 billion, an increase of $3.8 billion since the last forecast in 2008.The Port
Authority’s net funding obligation has grown from app roximately $6.0 billion to
approximately $7.7 billion, before consideration of additional potential net cost
exposuresof
approximately$800million
ThePort Authoritywasunable toproducesupportingdetailandsource documentsfor
the growth in cost estimates previously repor ted by prior Executive Directors to the
Board of Commissioners and the Governors.Moreover, prior budgets for the WTC
projectdidnotincludeestimatedtenantimprovementand
leasingcostsassociatedwith
the commercial (i.e., at One World Trade Center) and retail space at the WTC, thus
understatingtheexpectedcostatcompletion.
Total project costs have grown significantly from a previously reported $11 billion to
approximately$14.8billion,a $3.8billion increase sincethe 2008reforecast.
Moreover,
Navigant hasidentified additionalpotential exposures ofapproximately $1 billionthat
must be mitigated by the Port Authority to avoid further escalation in gross program
costs.
Thegrosscostincreaseofapproximately$3.8billionisprimarilydrivenby:(i)thescope
evolutionoftheWTC TransportationHub(“Hub”) in
response tothemandatetoopen
the National September 11 Memorial and Museum (the “Memorial”) by September 11,
2011, (ii) anticipated allowances to commercialize One World Trade Center (“1 WTC”)
and the retail spaces, (iii) projects performed by the Port Authority on behalf of third‐
partiesatthesite (i.e.,
relatedtotheMemorial,existingsubwayoperations,thecampus
securityplan,andthePerformingArtsCenter),aswellas,(iv)increasesinfinancingand
insuranceexpenses.
Exposure to third‐parties (where the Port Authority has performed work for other
parties and expects to be reimbursed in the future) now
total an estimated $1.6 billion
and represent the primary area of cost escalation since the 2008 reforecast.The most
notable exposures are seen in: (i) the proposed Memorial project (which, by some
estimates, has grown to a total project cost of approximately $1 billion), (ii) the $300
million campus security plan
developed by the City of New York, and (iii) the $200
millionofworkrequiredtophysicallysupporttheanticipatedPerformingArtsCenterat
thesite.Assuringthecollectabilityof thesefunds, particularlyininstancessuchasthe
Memorialwherefundingobligationsarealreadyindispute,mustbeakey
priorityofthe
Port Authority.In the face of uncertainty of collections, the Port Authority should
enforcestrictcontrolsandcurtaildevelopmentofnon‐essentialthirdpartyrequests.
PhaseIInterimReporttotheSpecialCommitteeofthePortAuthorityofNewYorkandNewJersey
7
The Port Authority has significant, additional, potential cost risks (i.e., above the $800
millionidentifiedintheNavigantreport)relatingtocontingentfinancingcommitments
associatedwithotherWTCprojects.
The Port Authority must implement enhanced transparency and accountability
protocolstoensuretheWTCredevelopmentiscompletedwithoutfurther
costoverruns.
Roles, responsibilities, and oversight need to be re‐evaluated as the WTC program
evolvesfromconstructionexecutiontothatofanoperatingassetoftheagency.
TheposttraumaticeffectfromSeptember11,includingthelossof84employees,cannot
be underestimated.Nonetheless, in the face of this
tragedy long‐tenured, dedicated,
career service professionals provided interim stability.However, in the course of the
nextdecadethePortAuthorityhasbeenconsumedwiththeadditionalresponsibilityfor
therebuildingoftheWTC.The openingof theMemorialrepresentsanopportunity to
restorethePortAuthority’sfocusonits
primarymission.
PRELIMINARYCAPITALPLANNINGASSESSMENT
ThePortAuthorityneedstoalignitscapitalstrategywithitsmissionandobjectives
Exposure to debt has more than doubled over the past ten years, from approximately
$9.1 billion in 2001 to approximately $19.5 billion at the end of 2011, and future cash
flowfromoperationsaloneis
notsufficienttofunditsongoingcapitalprojects.
The Port Authority has expanded beyond its stated mission as a transportation
infrastructure organization and, by fate or design, has also become a major real estate
developer and asset owner with investments that dwarf its past holdings.The Port
Authoritymust
structureitsorganization,useits internalresources,and,asappropriate,
useitsprivatesectorprowess.
The capital planning and execution function lacks a clear leader, does not have
consistent reporting mechanisms, and fails to effectively address the challenges facing
the Port Authority.There is a lack of proper accountability for
development,
construction and asset management to the Executive Director.A full review of
organizationaldesignofcapitalplanningandimplementationiswarranted.
II. NATUREOFENGAGEMENT&SCOPE
InAugust2011,inresponsetoaPortAuthorityrequested,andsubsequentlyapproved,tolland
fareincreaseforitsbridgesandtunnels,andthePATHsystem,theGovernorsofNewYorkand
New Jersey requested a comprehensive review of the Port Authority.Consequently, in
September 2011, the Port Authority established a
Special Committee of the Board of
Commissioners (the “Special Committee”) to retain independent consultants and advisors to
conduct a full review of the Port Authority’s past and current governance, and management
practices(the“Review”).PursuanttoanagreementdatedasofNo vember23,2011,theSpecial
Committee retainedNavigantto
assist thePortAuthority inreadying therequirementsofthe
Review.ThebroadscopeoftheReviewistoincludebutisnotlimitedtothefollowing:
PhaseIInterimReporttotheSpecialCommitteeofthePortAuthorityofNewYorkandNewJersey
8
A comprehensive analysis of the Port Authority’s ten‐year capital plan (the “2011
Capital Plan”), in an effort to reduce the size and cost of non‐revenue producing
projects, reprioritizing existing projects and establishing new priorities, and the most
effectivewaytofinancethesame;
A thorough review of
the Port Authority’s capital projects and spending over the past
ten years to determine the causes and full extent of, as well as potential remedies to
address,costescalationsofthePortAuthority’sprojects,withafocusontheWTCsite;
A top‐to‐bottom review of the Port
Authority’s organizational structure and
effectiveness, staffing levels, compensation, benefits, and financial management,
including accounting, audit, financing, consulting and other contractual practices and
agreements, all done to further lower costs and increase efficiencies within the Port
Authority;and
Establishment of a Project Management Office (“PMO”) to coordinate activities
associatedwiththe
Review.
In addition to Navigant, the Port Authority also engaged Rothschild, Inc. (“Rothschild”) to
assist in meeting the requirements of the Review.Rothschild’s focus is to advise the Port
Authorityonevaluatingeffectivefinancingstrategiesoftheexistingandnewcapitalpriorities.
Navigant’sengagementisdividedintotwophases(“Phase
I”and“PhaseII”).
PursuanttotheengagementtermswiththePortAuthor ity,thescopeofPhaseIconsistsofthe
following:
EstablishmentandstaffingofaPMOwhichwouldcoordin ateactivitieswithregardsto
Navigant’sscopeofworkinPhaseI(aswellasoversi ght,coordination,assimilationand
integration
ofrelatedworkstreamsperformedbythirdparties);
Preliminary organizational design and operational assessment focused on a review of
compensationandbenefitcoststructures;
WTCcostreviewinconsultationwiththeSpecialCommittee;and
InitiationofcapitalprojectsassessmentinconsultationwiththeSpecialCommittee.
Pursuantto
theengagementtermswiththePortAuthority,thescopeofPhaseIIofNavigant’s
engagementwillincludethefollowing:
PMOActivities–Directoversight,coordination,assimilationandintegrationofPhaseII
activitiesfrombothNavigantandthirdpartyconsultantsoradvisorsasappropriate;
Organizational and operational assessment of the
Port Authority for focus areas
identifiedinconsultationwiththeSpec ialCommittee;and
CompletionofcapitalprojectsreviewinconsultationwiththeSpecialCommittee.
ThepurposeofthisreportistodeliverNavigant’sinterimfindingsandrecommendationswith
regardstothethreeidentifiedworkstreamsinPhaseI,subject
tothequalificationsofAppendix
–C.FurtherdetailsontheanticipatedPhaseIIscopeofworkcanbefoundinSectionX.
PhaseIInterimReporttotheSpecialCommitteeofthePortAuthorityofNewYorkandNewJersey
9
III. GENERALAPPROACH
NavigantconductedaninitialmeetingwiththeSpecialCommitteeandselectmembersofPort
Authority management in early December 2011.At that time, an information request was
submittedtothe PortAuthority addressingthespecific areasidentified forfocus inPhaseI as
wellasprovidingadditionalinformationthatwillbe
usefulinPhaseII.Todate,Naviganthas
reviewednumerousdocumentsfromthePortAuthority.Inaddition,Naviganthasconducted
many meetings and interviews with all levels of Port Authority employees as well as certain
membersoftheBoardofCommissionersandtheSpecialCommittee.
COMPENSATION&BENEFITSREVIEW
NavigantconductedinitialmeetingswiththePortAuthority’sChiefAdministrativeOfficerand
HumanResourcedepartments.Subsequenttothemeetings,informationrequestsweresentin
order to facilitate the review of key documents and other pertinent information.Navigant
reviewed multiple documents, conducted numerous in person and telephonic interviews as
wellasperformed
detailedanalysesofbasepay,overtime,“add‐on”compensation,healthcare
costs,andotherbenefit analyses.Thefindingsoftheseanalyseswereusedinabenchmarking
reviewusingselectedpublicandprivate peergroups.
INITIALCOSTREVIEWOFTHEWTCPROGRAM
Navigant reconstructed the historical costs of the WTC program using the chronology of
periodic Port Authority presentations by prior Executive Directors and management to the
Board of Commissioners, project cost reports current as of October 2 011, related documents,
and the findings of interviews to provide the Special Committee with the analysis
of past
spending at the WTC site. Furthermore, Navigant preliminarily and independently analyzed
thePortAuthority’sestimatedcosttocompleteforitsreasonableness.
PRELIMINARYCAPITALPLANNINGASSESSMENT
Navigant conducted meetings with key Port Authority staff involved in capital planning and
began preliminaryanalysis of itsorganizationand processes.In addition, Navigantcompiled
various reports of the Port Authority into a single database that allowed for analysis of the
composition ofthe 2011Capital Plan.Navigantalso reviewedthe
projectsin the2011 Capital
Planbyclassification,tobetterunderstandtheamount,maturityandpriorityoftheportfolioof
capitalprojects.
IV. BACKGROUND
The Port Authority has endured significant adversity over the last 20 years.From the WTC
bombinginFebruary19 93 totheSeptember11terroristattacks, thePortAuthorityhasalways
respondedswiftly.Afterthe February 1993bombing, thePortAuthority restoredthe WTCto
full function within a remarkable two month
time span.However, the devastation and
destructionoftheSeptember11attackswereunprecedented.ThelossoflifeincludedthePort
PhaseIInterimReporttotheSpecialCommitteeofthePortAuthorityofNewYorkandNewJersey
10
Authority’s ExecutiveDirectorand 83of itsemployees,causing asignificant emotionaltoll on
thepsycheoftheorganization.TheeventsofSeptember11becameapatrioticrallyingpointto
demonstrate to the world that New York, the nation’s largest city and heart of its financial
sector, could respond and rebuild
in the face of this adversity, in defiance of the intended
intimidationandthreatbytheterroristculprits.
The Port Authority accepted the monumental and crucial responsibility of what has now
becomethesymbolofthecountry’sresolve–torebuildtheWTC.TheeventsofSeptember11
placedan
unexpectedandtremendousburdenonthePortAuthority,consumingconsiderable
resources andattention in supportofthe redevelopment efforts.Thedistortiveimpact ofthis
event hascreated arippleeffectthat has been feltthroughoutthe organizationadecadelater,
including tumultuous changes in its leadership, intensive focus, and dedication to
one of the
largestinfrastructureanddevelopmentprojectsinthecountry,aswellasextraordinarygrowth
ofitssecurityapparatus.
Consequently,asthescopeanddesignoftheWTChaveevolved,particularlyinresponsetothe
national symbolic objectives and security concerns that have permeated the development, the
required costs
of rebuilding havecorrespondinglyexpanded.The objective of completingthe
Memorialby theten‐year anniversaryof September11 becameapublicmandateto reflectthe
profoundnationalsymbolismoftheWTC’stimelyresurrection.Tomeetthistimeline,thePort
Authority had to incur significant costs related to the acceleration of
the WTC construction
program.The level of dedication by the Port Authority, from daily involvement of certain
members of its Board of Commissioners, to on site construction personnel, has been
unwavering.By the time of its completion, in addition to third party funding, the Port
Authoritywilllikelyspendover
$7.7billiondollarsofitsowncapitalinthishistoricendeavor.
The recent opening of the Memorial on September 11, 2011 marked the end of an
extraordinarilydifficultdecadefortheagencyandthebeginningofanewchapterinitshistory.
GiventhestrongleadershipevidencedbythecurrentGovernors
ofNewYorkandNewJersey,
and their appropriate and intense focus on responsible government, increased transparency,
organizational efficiency and fiscal responsibility, the Port Authority now has a window of
opportunitytodrivethetransformationalchangesfundamentaltoaddressingthechallengesof
the organization.Withthe relatively recent appointmentsof
a newChairman, Vice‐Chairman,
several Commissioners,ExecutiveDirector andDeputyExecutive Director, the Port Authority
hasareinvigoratedfocus.
The organization’s new leadership appears intent on driving the change necessary to best
positionthePortAuthoritytomeetthechallengesofthe21stCenturyandtoprogressfromits
“business
as usual” approach.Amajor theme in this endeavor is increased transparencyand
accountability throughout the organization.This is evident by the recent initiatives already
undertaken by the Board of Commissioners, under the leadership of the new Chairman,
includingbutnotlimitedto:
Appointmentofnew,independentauditors;
Focusonimprovementsinthecapitalplanningandprojectmanagementprocesses;
PhaseIInterimReporttotheSpecialCommitteeofthePortAuthorityofNewYorkandNewJersey
11
Strengthening of the Port Authority’s internal Enterprise Risk Management System,
permitting early intervention by the Board of Commissioners through proactive issue
identification;
Reviewofpoliciesandproceduresinordertoaddressgrowingovertimeexpenditures;
Pursuit of benefit program reform including health care contributions, vacation
exchangeandpensiondesign;
Demonstrationofitscommitmenttofulltransparencythroughtheinitiationofcomplete
disclosureoncompensationofallemployees;
Creation of an insurance working group to better analyze and improve upon the Port
Authority’scurrentriskmanagementpolicies;
Fully embracing the top‐to‐bottom organizationalreviewbeingfacilitated
by Navigant
and Rothschild in pursuit of actionable interventions to drive operating and capital
deployment efficiencies and developing ways to enhance the financing of its 2011
CapitalPlan;and
Approving preliminaryoperating andcapital budgetsfor2012expresslysubjectto any
measuresadoptedbytheBoardofCommissionersasa
resultoftheSpecialCommittee’s
review.
ThisinterimreportisbeingissuedinresponsetolimitedareasofinitialinquirythattheSpecial
CommitteeoftheBoardofCommissionershasmandated.
V. PORTAUTHORITYOVERVIEW
ThePortAuthorityisacomplexorganization,nowemployingover6,900peopleandgenerating
revenuesofalmost$4billion.ThePortAuthority’scurrentmissionisdefinedasfollows:
“Toidentifyandmeetthecriticaltransportationinfrastructureneedsofthebi‐stateregion’sbusinesses,
residents, and visitors; providing the highest quality, most
efficient transportation, and port commerce
facilities and services that move people and goods within the region, providing access to the rest of the
nationandtotheworld,whilestrengtheningtheeconomiccompetitivenessoftheNewYork‐NewJersey
MetropolitanRegion”.
ThePortAuthorityhasavastarrayofasset
holdingssegmentedintoaviation,portcommerce,
PATH (i.e., rail transit), tunnels / bridges / terminals, the WTC, and various real estate
developmentassetsasidentifiedinTable1.
PhaseIInterimReporttotheSpecialCommitteeofthePortAuthorityofNewYorkandNewJersey
12
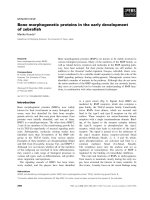
Table1–PortAuthorityCoreFunctions
Inadditiontoitsresponsibilitiesrel a tedtotwotunnels,fourbridges,fiveairports,sixseaports,
andthePATHsystemthePortAuthoritycurrently:
Managesover1millionsquarefeetofleasedspacein11facilities;
Managesa100‐acrehigh‐tech
businessparkinStatenIsland;
Ownsmultipleindustrialparks;
Ownsandservesasdeveloperoftwolargewaterfrontprojects;and
OwnsEssexCountyResourceRecovery(NJ’slargestwaste‐to‐energyfacility).
CORE FUNCTIONS: KEY FACILITIES:
AVIATION
• Manages & operates NY / NJ airports • JFK Airport
• Manages related security apparatus • LaGuardia Airport
• Manages operation & maintenance contracts for JFK & EWR • Newark Airport
• Manages parking contracts • Stew art Airport
• Manages utility and energy contracts • Teterboro Airport
• Develops & maintains passenger terminals
• Maintains runw ay infrastructure
PORT COM M ERCE
• Handles leasing & lease administration • Howland Hook Marine Terminal / Port Ivory
• Manages related security apparatus • Brooklyn Port / Red Hook
• Planning & development alternatives for land use • Port New ark
• Oversees capital programs including w aterw ay development • Port Elizabeth
• Manages NY Greenville Cross Harbor Rail Freight Program • Port Jersey
• Manages development of new MOTBY • Greenville Yard
PATH
• Manages 24/7 operation of trains, passenger services and rail yards
NY Stations
NJ Stations
• Manages related security apparatus • 9th Street • Exchange Place
• Manages all of PATH assets & infrastructure including railcar fleet, pow er, signals & commuter services • 14th Street • Grove Street
• Delivery of capital program • 23rd Street • Harrison
• Safety & Security program management • 33rd Street • Hoboken
• Manages all revenue programs (e.g. ,fare collection, & vendor contracts) • Christopher Street • Journal Square
• WTC
TUNNELS, BRIDGES AND TERMINALS
• Operates all Port Authority tunnels, bridges & terminals • Holland Tunnel
• Manages related security apparatus • Lincoln Tunnel
• Traffic management of all vehicular crossings, bus terminals and pedestrian flow s • George Washington Bridge
• Emergency response at all tunnels, bridges & terminal assets • Bayonne Bridge
• Manages and staffs cash toll collection booths and all electronic payment systems • Goethals Bridge
• Maintenance of all TB&T infrastructure • Outerbridge Crossing
• Delivery of capital program • Port Authority Bus Terminal
• George Washington Bus Station
WORLD TRADE CENTER
• • 1 World Trade Center
• HUB
• Manages security apparatus • 9/11 Memorial & Museum
• Manages retail and tenant leasing of 1 WTC • Central Chiller Plant
• Design & construction of WTC transportation HUB
• 1 WTC Construction
• Vehicular Security Center
• Common Site infrastructure
• Construction of September 11 memorial
• Coordinate the design and construction of SPI tow ers 2,3 & 4
• Performing Arts Center ("PAC")
REAL ESTATE DEVELOPMENT
• Leases & manages over 1.1 million sq ft in NY & NJ • Newark Legal & Communication Center
• Significant real estate ow ner and developer • Teleport
• • Essex County Resource Recovery Facility
• Bathgate Industrial Park
• • Industrial Park at Elizabeth
• Port Authority Bus Terminal Air Rights
• Moynihan Station
Works w ith state development agencies in bringing underutilized development industrial sites to shovel
ready status
Development, design, construction & coordination of WTC site in accordance w ith myriad of development
agreements & stakeholders (MTA, NYSDOT, Silverstein Entities & Affiliates, Memorial, etc.)
Once online, the Port Authority will manage leasable space of approximately 3 million square feet as well
as 0.5 million square feet of retail space at the WTC
PhaseIInterimReporttotheSpecialCommitteeofthePortAuthorityofNewYorkandNewJersey
13
Once online,the Port Authoritywill manageleasable spaceof approximately 3million square
feetaswellas0.5millionsquarefeetofretailspaceattheWTC.
Observations&Findin g s
ThePortAuthorityinfrastructurecontinuestoageanddeteriorate
The Trans‐Hudsonbridges and tunnelswerebuiltover 70
yearsago.While manyfacilitiesat
the airports and ports were constructed more recently, much of that infrastructure also dates
backhalfacenturyormore(Figure1).Goingforward,thePortAuthorityfacilities willrequire
significantcapitalinvestmenttomaintain,secure,andenhanceitsassets.
Figure1–
PortAuthorityKeyHistoricalMilestones
Overthenexttenyears,thePortAuthorityhasbudgetedapproximately$25.1billionforcapital
spending.Of this amount, approximately $15 billion has been earmarked for state of good
repair,security,mandatorycapitalexpendituresandsystemenhancementprojects.
Historically, revenue and operating cash flow has
been primarily generated by Port
Authoritytunnels,bridges,andairports
When investments in facilities are taken into consideration, PATH, Ferry Services, and Port
Commercehaverequiredsignificantallocations offunds(Table2).
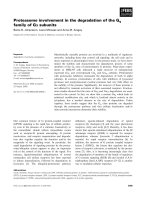
Table2‐CumulativeNetIncomebyLineDepartment(Inception–2010)
Notes:
1) FinancialsareprovidedfromthedateaparticularPortAuthorityassetstartedtogeneratefinancialresult.
2) PassengerFacilityCharges(ʺPFCsʺ)wereestablishedin1992andaccountforthevastmajorityofPFCs,Grants&Other.
3) OperatingCashFlow(“OCF”)reflectsNetIncome/(Loss)plus
D&A,NetInterestExpense,andexcludesPFCs,Grants&Other,which
aregenerallynotconsideredoperatinginnature.
50 YEARS
Port Authority
Founded
1921
Goethals
Bridge
1928
Port Authority
Founded
1921
Holland Tunnel
1927
George
Washington
Bridge
1931
Lincoln Tunnel
1937
Lincoln
Tunnel
1937
Newark
Airport
1947
LaGuardia
Airport
1947
JFK
Airport
1948
Port
Authority
Bus Terminal
1950
Port
Elizabeth
1962
World
Trade
Center
1970
Exchange Place
& WTC PATH
Reopened
2003
9/11
Memorial
2011
2011
Port Authority
90th
Anniverary
Brooklyn
Marine
Terminal
1981
Essex County
Resource
Center
1990
2001
9/11
Terrorist
Attacks
2006
NewWTC
Construction
MOTBY
2010
1993
WTCTerrorist
Bombing
($mm)
Invested in
Facilities
Gross
Operating
Re ve nues
Operating
Expenses
Allocated
Expenses D&A
Net Interest
Expense
PFCs,
Grants
& Other
2
Ne t
Income /
(Loss)
Operating
Cash Flow
("OCF")
3
OCF less
Invested in
Facilities
Inception - 2010
1
:
Tunnels, Bridges & Terminals 4,544.5$ 19,126.8$ 8,672.5$ 1,650.6$ 1,917.1$ 1,337.6$ (77.4)$
5,626.6$
8,803.8$ 4,259.3$
PATH 5,493.4 2,250.9 5,154.9 902.0 1,611.0 812.1 (1,179.0)
(5,050.1)
(3,806.0) (9,299.4)
Ferry Service 134.9 1.8 44.6 2.4 10.4 13.0 (3.7)
(64.9)
(45.2) (180.1)
Access to Regions Core ("ARC") 131.7 - 79.4 - 2.5 2.8 -
(84.7)
(79.4) (211.1)
Air Terminals 13,400.7 37,243.6 22,077.3 1,907.7 5,815.5 2,231.4 (3,187.8)
8,399.6
13,258.7 (142.0)
Port Commerce 3,617.1 4,176.0 2,574.2 217.5 1,438.3 780.4 (35.7)
(798.7)
1,384.3 (2,232.7)
Economic / Waterfront Development 480.2 1,912.1 1,689.7 25.1 269.0 25.4 (2.4)
(94.7)
197.3 (282.9)
World Trade Center 3,601.5 7,193.0 4,010.6 299.7 749.2 711.9 (1,122.9)
2,544.6
2,882.7 (718.8)
PA Insurance Captive Entity - 0.6 8.6 - - (11.1) -
3.1
(8.0) (8.0)
Regional Development Programs 1,322.9 - 129.3 - 1,068.4 658.4 -
(1,856.0)
(129.3) (1,452.1)
Other 1,477.1 2,062.3 497.8 - - 1.3 -
1,563.1
1,564.5 87.4
Total 34,204.0$ 73,967.2$ 44,938.7$ 5,004.9$ 12,881.4$ 6,563.1$ (5,608.9)$ 10,187.9$ 24,023.5$ (10,180.6)$
PhaseIInterimReporttotheSpecialCommitteeofthePortAuthorityofNewYorkandNewJersey
14
During the last ten years, Port Authority cash flows were insufficient to fund the
capitalexpenditureprogram
In the last ten years, the total outstanding debt of the Port Authority has increased from
approximately$9.1billionin2001toapproximately $19.5billionasofDecember2011,mainlyin
supportof
thecapitalprogram(Table3andFigure2).
Table3–SummaryFinancialTrendsbyYear(2001–2011)
Notes:
1) AsignificantportionofinvestmentsinfacilitiesisattributabletotheWTC.
2) PassengerFacilityCharges(ʺPFCsʺ)wereestablishedin1992andaccountforthevastmajorityofPFCs,Grants&Other.
3) OperatingCashFlow(“OCF”)reflectsNetIncome/(Loss)plusD&A,NetInterestExpense
andexcludesPFCs,Grants&Other,which
aregenerallynotconsideredoperatinginnature.
Figure2–OperatingCashFlowAvailableforInvestmentinFacilities(2001–2010)
While future operating cash flow is expected to be bolstered by revenue increases
primarilyfromscheduledfares,feesandtollincreasesfromtunnels,bridgesandPATH,
continuedaccesstocapitalmarketswilllikelyberequired
Overthe nexttenyears, thePort Authority isprojecting NetOperatingRevenues (i.e.,defined
by the Port Authority as gross operating revenues minus operating expenses), to grow from
approximately$1.2billionin2011toapproximately$3.0billionin2020,acompoundedannual
growthrateofapproximately9.3%.Furthermore,the
PortAuthorityisprojectinganoperating
($mm)
Invested in
Facilities
1
Gross
Operating
Revenues
Operating
Expenses
Allocated
Expenses D&A
Net Interest
Expense
PFCs,
Grants
& Other
2
Ne t
Income /
(Loss)
Operating
Cash Flow
("OCF")
3
OCF less
Invested in
Facilities
Total YE
Outstanding
De bt
Fiscal Year
:
FY 2001 311.4$ 2,742.9$ 1,894.4$ 149.8$ 442.8$ 193.7$ (153.6)$
215.8$
698.7$ 387.3$ 9,059$
FY 2002 1,522.7 3,258.0 1,839.1 159.9 435.2 238.9 (155.1)
740.0
1,259.1 (263.7) 9,335
FY 2003 1,918.5 3,446.3 1,788.2 149.1 521.1 277.8 (172.9)
883.0
1,509.0 (409.5) 9,756
FY 2004 1,275.2 2,864.8 1,846.4 139.9 614.2 332.8 (220.1)
151.5
878.5 (396.8) 10,961
FY 2005 1,237.6 3,000.7 1,952.3 139.0 686.7 316.8 (256.0)
161.9
909.4 (328.1) 10,984
FY 2006 1,589.3 3,038.5 1,974.7 140.0 724.3 319.9 (639.0)
518.6
923.8 (665.5) 12,330
FY 2007 2,272.9 3,191.6 2,071.5 180.4 691.9 246.9 (1,301.9)
1,302.9
939.7 (1,333.3) 12,751
FY 2008 2,375.2 3,987.4 2,282.4
183.2 715.5 496.6 (584.3)
894.1
1,521.8 (853.4) 13,037
FY 2009 2,621.5 3,771.9 2,253.3 202.1 786.9 329.3 (646.1)
846.4
1,316.6 (1,305.0) 14,450
FY 2010 2,966.0 3,689.7 2,411.1 190.0 865.5 499.3 (623.2)
346.8
1,088.5 (1,877.5) 16,309
FY 2011E 3,110.0 3,815.3 2,377.1 210.6 944.1 208.7 (654.1)
728.9
1,227.6 (1,882.4) 19,502
Total 21,200.3$ 36,807.0$ 22,690.6$ 1,843.9$ 7,428.2$ 3,460.7$ (5,406.3)$ 6,790.0$ 12,272.5$ (8,927.8)$ 19,502.1$
-
500
1,000
1,500
2,000
2,500
3,000
3,500
FY 2001 FY 2002 FY 2003 FY 2004 FY 2005 FY 2006 FY 2007 FY 2008 FY 2009 FY 2010 FY 2011
InvestmentinFacilities OperatingCashFlow
Gap funded by
capital markets
access & other
sources
PhaseIInterimReporttotheSpecialCommitteeofthePortAuthorityofNewYorkandNewJersey
15
margin improvement of approximately 50% over the same period, driven mainly from
scheduledfareandtollincreasesin2014andsomemodestgrowthinfacilitytraffic.However,
given the ca pital program currently presented by the Port Authority, continued borrowing in
thecapitalmarketsisexpectedtoberequired,withoutstandingindebtedness
forecastedtorise
from$19.5billionin2011to$25.2billionby2020.
PreliminaryRecommendations&NextSteps
Detailedcontributionanalysesforrevenueandnon‐revenueproducingprojectsneedto
be conducted on all Port Authority business segments to determine potential revenue
enhancementsandcostsavingsinitiativestoimprove
cashflow.
Thelongrangeforecastmodelassumptions shouldbe reviewedandanalyzed tobetter
understandthevalidityofassumptionssupportingexpectedmarginimprovementover
thenexttenyears.
Sensitivity analysesshouldbecond ucted around “bestcase”,“worst case”,and“likely
case”scenariosfortheentireportfolioof
projectstounderstandrelatedfinancialimpacts
of the 2011 Capital Plan, once finalized by the Special Committee and Board of
Commissioners.
The Port Authority should develop a comprehensive analysis of state of good repair
(“SGR”) projects to understand capital requirements for transportation infrastructure
integrity.
Return on asset and/or return
on invested capital concepts should be considered in
evaluatingfeasibilityoffuturecap italprojects,aswellastheallocationofcapitalacross
thevariousoperatingsegments.
VI. PRELIMINARYGENERALORGANIZATIONALOBSERVATIONS
Whilethecompletionofacomprehensivereviewoforganizationaldesignandeffectivenesswill
beaddressedinPhaseII,thefollowingpreliminaryobservationsarewarranted:
The Port Authority has expanded its areas of involvement in support of economic
developmentoverthelastseveraldecades,which continuestoevolve
While the Port
Authority’s tunnels, bridges, and airports continue to contribute the vast
majority of cash flow within the organization, over recent decades the Port Authority has
become a significant real estate developer and asset manager with its own expansive security
force, a posture that warrants further evaluation as the demands of the
WTC development
approaches conclusion.For example, the Port Authority is also the owner of a resource
recoveryfacility,whichconvertswastetoenergy.Furthermore,inlargepartasareactiontothe
WTC bombing in February 1993, and the events of September 11, the Port Authority has
assembled a sizeable security
ap paratus including a police force numbering over 1,700
employees.
As the Port Authority moves into the 21
st
century, it is imperative to assure alignment with
industry trends in technology, commerce, and other areas of growth in order to ensure its
PhaseIInterimReporttotheSpecialCommitteeofthePortAuthorityofNewYorkandNewJersey
16
competitive advantages to stimulate further economic development and prosperity in the
region.
The Executive Director position, the defacto CEO, has turned over seven times in the
lasttenyears
With such turnover at the Executive Director level, it is difficult for any significant strategic
initiatives, goals and objectives to be
realized (Table 4).Organizations typically become
inwardlyfocusedandtendtorunadriftintheabsenceofleadershipcontinuity.
Table4–ExecutiveDirectorTenure
Additionally, review of the Port Authority organizational structures over the last ten year s
showanumberofsignificantchanges.Capitalplanningandprojectdelivery,
forexample,had
fivedifferent“owners”duringthisperiod.Capitalplanningandprojectdelivery,acriticalarea
offocuswithinthePortAuthority,hassufferedfromalackofconsistencyinmanagementand
leadership.
The non‐appointed senior career services professionals of the Port Authority hav e an
unusuallylong
tenure,averaging24yearsofservice
The senior management organization is very respectful, cordial, and appears to have a high
level of dedication and commitment to the Port Authority’s mission.In addition, senior
managementpossessesacriticalknowledgebaseandskillsthatneedstobetransferredthrough
integratedtrainingprogramsto
juniorstaff.Intheabsenceofappointedleadershipcontinuity
drivingcollaborationandaccountability,itisonlynaturalforsuchalongtenuredworkforceto
developaself‐protectiveculture.
ThePortAuthorityisasiloedorganization
With chronic leadership changes,bureaucratic organizations will often inadvertently reinforce
the barriers
to strategic business unit collaboration, as well as the ability to obtain operating
efficienciesderivedthroughsharedservices.Non‐appointed,careerserviceprofessionalsoften
will adopt strategies that protect control, and perpetuation, of their functional areas of
responsibility.The Port Authority resident culture reflects many of the characteristics
associated with this
phenomenon.Examples include the capital planning process, security
apparatus,andtheexistingWTCconstructionorganization.
#
Executive Directors Tenure
1 Patrick J. Foye 2011 - Current
2 Christopher O. Ward 2008 - 2011
3 Anthony Shorris 2005 - 2008
4 Kenneth J. Ringler, Jr. 2004 - 2005
5 Joseph J. Seymour 2001 - 2004
6 Neil D. Levin 2001
7 Robert E. Boyle 1997 - 2001
PhaseIInterimReporttotheSpecialCommitteeofthePortAuthorityofNewYorkandNewJersey
17
The relatively recent appointments of a new Chairman, Vice Chairman, several
Commissioners,ExecutiveDirectorandDeputyExecutiveDirector,providetheimpetus
forrenewedfocusandgovernanceindrivingfuturePortAuthoritystrategy
In the aftermath ofSeptember 11, the Port Authority’s mission wasinlarge part redirected to
the rebuilding
efforts around the WTC site.The organizational toll on the Port Authority
duringthelastdecadecannotbeunderestimated.UnderthepreviousExecutiveDirector,trust
andconfidencebetweentheBoardofCommissionersanditsexecutivemanagementreportedly
deteriorated;asaresult,theBoardofCommissionersadoptedrolesandresponsibilitiesin
daily
operationsandmanagementatypicalforagoverningboard.Thelossinconfidencewaslargely
ascribable to sentiments by the Board of Commissioners that they were not being timely
presented with meaningful and reliable information to make informed decisions.While the
response of the Board of Commissioners may beunderstandable given
the circumstances, its
new leadership has recognized the importance of restoring an elevated focus on the Port
Authority’s broader vision, mission and therevitalization of its strategies, supporting policies
andoversightasitadvancestomeetitschallenges.
ThePortAuthoritywouldlikelybenefitfromameaningfulorganizationalredesignto
focuson
its strategic business units and cost saving shared services functions.To be successful,
entrustedappointedseniorleadershipneedseffectivecommandandcontroltomanagechange
and drive accountability throughout the organization.Career service management must
proactivelycommunicatereliableandrelevantinformationinpropercontextsothatappointed
leadershipis
bestpositionedforeffectivedecisionmaking.Managementandrepresented/non‐
represented employees must collaborate on the manner and means that will allow the Port
Authority to operate with the highest levels of productivity and efficiency.Migration from a
culturebasedontenuretoonebasedonmeritocracywillbeessentialto
itscontinuedsuccess.
The Port Authority is a transportation infrastructure asset manager and must deploy
itscapitalwithproperattentiontopreservationofinfrastructureintegrity
The capital constraints of the organization may necessitate a top‐down budgeting process.
However,acomprehensiveanalysisofneedwithastandardizedmethodofprioritizing
capital
spend is equally required.The Port Authority is an asset manager that owns and manages
billionsofdollarsofinfrastructureandmustdevoteasignificantportionofitscapitaltosupport
the stateof good repair ofthisportfolio as wellas provide fornewinvestments in the system
with discipline.A systematic evaluation of needs must be conducted to balance the capital
capacity constraints of the Port Authority with the imperatives of the operating businesses,
whileappropriatelyprovidingforcontingencies inanagingasset base.Inaddition,whilethe
PortAuthorityhas madeprogressin identifyingahierarchyto
better managethestewardship
of capital, effective command and control over planning processes and disciplined project
deliverymustbeestablished.
ThePortAuthorityneedstofurtherdeveloptoolstodriveaccountability
ThePortAuthorityshouldconsideraligningitskeyoperatingdepartmentsasstrategicbusiness
units(“SBUs”).AsSBU’s,quantifiable
metricsshouldbedeveloped,measuredandconsistently
PhaseIInterimReporttotheSpecialCommitteeofthePortAuthorityofNewYorkandNewJersey
18
monitored to drive accountability in achieving the Port Authority’s mission and specific
operating objectives.The Executive Director and Board of Commissioners are developing a
“dashboard”thatprovidesquickfeedbackandstatusoffinancialandoperationalperformance,
keyinitiatives,andcapitalprogramdelivery.
The Port Authority’s compensation structures must be aligned
with the mission
statementandrelatedgoalsandobjectivestoensureappropriatetargetsareachieved
Compensation structures need to be aligned throughout the Port Authority organization
including management and all levels of represented and non‐represented employees.
Consideration should be given to adopting “at risk” elements of management compensation
that
arecontingentupontheachievementofoperatingobjectives.
VII. PRELIMINARYCOMPENSATIONANDBENEFITSASSESSMENT
SCOPE
Naviganthasbeenaskedtoperformanassessmentoftheorganizationaldesignand operations
of the Port Authority, with an initial focus on labor costs, including both compensation and
benefits.Findings from Navigant’s review are meant to provide a framework for
recommendations that can ultimately be implemented as a series of
parallel initiatives
beginning in 2012.The scope of the labor costs assessment included benchmarking
compensation and benefits by major job categories and reviewing benefits packages against
prevailingpracticeinthepublicandprivatesector.
METHODOLOGY
ThebenchmarkingexerciseincludedreviewofcompensationandbenefitsfortheStateofNew
York and the State of New Jersey and significant public authorities in the New York City
metropolitan region.In addition, with respect to compensation benchmarking of the Port
Authority’s four largest line departments, five to seven public
sector agencies and five to ten
private sector companies were initially identified and reviewed for as potential peer
comparables.Keybusinessattributesofeachpotentialpeerwerecarefullyscrutinized(e.g.,size
ofoperation,numberandageoffacilities,operatorvs.infrastructureprovider,etc.).Ultimately,
a smaller subset of peer groups
was selected for each line department of the Port Authority
basedonreviewoftheseattributes(pleaserefertoAppendix–Afordetails).
To complete the initial review of compensation and benefit costs of the Port Authority,
Navigantreviewednumerousdocuments(includingunionlaborcontracts),conductedmultiple
in‐person
andtelephonicinterviewsanddiscussions,aswellasperformeddetailedanalysesof
basepay,overtime,“add‐on”compensation,healthcarecosts,andotherbenefitsanalyses.
The following provides Navigant’s preliminary observations, findings, and recommendations
with respect to (i) employee headcount, (ii) compensation, (iii) benefits, and (iv) represented
employeecontracts.
PhaseIInterimReporttotheSpecialCommitteeofthePortAuthorityofNewYorkandNewJersey
19
PRELIMINARYGENERALOBSERVATIONS
ThePortAuthority’sactualheadcountasofNovember2011totaling6,913wasrelatively
flatwhen comparedtothe2001headcountof6,954.Whilethelinedepartmentandstaff
servicesheadcountlevelshaveactuallydecreased,thisha sbeenoffsetbygrowth ofover
27% in the security function in an apparent
protracted reaction to the events of
September11.
The overall organizational structure of the Port Authority is heavily concentrated in
seniorandmiddlemanagement.Thisstructuralcharacteristicinlargepartisdrivenby
the long‐tenured nature of the employee workforce that has been promoted based on
seniority and
not necessarily merit.In part, the broad middle management of the
organization is attributable to the large number ofhighlyskilledengineersrequiredto
supportitsassetmanagementanddevelopmentresponsibilities.Asabyproductofthis
historical trend, comparison of the average compensation of the Port Authority to its
peer
group reveals that the Port Authority, when evaluating average employee
compensationcosts,isatthetopofaveragepayranges.
However,furtheranalysis revealsthat theaveragecompensationofthemostsenior,as
wellas thetop25positionswithinlinedepartments isat themedianorbelowthe
peer
group.Thus, the factthat the averageemployeecompensation resides at orabovethe
Port Authority’s peer group is ascribable to the very broad middle and senior
management group of the organization, and not the compensation of the most senior
personnel.
From 2006 to 2010, total gross compensation
at the Port Authority grew from $629.3
million toapproximately $749.3,respectively.Ofthisamount, basesalaries grew from
$507.6 million to $581.1 million, a compounded annual growth rate of only 2.7%.
However, other amounts of compensation, (i.e., “add‐on” compensation) such as pay
associatedwiththevacationexchangeprogram
andcertainlongevityprogramsgrewby
compoundedannualgrowthratesof10.6%and5.5%,respectively.Overtime,thelargest
percentage of “add‐on” compensation represents 23% of the total base pay for
represented employees.Moreover, “add‐on” compensation and benefits for all active
employees when combined and taken as a percentage of
base salary is approximately
70%.These “add‐on” compensation costs are relatively rapid growing and tend to
obfuscateactualtotalcostsperemployeebeingabsorbedbythePortAuthority.
Benefits have increased approximately 35%, from $340.7 million in2006 to over $458.8
millionin2010,drivenbygrowthin
healthcareandthepopulationofretireesthatdrives
up pension costs and other post employment benefits (“OPEB”).When combined,
compensationandbenefitsperactiveemployeegrewtoanestimated$143,060by2010.
Inanefforttoreducethesehighcosts,theBoardofCommissionersisactivelypursuing
policychanges
relatedto healthcarecontributions,vacationpolicies,aswellas“add‐on”
PhaseIInterimReporttotheSpecialCommitteeofthePortAuthorityofNewYorkandNewJersey
20
compensationandincentiveprograms.Currentinitiativesbeingevaluatedinclude,but
arenotlimited,to:
o Increaseinhealthcarebenefitcontributions,whichifimplementedwouldresult
inexpectedsavingsoverthenextfouryearsofapproximately$103.8million.
o Elimination of longevity and unused vacation exchange days payout for non‐
represented
employees; based on preliminary review of payroll files, annual
costsfortheseprogramswereapproximately$9.1millionin2010.
Itisimportanttonotethattherepresentedlaborforce,atapproximately68%oftotal,is
the largest part of the Port Authority employee base.The Board of Commissioners
recognizes
it will be critical to work collaboratively with both represented and non‐
represented employees to improve efficiency and productivity.In furtherance of that
objective, expired union contracts are being carefully evaluated not only for unit labor
costsandbenefits,butalsowithparticularfocusonworkrulemodificationsthatwould
be constructive in advancing the efficiency and effectiveness of the Port Authority’s
operations,priortocollectivebargainingnegotiations.
Phase II of Navigant’sengagement,whichisexpected to becompletedby lateJune2012, will
include anorganizationaldesign review and specific recommendationsto further enhance the
actions of the Board of
Commissioners.The following interim report is in response to the
Special Committee’s requested areas of initial focus and provides Navigant’s preliminary
observations,findings,andrecommendationswithrespectto(i) employeeheadcounttrends,(ii)
compensation benchmarking, (iii) benefits benchmarking, and (iv) represented employee’s
contractconsiderations.
EMPLOYEEHEADCOUNT
The total employeeheadcounthas remained relatively flat over thelastdecade(from 6,954 in
2001to6,913asofNovember2011).
Observations&Findings
Headcountmixhasshiftedfromlinedepartmentsandstaffservicestopublicsafety
From2001to2010,linedepartmentheadcountdeclinedby4.3%(from
3,279to3,139)andstaff
services, engineering & other headcount declined by 11.9% (from 2,296 to 2,022) (Figure 3).
However, public safety headcount increased by 27.1% (from 1,379 to 1,752).The growth in
publicsafetyisinresponsetoSeptember11andheightenedsecurityeffortsthrougho ut thePort
Authorityorganization.
PhaseIInterimReporttotheSpecialCommitteeofthePortAuthorityofNewYorkandNewJersey
21
Figure3–StaffingAllocationTrend (2001–YTDNov2011)
PortAuthoritymanagesheadcounttoʺauthorized”vs.“actual”
Managing headcount to an annually budgeted, authorized number (approximately 7,200 in
2006) can result in delayed intervention in a recessionary environment.The Port Authority’s
actualheadcount increasedfrom 6,918to
7,200,or 4.0%,duringtherecessionof2008 and2009
before ultimately declining in 2010.The Port Authority would have benefited from an
expedited review and timely adjustment to authorized headcount going into the recession.
However, the adjustment to authorized headcount was not made until 2009, and the actual
headcountreduction
wa s notimplemented until2010,primarilythroughretirement incentives
(Table5).
Table5–“Actual”vs.“Authorized”StaffingTrends(2006‐YTDNov2011)
Productivity levels at Aviation, Tunnels, Bridges and Terminals, and Port Commerce
appeartohaveincreasedsince2001,whilePATHappearstohavedecreased
The slight
headcount reduction and increased traffic at Aviation, TB&T, and Port Commerce
suggestsalevelofproductivityincrease,andlikelyreflectsacombinationoftechnologyandthe
fixed aspect nature of individual facility labor requirements.PATH was the only line
department where actual headcount increased during this period, while traffic essentially
remainedflat,implyinglowerproductivity.
3,279
3,139
1,379
1,752
2,296
2,022
- 2,000 4,000 6,000 8,000
2001
YTD Nov
2011
Line Departments Public Safety & Security Staff Services, Engineering & Other
(140)
(274)
373
Total
Headcount:
6,954
Total
Headcount:
6,913
Nov
(#'s in 000's, except Headcount)
2006 2007 2008 2009 2010 2011
Total Year End Actual Headcount 6,935 6,918 7,200 7,163 6,848 6,913
YOY Change (#) (31) (17) 282 (37) (315) 65
Total Authorized Staffing 7,181 7,128 7,127 6,977 6,977 6,777
YOY Change (#) (13) (53) (1) (150) - (200)
Actual Workforce Greater Than / (Less Than) Auth. (246) (210) 73 186 (129) 136
% Variance (4%) (3%) 1% 3% (2%) 2%