Project-Management with Gantt-Charts docx
Bạn đang xem bản rút gọn của tài liệu. Xem và tải ngay bản đầy đủ của tài liệu tại đây (965.9 KB, 27 trang )
Project-Management with
Gantt-Charts
OpenOffice.org 2.0 Calc
[Projekt-Management und Gantt-Diagramm mit OpenOffice.org 2.0 Calc and Comment
créer un diagramme de Gantt avec OpenOffice.org]
[1.1]
First editions: [2005-06-06 and 2003-01-03]
First English edition: [2005-11-09]
Contents
Contents
Contents 1
Copyright and trademark information 2
Feedback 2
Acknowledgments 2
Modifications and updates 3
Overview 1
Starting the Process 2
Converting the simple bar-chart into a Gantt chart 5
Using the chart as a graphic in other applications 9
Extending Gantt charting for Project Management 11
About the macro 12
Example: Planning a relocation 13
Controlling the Project 17
Public Documentation License, Version 1.0 19
Project-Management with Gantt-Charts iii
Copyright and trademark information
Copyright and trademark information
The contents of this Documentation are subject to the Public Documentation License, Version
1.0 (the "License"); you may only use this Documentation if you comply with the terms of this
License. A copy of the License is available at:
/>The Original Documentation is "Comment créer un diagramme de Gantt avec
OpenOffice.org". The Initial Writer of the Original Documentation is Serge LE LOUARNE
Copyright ©2003. All Rights Reserved.
(Initial Writer contact(s):
Contributor(s): DIETMAR HILLER
Portions created by DIETMAR HILLER are Copyright © 2005. All Rights Reserved.
(Contributor contact(s):
Contributor(s): G. Roderick Singleton.
Portions created by G. Roderick Singleton are Copyright ©2005. All Rights Reserved.
(Contributor contact(s): .
Portions created by ______ are Copyright ©_________[insert year(s)]. All Rights Reserved.
(Contributor contact(s):________________[insert hyperlink/alias]).
All trademarks within this guide belong to legitimate owners.
[Note: a copy of the PDL is included in this template and is also available at:
/>Feedback
Please direct any comments or suggestions about this document to:
Acknowledgments
I wish to thank every member of the German and French Native Language Communities who
are not mentioned but contributed to my being able to provide a translation.
To S. Schneider for fixing my errors and grammar.
Project-Management with Gantt-Charts ii
Copyright and trademark information
Modifications and updates
Version Date Description of Change
[1.0] [2005-11-09] [grs: Initial edition issued for comment]
[1.1] [2005-11-12] [ss: Proofed edition issued for publication]
Project-Management with Gantt-Charts iii
Overview
Overview
Gantt Charts are a way to graphically show progress of a project. Management of a project is
made easier if it is viewed as small manageable items where the dependencies are visually
illustrated, parallel processes are discovered, the overall processing time determined and
progress tracked. The tasks of a project can be quite complex and dependent on each other.
With a project management tool, such as a Gantt chart,all subtasks of a task can be viewed
graphically.
In this document a relocation-process to another city is used for all examples and is based upon
the accompanying Calc template, .pjm_template_english.ots which may be downloaded from
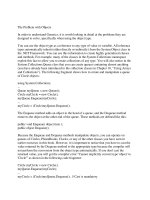
/>In illustration 1, the subtasks of the relocation-process appear on the y-axis, and the time line
on the x-axis. The bars show when a task should start and when it will be finished. Blue bars
show tasks which have been completed. Yellow bars show work which still must be done.
Project-Management with Gantt-Charts 5
Illustration 1: The finished example
Relocation completed
Move bank account
Open an account
Reregister car
Furnish the flat
Registration office
Relocation
Forwarding request
Send out new address
Organise relocation
New leasing contract
Cancel banking's order
Cancel apartment DD
House-hunting
01/04/05 01/05/05 31/05/05 01/07/05 31/07/05 31/08/05 30/09/05
Relocation DD to M
Undone
Done
Start
Starting the Process
Starting the Process
To chart a project, all the sub-tasks must first be collected in a spreadsheet. In this simple
example there is the name of the task, the start-date and the duration in calendar days:
Illustration 2: Task list
This simplified project consists of eight subtasks “Task 1” to “Task 8”.
Next, begin creating the chart by selecting Insert—Chart:
Illustration 3: Create the chart
From the dialogue “AutoFormat Chart” define the selection range. Neither the first row
(containing the column label) nor the first column (containing the task name) should be
included as data.
Project-Management with Gantt-Charts 2
Starting the Process
Click “Next >>” , and choose the Chart type:
Illustration 4: Choose chart type
Choose the horizontal bar-chart and click “Columns” to indicate that the data are arranged in
columnar form.
Note: This changes the assignment of the axis in OpenOffice.org Calc. Now the horizontal axis is called “Y” and
the vertical axis is called “X”.
Click “Next >>” and choose the variant “Stacked”:
Project-Management with Gantt-Charts 3
Illustration 5: Create chart with stacked bars
Starting the Process
Click “Next >>” once again and enter chart and axis titles:
Illustration 6: Adapt chart labeling
The first Gantt Chart appears as follows:
Illustration 7: Bar chart
The task names are on the vertical axis (“Task 1” to “Task 8”) and the time line is on the
horizontal axis.
Project-Management with Gantt-Charts 4
Converting the simple bar-chart into a Gantt chart
Converting the simple bar-chart into a Gantt chart
In order to edit the properties of an element in the diagram,. double-click the chart to select it.
Next, right-click to open the context menu and gain access to the chart properties:
Illustration 8: Edit diagram properties
Note: Ensure that no element in the diagram is selected, because otherwise the axis-properties can not be edited
Project-Management with Gantt-Charts 5
Converting the simple bar-chart into a Gantt chart
Select the y-axis, which now is the horizontal time line. (One could also select the
horizontal axis using a left-click then right-click to open the context menu and finally choose
Object Properties to format this axis.)
Set the Minimum to the real start-date, In this example this is 01/01/05. Furthermore the axis
should get the start date, so check the checkbox “Automatic” in the line “Axis at”:
This produces a chart as follows:
Project-Management with Gantt-Charts 6
Illustration 9: Adjust the time line
Illustration 10: Gantt chart
Converting the simple bar-chart into a Gantt chart
The orange bar symbolizes the time up to the start of the task. This bar should be made
invisible. For this select the orange bar with a left-click, and then open its Object Properties
after a right click.
Under the tab “Borders” choose Style – Invisible, and under the tab “Area” choose Fill –
None. Now the chart presents itself as follows:
Project-Management with Gantt-Charts 7
Illustration 11: The completed Gantt chart
Converting the simple bar-chart into a Gantt chart
Project-Management with Gantt-Charts 8
Using the chart as a graphic in other applications
Using the chart as a graphic in other applications
To use the Gantt-chart as a picture in another application, save the whole Calc document as
HTML. This generates not only the HTML-file, but also a jpeg-file containing the chart which
can then be included in other documents, such as anOpenOffice.org impress presentation.
Remember to give the graphic a more descriptive name than, the the name suggested when the document is
exported to HTML so that it can be found easily later
Project-Management with Gantt-Charts 9
Using the chart as a graphic in other applications
Project-Management with Gantt-Charts 10
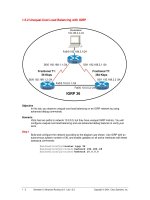
Extending Gantt charting for Project Management
Extending Gantt charting for Project Management
In order to manage a project, still more information is needed. The progress of any task should
be tracked as a percentage of the task and displayed in the chart, and the dependencies of the
subtasks should also be documented. Furthermore the start-date should be determined
automatically based on these dependencies.
To be able to create such a plan easily, a template was made by the German Native Language
Community ( ) called pjm_template.ots.
The current version of Gantt.zip contains the example spreadsheet and the spreadsheet itself
can be downloaded from
Note: This template uses macros and upon opening displays a security warning. Therefore, macros must be
enabled to use the file.
The file, created from the template, contains the following columns:
• “Info” - Information about the progress of the task
• “No.” - unique number of the task. It is recommended to count in intervals of 100, to be
able to add tasks later on
• “Activity” - description of the task
• “Start” - start-date of the task
• “Duration” - planned or actual duration of the task in calendar days
• “End” - end-date of the task. This gets calculated based on the start-date and duration.
• “Progress” in percentage
• “Done” - Duration * progress
• “Undone” - expected time remaining: Duration - Done
Project-Management with Gantt-Charts 11
Illustration 12: Calc template pjm_template.ots
Extending Gantt charting for Project Management
• “Predecessor” - List of tasks, which have to be completed, before this task can start.
Separation is made by spaces.
The column titles in the first row can be labeled freely, but the columns must not change their
position.
Some columns have a colored background:
• gray: these columns contain formulas, which are calculated automatically
• light blue: these columns can be edited manually, they can possibly be changed by the
macro.
It is recommended to use the last row for the end of the project. Thus new tasks, which are
inserted above, are displayed in the chart automatically.
About the macro
The macro is named “update” and is written in OpenOffice.org BASIC. The way it works
follows this sequence:
● Add duration and end-date, if they are missing
● For each row of the table
1. Where the task has not yet started (Progress <= 0)
● Search for rows, whose number corresponds with the value in the column
“Predecessor”. For those not familiar with project management terms, a predecessor is
an activity that must be completed (or be partially completed) before a specified
activity can begin.( See
for
definitions. )
a) Determine latest possible end-date of these rows
b) Set the successor start-date to this end-date
● Where the task is finished (Progress = 100%)
1. Determine duration from start-date and end-date
● Illustrate information of task
The meaning of this list of steps is described later on in this document.
The macro expects that the first row contains the headlines, the tasks start in row 2 and the
columns are in the same place as in the example. Additional columns (for comments or some other
purpose) must be located at the end.
Note: The maximum number of predecessors is limited to 9.
Project-Management with Gantt-Charts 12
Extending Gantt charting for Project Management
Example: Planning a relocation
This section describes the process of relocating from one city to another city and is based upon
the template, pjm_template.ots.
The first step is to create a list with all subtasks:
In preparing the set of tasks, getting mail forwarded was missed. So we inserted the activity
“Forwarding request” in row 8 after the fact. Therefore this activity has the number 650.
Inserting a row does not automatically copy any formulae, thus all the formulae must be copied
to each cell in the new row manually.
Project-Management with Gantt-Charts 13
Illustration 13: List of subtasks
Extending Gantt charting for Project Management
Next insert the start-date for the not-dependent tasks, as well as duration and expected end-
date:
House-hunting starts on 01/03 and should be finished by 31/08. For all the other tasks the
duration is given.
Now, define the dependencies of the tasks. The relocation (700) for example can not start
before the new leasing contract is signed (400) and the relocation is organized (500). The tasks
300-9999 have no dependencies, thus there are no start-dates for these tasks.
Next insert the start-date for the not-dependent tasks, as well as duration and expected end-
date:
Project-Management with Gantt-Charts 14
Illustration 14: Insert start- and end-date
Illustration 15: Define dependencies
Extending Gantt charting for Project Management
Illustration 16: Insert start- and end-date
House-hunting starts on 01/03 and should be finished by 31/08. For all the other tasks the
duration is given.
Now define the dependencies of the tasks. For example, relocation (700) can not start before
the new leasing contract is signed (400) and relocation is organized (500). The tasks 300-9999
have no dependencies, thus there are no start-dates for these tasks.
Illustration 17: Define dependencies
As 20% of house-hunting are already done, and the current apartment is already canceled, the
progress is 20% and 100% respectively.
Project-Management with Gantt-Charts 15
Extending Gantt charting for Project Management
Illustration 18: Calculated duration
At this point call the macro by clicking on the button “Update”. The duration and end-dates are
calculated, and the column start is completed.
Illustration 19: The appropriate chart
The organization of the relocation, the registration at the office and the opening of an account
can be done simultaneously. On the other hand the bank account can not be moved
immediately, because the current apartment is not yet relocated.
Project-Management with Gantt-Charts 16
Extending Gantt charting for Project Management
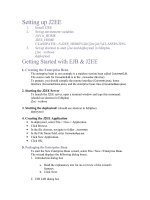
Controlling the Project
During any project, start by implementing several subtasks.
To begin a subtask, insert the start date in the column “Start”. Set the progress to a value
greater than zero (1% e.g.), so that “Update” will no longer change this date.
If a task is completed, insert the real End-date, delete the duration and set the progress to
100%. When calling “Update” the next time, the required duration will be calculated.
After each change in the table,invoke the macro ”Update” to update the table accordingly.
The “Info” column shows the current status of the project:
Illustration 20: Table during project-controlling
House-hunting has begun and is on schedule according to the progress
The apartment has already been canceled, the task is completed.
Cancelling the bank's order is due and not on schedule, this means, that the end-date is prior
to the current date.
All the other tasks are not due yet, they are not marked.
Project-Management with Gantt-Charts 17
Extending Gantt charting for Project Management
Project-Management with Gantt-Charts 18
Public Documentation License, Version 1.0
Public Documentation License, Version 1.0
1.0 DEFINITIONS.
1.1. "Commercial Use" means distribution or otherwise
making the Documentation available to a third party.
1.2. "Contributor" means a person or entity who creates or
contributes to the creation of Modifications.
1.3. "Documentation" means the Original Documentation or
Modifications or the combination of the Original
Documentation and Modifications, in each case including
portions thereof.
1.4. "Electronic Distribution Mechanism" means a mechanism
generally accepted for the electronic transfer of data.
1.5. "Initial Writer" means the individual or entity identified as
the Initial Writer in the notice required by the Appendix.
1.6. "Larger Work" means a work which combines
Documentation or portions thereof with documentation or
other writings not governed by the terms of this License.
1.7. "License" means this document.
1.8. "Modifications" means any addition to or deletion from
the substance or structure of either the Original
Documentation or any previous Modifications, such as a
translation, abridgment, condensation, or any other form in
which the Original Documentation or previous Modifications
may be recast, transformed or adapted. A work consisting of
editorial revisions, annotations, elaborations, and other
modifications which, as a whole represent an original work of
authorship, is a Modification. For example, when
Documentation is released as a series of documents, a
Modification is:
A. Any addition to or deletion from the contents of the
Original Documentation or previous Modifications.
B. Any new documentation that contains any part of the
Original Documentation or previous Modifications.
1.9. "Original Documentation" means documentation
described as Original Documentation in the notice required by
the Appendix, and which, at the time of its release under this
License is not already Documentation governed by this
License.
1.10. "Editable Form" means the preferred form of the
Documentation for making Modifications to it. The
Documentation can be in an electronic, compressed or archival
form, provided the appropriate decompression or de-archiving
software is widely available for no charge.
1.11. "You" (or "Your") means an individual or a legal entity
exercising rights under, and complying with all of the terms of
this License or a future version of this License issued under
Section 5.0 ("Versions of the License"). For legal entities,
"You" includes any entity which controls, is controlled by, or
is under common control with You. For purposes of this
definition, "control" means (a) the power, direct or indirect, to
cause the direction or management of such entity, whether by
contract or otherwise, or (b) ownership of more than fifty
percent (50%) of the outstanding shares or beneficial
ownership of such entity.
2.0 LICENSE GRANTS.
2.1 Initial Writer Grant.
The Initial Writer hereby grants You a world-wide, royalty-
free, non-exclusive license to use, reproduce, prepare
Modifications of, compile, publicly perform, publicly display,
demonstrate, market, disclose and distribute the
Documentation in any form, on any media or via any
Electronic Distribution Mechanism or other method now
known or later discovered, and to sublicense the foregoing
rights to third parties through multiple tiers of sublicensees in
accordance with the terms of this License.
The license rights granted in this Section 2.1 ("Initial Writer
Grant") are effective on the date Initial Writer first distributes
Original Documentation under the terms of this License.
2.2. Contributor Grant.
Each Contributor hereby grants You a world-wide, royalty-
free, non-exclusive license to use, reproduce, prepare
Modifications of, compile, publicly perform, publicly display,
demonstrate, market, disclose and distribute the
Documentation in any form, on any media or via any
Electronic Distribution Mechanism or other method now
known or later discovered, and to sublicense the foregoing
rights to third parties through multiple tiers of sublicensees in
accordance with the terms of this License.
The license rights granted in this Section 2.2 ("Contributor
Grant") are effective on the date Contributor first makes
Commercial Use of the Documentation.
3.0 DISTRIBUTION OBLIGATIONS.
3.1. Application of License.
The Modifications which You create or to which You
contribute are governed by the terms of this License, including
without limitation Section 2.2 ("Contributor Grant"). The
Documentation may be distributed only under the terms of this
License or a future version of this License released in
accordance with Section 5.0 ("Versions of the License"), and
You must include a copy of this License with every copy of
the Documentation You distribute. You may not offer or
impose any terms that alter or restrict the applicable version of
this License or the recipients' rights hereunder. However, You
may include an additional document offering the additional
rights described in Section 3.5 ("Required Notices").
3.2. Availability of Documentation.
Any Modification which You create or to which You
contribute must be made available publicly in Editable Form
under the terms of this License via a fixed medium or an
accepted Electronic Distribution Mechanism.
3.3. Description of Modifications.
All Documentation to which You contribute must identify the
[Document Title] 19