Sugary Drink FACTS: Evaluating Sugary Drink Nutrition and Marketing to Youth docx
Bạn đang xem bản rút gọn của tài liệu. Xem và tải ngay bản đầy đủ của tài liệu tại đây (8.72 MB, 232 trang )
Evaluating Sugary Drink Nutrition
and Marketing to Youth
Methods
Sugary Drink FACTS:
Evaluating Sugary Drink Nutrition
and Marketing to Youth
Authors:
Jennifer L. Harris, PhD, MBA
Marlene B. Schwartz, PhD
Kelly D. Brownell, PhD
Johanna Javadizadeh, MBA
Megan Weinberg, MA
Vishnudas Sarda, MBBS, MPH
Christina Munsell, MS, RD
Carol Shin, MBA
Fran Fleming Milici, PhD
Amy Ustjanauskas
Renee Gross
Sarah Speers
Andrew Cheyne, CPhil
Lori Dorfman, DrPH
Priscilla Gonzalez, MPH
Pamela Mejia, MS, MPH
Rudd Center for Food Policy and Obesity
October, 2011
Acknowledgements
We would like to thank the following people for their valuable assistance in collecting data:
Susannah Albert-Chandhok
Josh Baker
Kate Barnett
Kelly Barrett
Casey Carden
Robert Dowding
Ashley Firth, MA
Ryan Gebhard
Eliza Gombert
Jay Imus
Heather Kaplan
Carly Litzenberger
Benjamin Lovell
Lisa Martinez, MPH
Darina Nghiem
Eunie Park
Angel Reese
Hannah Sheehy
Jennifer Shin
Ashita Soni
Kate Stearns
We would also like to thank our steering committee and other advisors:
Doug Blanke, JD
Frank Chaloupka, PhD
Thomas Farley, MD, MPH
Sonya A Grier, PhD, MBA
Corinna Hawkes, PhD
Shiriki Kumanyika, PhD, MPH
Dale Kunkel, PhD
Tim Lobstein, PhD
Susan T. Mayne, PhD
C. Tracy Orleans, PhD
Lisa M. Powell, PhD
Amelie Ramirez, DrPH
Mary Story, PhD, RD
Stephen Teret, JD, MPH
Ellen Wartella, PhD
James G. Webster, PhD
Walter Willett, MD, DrPH
Jerome D. Williams, PhD
Thank you to our colleagues at the Rudd Center, especially Andrea Wilson, Megan Orciari, and Tricia Wynne We thank Cavich
Creative, LLC, and Chris Lenz for their assistance in preparing the manuscript and website. Finally, we thank the leadership
and staff at the Robert Wood Johnson Foundation, with special thanks to the Childhood Obesity Team.
Support for this project was provided by grants from the Robert Wood Johnson Foundation and the Rudd Foundation.
Sugary Drink FACTS iii
Table of Contents
List of Tables iv
Ranking Tables v
Appendix Tables v
List of Figures vi
Executive Summary 8
Introduction 14
Methods 19
Scope of the analysis 19
Sugary drink products 20
Marketing in traditional media 22
Internet and other digital media 26
In-store marketing 31
Results 33
Sugary drink market 33
Sugary drink products 33
Sugary drink nutritional content 37
New product introductions 42
Marketing in traditional media 44
Advertising spending 44
TV advertising exposure 50
Content analysis of TV advertisements 54
Product placements on TV
62
Radio advertising exposure
64
Ethnic and racial targeting
65
Internet and other digital media
70
Company websites 70
Banner advertising on third-party websites 82
Social media marketing 87
Mobile marketing 96
Summary of youth-directed advertising 101
In-store marketing 104
On-package marketing messages 104
Retailer promotions 107
Conclusions 110
Endnotes 118
Ranking Tables 124
Appendices 149
A. Nutrition and ingredient information 149
B. New product introductions 167
C. Advertising spending and TV GRPs 188
D. TV advertising and YouTube content analysis 200
E. Internet advertising content analyses 218
Sugary Drink FACTS iv
List of Tables
Table 1. Why sugary drinks? 14
Table 2. Products and brands by sugary drink category 34
Table 3. Products and brands by parent company and category 34
Table 4. Children’s brands and varieties 35
Table 5. Sales of sugary drink and energy drink brands across food, mass merchandiser, drug and
convenience stores in 2010
36
Table 6. Sales by category, subcategory, and flavor for brands in our analysis: 2010 36
Table 7. Sugar and calorie content of sugary drinks by category 37
Table 8. Products with only one single-serving size 38
Table 9. Additional nutrition information by category 39
Table 10. Children’s products compared to other sugary drink products 40
Table 11. Total advertising spending by sugary drink category in 2010 45
Table 12. Total advertising spending for other beverage categories in 2010 . . . . . . . . . . . . . . . . . . . . . . . . . . . . . . . . .45
Table 13. Youth vs. adult exposure to TV advertising for sugary drinks and energy drinks in 2010 51
Table 14. Youth vs. adult exposure to TV advertising for other beverage categories in 2010 51
Table 15. Sponsorship advertisements on local TV 61
Table 16. Brand appearances on prime-time TV by beverage category in 2010 62
Table 17. Total screen time for appearances by brand 63
Table 18. Radio advertising exposure by category in 2010 64
Table 19. Black youth exposure to TV advertising for sugary drinks, energy drinks, and other beverage
categories in 2010
65
Table 20. Brands with the highest black-to-white targeted ratios for TV ad exposure in 2010 66
Table 21. Advertising exposure on Spanish-language radio by category in 2010 68
Table 22. Websites with high child composition indices in 2010 71
Table 23. Websites with high teen composition indices in 2010 71
Table 24. Websites promoting children’s brands ranked by level of engagement 74
Table 25. Soda websites for products and company-sponsored promotions ranked by level of engagement 75
Table 26. Energy drink websites ranked by level of engagement 78
Table 27. Other sugary drink websites ranked by level of engagement 80
Table 28. Websites with disproportionate numbers of black youth visitors in 2010 81
Table 29. Black targeting on sugary drink and energy drink websites 81
Table 30. Hispanic targeting on sugary drink and energy drink websites 82
Table 31. Proportion of banner advertisements viewed on youth websites 83
Table 32. Frequency of posts and engagement devices on Facebook 88
Table 33. Frequency of posts and engagement devices on Twitter 91
Table 34. Top products or promotions mentioned in tweets 92
Table 35. YouTube videos for sugary drink and energy drink brands uploaded in 2010 93
Sugary Drink FACTS v
Table 36. Mobile websites with the most frequent placement of banner advertisements in 2010 96
Table 37. Mobile banner advertising placements by brands in 2010 . . . . . . . . . . . . . . . . . . . . . . . . . . . . . . . . . . . . . . .97
Table 38. Top five monthly ad placements as measured by ad index for each sugary drink brand in 2010 97
Table 39. iPhone applications for sugary drinks 98
Table 40. iPhone application demographic profile 99
Table 41. Children’s exposure to advertising by company and medium in 2010 101
Table 42. Teens’ exposure to advertising by company and medium in 2010 102
Table 43. Children’s exposure to advertising by brand and medium in 2010 102
Table 44. Teens’ exposure to advertising by brand and medium in 2010 103
Table 45. Child features and promotions on product packages by category 104
Table 46. Nutrition-related claims by category 105
Table 47. Incremental sales associated with retail promotions in 2010 107
Table 48. Maximum amount of added sugar young people who are not physically active should consume per day 110
Ranking Tables
1. Nutritional content of beverages 124
2. Advertising spending 127
3. TV advertising exposure by children 129
4. TV advertising exposure by teens 131
5. Product placements on TV 133
6. Radio advertising exposure 135
7. TV advertising exposure by black youth 137
8. Spanish-language TV and radio advertising exposure 139
9. Beverage website exposure 141
10. Banner advertising exposure 143
11. Social media exposure 145
12. On-package ingredient claims and child features 147
Appendix Tables
A1. Nutrition and ingredient information: Energy drinks 149
A2. Nutrition and ingredient information: Flavored water 152
A1. Nutrition and ingredient information: Fruit drinks 153
A2. Nutrition and ingredient information: Iced tea 161
A1. Nutrition and ingredient information: Regular soda 163
A2. Nutrition and ingredient information: Sports drinks 165
B1. Products introduced in 2009-2010 167
C1. Advertising spending by category and company: 2008-2010 188
C2. GRPs by category, company, and age group: 2008-2010 192
C3. GRPs for black and white youth by category, company, and age group: 2008-2010 195
Sugary Drink FACTS vi
C4. GRPs for Spanish-language TV by category, company, and age group: 2008-2010 199
D1. Content analysis of child- and parent-targeted TV advertisements 200
D2. Content analysis of general audience TV advertisements 202
D3. Content analysis of local English-language and Spanish-language sponsorship advertisements 208
D4. Content analysis of Spanish-language TV advertisements 209
D5. Content analysis of YouTube videos 212
E1. Main focus and target audience of company websites 218
E2. Promotions and sponsorships on company websites 220
E3. Third parties featured on company websites 221
E4. Branding and beverage portrayals on company websites 222
E5. Selling points used on company websites 224
E6. Indirect product associations used on company websites 226
E 7. Engagement techniques used on company websites 228
E8. Content analysis of type of banner advertisement 230
E9. Content analysis of type of promotion advertised 231
List of Figures
Figure 1. Beverage industry expenditures on youth-targeted marketing programs in 2006 16
Figure 2. Sugary drink and energy drink products by company 35
Figure 3. Sales of all beverage categories in 2010 36
Figure 4. Full-calorie and light drinks by category . . . . . . . . . . . . . . . . . . . . . . . . . . . . . . . . . . . . . . . . . . . . . . . . . . . 38
Figure 5. Sugar and artificial sweetener content of children’s products 40
Figure 6. New sugary drink products introduced by company 42
Figure 7. New sugary drink products by category 42
Figure 8. Breakdown of new products by type of change 42
Figure 9. Percentage of advertising spending by sugary drink category in 2010 45
Figure 10. Percentage of advertising spending by category and medium in 2010 45
Figure 11. Advertising spending for sugary drink categories: 2008 to 2010 46
Figure 12. Advertising spending for other beverage categories: 2008 to 2010 46
Figure 13. Advertising spending by regular soda brands: 2008 and 2010 47
Figure 14. Total advertising spending by type of soda in 2010 47
Figure 15. Advertising spending by energy drink brands: 2008 to 2010 47
Figure 16. Advertising spending by fruit drink brands: 2008 to 2010 48
Figure 17. Advertising spending by 100% juice brands: 2008 to 2010 . . . . . . . . . . . . . . . . . . . . . . . . . . . . . . . . . . . . 48
Figure 18. Advertising spending by sugary drink brands in the sports drink, flavored water, and iced tea 49
categories: 2008 to 2010
Figure 19. Advertising spending by diet drink and plain water brands: 2008 to 2010
49
Sugary Drink FACTS vii
Figure 20. Proportion of advertising budgets allocated to sugary drink versus other 49
beverage categories: 2008 and 2010
Figure 21. TV advertising exposure by age and category: 2008 and 2010
51
Figure 22. Exposure to TV advertising for all beverage categories: 2008 to 2010 52
Figure 23. Children’s exposure to sugary drink and energy drink TV advertising by company: 2008 to 2010 54
Figure 24. Teens’ exposure to sugary drink and energy drink TV advertising by company: 2008 to 2010 54
Figure 25. Most common messages in regular soda, energy, and sports drink TV advertisements 56
compared with all other advertisements
Figure 26. Percentage of total screen time for brand appearances by beverage category
63
Figure 27. Common attributes of sugary drink and energy drink websites 72
Figure 28. Common attributes of sugary drink websites by beverage category 73
Figure 29. Type of banner advertisement by category 84
Figure 30. Promotion type featured in banner ads by category 84
Figure 31. Examples of Twitter contests 90
Figure 32. Examples of sugary drink tweets with outbound links 90
Figure 33. Types of mobile websites on which banner advertisements appeared in 2010 96
Figure 34. Main point of mobile banner advertisements 97
Figure 35. Text messages from Sprite 100
Figure 36. Text messages from “My Coke Rewards” 100
Figure 37. Types of retailers where sugary drinks were sold in 2010 107
Figure 38. Incremental sales in 2010 by type of promotion 108
Figure 39. Incremental sales in 2010 by type of retailer 109
Figure 40. Maximum added sugar allowance for children and teens and sugar content of sugary drinks by category 110
Sugary Drink FACTS 8
Executive Summary
The negative health effects of consuming sugary
drinks are well documented. Just one fruit
drink, regular soda, or energy drink contains
more added sugar than most young people
should consume in an entire day. Yet beverage
companies continue to market these products
aggressively to children and teens.
Numerous research studies document that consumption of
sugary drinks is positively associated with increased calorie
consumption, body weight, and diet-related health issues, as
well as poor overall nutrition and tooth decay in young people.
1,2
Sugary drinks contribute 22% of empty calories consumed
by children and teens,
3
soda is the number-one source of
calories in teens’ diets,
4
and young people consumed 20%
more calories from sugary drinks in the period from 1999 to
2004 than they did 10 years earlier.
5
Drinking just one 8-ounce
sugary drink every day increases a child’s odds of becoming
obese by 60 percent.
6
Numerous public health organizations, including the U.S.
Centers for Disease Control and Prevention,
7
American
Academy of Pediatrics,
8
and American Heart Association,
9
have
called for reduced consumption of added sugars, including
from sugary drinks. In addition, the American Academy of
Pediatrics has stated that energy drinks “have no place in the
diet of children and adolescents.”
10
Exposure to TV advertising
for sugary drinks is associated with higher consumption of
these products.
11
Nevertheless, companies spent more on
marketing beverages directly to children and adolescents
compared with any other food category,
12
and the majority of
beverage advertising promotes sugary drinks.
13
Marketing for
sugary drinks also may be targeted disproportionately more
often to minority and low-income youth who consume more of
these products and are at higher risk of obesity and related
diseases.
14
The American Beverage Association claims that “sugar-
sweetened beverages are not driving health issues like
obesity and diabetes.”
15
This trade association for the largest
beverage companies points to recent declines in sugary drink
consumption and sales, as well as data showing that these
products contribute just 7% of calories in the diets of the
average American. It also states that the number of beverage
calories in the market has decreased by 21% in the past ten
years “due in part to industry’s innovation in bringing more
no- and low-calorie beverage options to market.” From 2005
to 2010, per capita consumption of carbonated soft drinks
declined by 13% (from 824 8-oz servings per year to 715),
and fruit drink consumption went down 17% (222 to 184 8-oz
servings).
16
While these are small steps in the right direction,
every individual in the United States continues to consume
on average more than three 8-oz servings of carbonated soft
drinks, fruit drinks, teas, sports drinks, enhanced water, and
energy drinks every day. Public health experts believe that the
beverage industry must take much stronger action to protect
children and adolescents, especially from marketing that
encourages them to consume products that can damage their
health.
17,18,19
This report quantifies the nutritional content and full array of
marketing practices that promote sugary drinks to children and
teens. In the first section, we document the sugar, caffeine,
and artificial sweeteners contained in sugary drinks, and
evaluate new beverage products introduced in the past two
years. We also provide data on sales by product category. We
then examine marketing of sugary drinks and energy drinks
in traditional media, including media spending, TV and radio
advertising, and TV product placements. The next section
details marketing practices in newer media, including beverage
company websites, advertising on third-party websites, social
media (Facebook, Twitter, and YouTube), and mobile marketing.
Finally, we present data on marketing in stores, including
product packaging and retail promotions.
We utilized syndicated data when available, including data
from Nielsen, comScore, Arbitron, and SymphonyIRI, and
supplemented this information with our own studies to quantify
the extent of these marketing practices. In addition, we
conducted content analyses of the different forms of marketing
to assess target audiences, messages, and techniques
presented in the advertisements. When data were available,
we also present evidence of marketing targeted to black and
Hispanic youth. The objective is to provide a transparent,
science-based evaluation that can be used to monitor and
evaluate future changes.
Results
We analyzed more than 600 sugary drink and energy drink
products that contain added sugar, including regular soda,
energy drinks, fruit drinks (i.e., not 100% juice), flavored water,
sports drinks, and iced tea. In addition, we assessed diet energy
drinks and diet children’s fruit drinks. Together the products in
our analysis comprise 91% of sugary drink and energy drink
product sales. More than one-half of these products were fruit
drinks; however, regular soda comprised 45% of product sales.
Energy drinks followed regular soda with the second highest
sales numbers (22% of the total), surpassing fruit drinks and
sports drinks. Flavored water was the lowest selling category,
with just 2% of drink sales. The majority of brands in our analysis
also offered light (i.e., reduced-calorie) and/or diet versions of
their products; however, these products had much lower sales.
Regular soda sales were approximately double sales of diet
soda, and sales of full-calorie sports and fruit drinks were five
to six times higher than those of light and diet products in
these categories. Only flavored water brands sold comparable
amounts of diet and regular products. Children’s fruit drinks
contributed one-third of sales in the fruit drink category, and
sales of fruit drinks were almost as high as sales of 100% juice.
Sugary Drink FACTS 9
Executive Summary
The sugary drink market is dominated by a few companies:
Coca-Cola, PepsiCo and Dr Pepper Snapple Group had
more than one-half of the products in our analysis, including
products in almost every category. Kraft Foods followed, with
82 products, primarily in the fruit drink category. Kraft Foods
also offered more than one-half of the children’s products in our
analysis. The remaining ten companies in our analysis offered
one or two brands each and between 5 and 50 products. These
products were all in the energy drink, fruit drink, and iced tea
categories.
Nutritional content
Full-calorie varieties of regular soda, fruit drinks, and energy
drinks commonly contained 27 to 30 grams of sugar. These
levels add up to 45 grams in a 12-ounce can and 75 grams in
a 20-ounce bottle. Flavored water, sports drinks, and iced tea
typically contained less sugar than the other categories (13-19
g in full-calorie versions). Brands in all categories included light
varieties with 1 to 13 grams of sugar; however, light products
also contained artificial sweeteners. Children’s products
typically contained less sugar than other similar products,
but this difference could be attributed to smaller-sized single-
serving packages and more products with artificial sweeteners.
As with other similar products, one-third of children’s products
contained juice, but none had more than 10% juice. In addition,
40% of children’s products contained artificial sweeteners.
Energy drinks contained a median of 80 milligrams of caffeine,
comparable to a cup of coffee. The most highly-caffeinated
product, Rockstar energy shot, contained 200 milligrams
concentrated in a 2.5-ounce shot. Coca-Cola’s NOS and Full
Throttle energy drinks also contained 99 to 130 milligrams of
caffeine in an 8-ounce serving, or 245 to 325 milligrams in a
20-ounce can. Most sugary drinks had low levels of sodium,
with the exception of sports drinks and energy drinks (typically
110-123 mg) and one children’s fruit drink: Sunny D contained
170 milligrams of sodium in an 8-ounce serving.
It was difficult to obtain nutrition information for many of these
products. With the exception of PepsiCo, companies did not
report complete nutrition facts and ingredient lists for all of their
products on company websites. The energy drink companies
were the least likely to report complete nutrition information;
approximately one-half of energy drink products did not
disclose their caffeine content.
Of the 161 new sugary drink and energy drink products
introduced in 2009 and 2010, the majority were new flavors
or other changes that did not affect the nutritional quality of
the products. One-third involved reformulations of existing
products, and 78% of reformulations enabled sugary drink
brands to make additional nutrition-related marketing claims.
Common claims included new “natural” and other claims about
added nutrients (22% of new products) and claims promoting
lower calories due to the replacement of added sugar with
artificial sweeteners (12% of new products). An additional 7% of
new products involved other improvements to product nutrition,
primarily by offering smaller sizes of regular soda. Finally, 8%
reduced overall healthfulness by adding caffeine (even to
products that do not traditionally have caffeine), introducing
larger-sized containers, or adding new children’s versions of
sugary drink or artificially-sweetened products.
Marketing in traditional media
Beverage companies spent $948 million in 2010 to advertise
sugary drinks and energy drinks in all measured media, an
increase of 5% since 2008. Spending in three categories had
larger increases of 28 to 37%: regular soda, energy drinks,
and other (i.e., not children’s) fruit drinks; whereas spending
on flavored water and sports drinks declined. Three-quarters of
2010 media budgets were spent on TV advertising. Fruit drink,
sports drink, and iced tea brands also spent 15% or more of
their advertising in magazines, and regular soda brands spent
5% or more of their budgets on internet, radio, and outdoor
advertising. Beverage companies spent an additional $200
million to advertise 100% juice and diet soda, $78 million on
advertising for other diet drinks, and $58 million on plain water.
Advertising spending for sugary drinks and energy drinks
was dominated by three brands: Coca-Cola Classic, 5-hour
Energy, and Gatorade full-calorie products, with 40% of all
spending. Coca-Cola alone spent almost $180 million on Coca-
Cola Classic and Coca-Cola brand-level ads. Coca-Cola was
also the highest spending company overall with almost $300
million in advertising for its sugary drinks, followed by PepsiCo
($250 million), Dr Pepper Snapple Group ($128 million), and
Innovation Ventures (maker of 5-hour Energy) ($107 million).
Spending by the top-six advertisers of sugary drinks and
energy drinks increased from 2008 to 2010 with one notable
exception: PepsiCo reduced spending on its sugary drink
brands by 27%, or $92 million.
In 2010, preschoolers, children, and teens saw 213, 277, and
406 ads on TV, respectively, for sugary drinks and energy
drinks; and teens viewed 12% more of these ads compared
with adults. In addition, total exposure increased by 4% for
preschoolers, 8% for children, and 18% for teens from 2008
to 2010. Exposure to TV advertising increased for three of the
six sugary drink categories (regular soda, energy drinks, and
iced tea), including twice as many ads for regular soda viewed
by children and teens in 2010 compared with 2008. Fruit drink
ad exposure remained fairly stable from 2008 to 2010 for 2-
to 11-year-olds, but increased by 24% among teens and 33%
among adults, suggesting that children’s fruit drink brands
(the largest advertisers in this category) may have moved
their advertising focus towards somewhat older age groups.
In contrast, TV ads for beverage products that do not contain
added sugar (i.e., 100% fruit juice, plain water, diet soda, and
other diet drinks) disproportionately reached adults. These
other categories accounted for 40% of all beverage ads viewed
by adults, but just 28% of beverage ads viewed by youth.
Sugary Drink FACTS 10
Executive Summary
Of all sugary drink and energy drink brands, TV ads for 5-hour
Energy were viewed most often by teens and second-most often
by children. Capri Sun, Kool-Aid, Sunny D, and Gatorade also
ranked among the top-five most-advertised products for both
age groups, followed by Coca-Cola Classic and Dr Pepper.
Six companies accounted for 90% of sugary drink and energy
drink ads viewed by youth in 2010: Kraft Foods, Innovation
Ventures, PepsiCo, Dr Pepper Snapple Group, Coca-Cola, and
Sunny Delight Beverages. PepsiCo was the only company for
which youth exposure to sugary drink ads declined from 2008
to 2010. In contrast, youth exposure to ads for Coca-Cola and
Dr Pepper Snapple Group sugary drinks, as well as 5-hour
Energy, approximately doubled for most young people during
this period.
We also analyzed the content of 201 ads that appeared on
TV in 2010. Ads for children’s fruit drink brands (Capri Sun,
Kool-Aid, and Sunny D) were a small portion of the total (9%),
and appeared to target both children and parents. The child-
targeted ads did not focus on the product itself, but rather
were full of humor and fun, and all used the product as a
prop, giving it an active role in the ads. Parent-directed ads
for the same brands had very different themes, including event
sponsorships and cause-related marketing. Kool-Aid and
Capri Sun ads directed at parents focused on selling points of
these products, such as hydration, nutrition, and value. Among
the general-audience ads in the analysis, ads for regular soda,
energy drinks, and sports drinks typically contained themes
with high youth appeal, including sporting and other events,
cause-related marketing, and opportunities for the viewer to
participate in marketing campaigns. Celebrities were often
featured, and product associations that portrayed the brands
as cool/hip and inspirational were prevalent. Ads for other
sugary drink categories, including fruit drinks, iced tea, and
flavored water, focused much more on features of the product
itself, such as taste and nutrition. Seven regular soda and
energy drink brands, as well as Vitamin Water, had numerous
local sponsorship ads, which repeated many of the messages
and tactics seen in national advertising, but promoted specific
local causes and events.
Two-thirds of the beverage brands included in this report also
made appearances during prime-time TV programs in 2010,
totaling 2,196 beverage brand appearances (i.e., product
placements). Sugary drinks and energy drinks comprised 91%
of these appearances. Regular soda was the most commonly
appearing beverage category, dominated by one brand: Coca-
Cola Classic. Notably, Kool-Aid and Diet Coke were the only
children’s and diet drink brands ranked in the top ten for screen
time devoted to appearances. Coca-Cola Classic was the only
sugary drink brand with appearances that were viewed by large
numbers of young people: children and teens saw 15 and 20
Coca-Cola Classic brand appearances in 2010, respectively.
On the radio, teens heard almost 100 ads for sugary drinks and
energy drinks in 2010, 17% more than adults heard. Coca-Cola
Classic and Dr Pepper were advertised the most, followed by
Mountain Dew and Crush. Teens had the highest exposure to
Monster energy drink and Mountain Dew ads relative to adults.
Internet advertising
Children and teens frequently visited sugary drink and energy
drink websites. The top-ranking website, MyCokeRewards.com,
averaged more than 170,000 unique young visitors per month,
each spending more than nine minutes on the site per month.
One website for a children’s brand, KraftBrands.com/CapriSun,
had content exclusively targeted to children, and Fanta.com,
a soda website, targeted youth on nearly three-quarters of its
pages. Many of the energy drink websites appeared to target
male youth with tie-ins to extreme sports and images of sexy
women. Nearly all other websites featured content that would
appeal to a broad general audience, including children and
teens. Many of these general audience sites promoted the
brand using youth-oriented techniques, such as fun and cool/
hip messaging, as well as multiple engagement techniques.
While visitors were exposed to many specific drink products
on the sites, direct selling points were rarely used to promote
the products. Instead, promotions and sponsorships appeared
frequently on the websites, often for sports and celebrities, and
many included incentives for purchasing the products. The
one child-targeted site, Kraft Brands’ Capri Sun site, differed
from the general audience sites with its focus on branding
only, humor, and engagement, and less of an emphasis on
promotions and sponsorships. Nearly 70,000 young people
visited Capri Sun’s website every month.
The main point of the majority of sugary drink banner ads
on third-party websites was to advertise a promotion. Most
promotions were in the form of a sweepstakes or giveaway
and encouraged viewers to enter a competition to win prizes
and money. Reference to a specific product, brand, and/or
company was made less often. Banner ads for Coca-Cola’s
“My Coke Rewards” promotion appeared most often on youth
websites. Coca-Cola also frequently advertised Coca-Cola
Classic and other sugary drinks on youth websites. Three
additional soda brands, Pepsi, Mountain Dew, and Dr Pepper,
were among the top-six products advertised most frequently
in banner ads on youth websites. Although just three brands
– Capri Sun, Kool-Aid, and Sunny D – had content specifically
targeted to children, banner advertisements often featured
content that would appeal to a broad audience, including both
children and teens. More than 50% of banner ads for Crush and
Sunkist soda appeared on youth websites. Bright, engaging
Flash media was used often, as were social media and creative
applications.
Marketing in social and mobile media
Social media was widely used as a marketing vehicle in 2010
by sugary drink and energy drink brands. These platforms
are increasingly popular among children and teens and allow
marketers a way to offer up highly interactive and engaging
Sugary Drink FACTS 11
Executive Summary
experiences. Although sugary drink brands varied in their use
of specific engagement devices in social media, all brands did
employ them. These devices encouraged fans and followers to
interact with their products through photos, videos, contests,
and other enjoyable diversions.
The energy drinks, Red Bull and Monster, were frequent
advertisers in social media. Across all three platforms we
investigated—Facebook, Twitter, and YouTube—these brands
maintained a strong presence through frequent updates
of engaging content. With the exception of 5-Hour Energy,
energy drink brands did not market the beverages themselves,
instead relying on their rosters of athletes and extreme sports
sponsorships to communicate their brands’ identities and
senses of edginess and athleticism. Regular soda also was
well-represented on social media. Coca-Cola had the most fans
and followers on Facebook and Twitter of any brand and ranked
second to Red Bull in the number of YouTube views. Pepsi, Dr
Pepper, and Sprite also aggressively used social media to
communicate with consumers and acquired sizable followings.
While precise content and tactics varied by brand, all regular
soda pages promoted interactive content, such as videos and
contests. Gatorade was the sports drink that used social media
the most, promoting its sports sponsorships, webisodes, and
athlete endorsers. Conversely, children's brands were relatively
absent from social media, with only Kool-Aid and Sunny D
maintaining a presence on Facebook and Sunny D on Twitter.
Though not yet universally adopted, mobile marketing is
becoming increasingly popular. Like social media, advertising
through mobile media is highly interactive and often highly
entertaining. Eight regular soda and energy brands in our
analysis participated in mobile marketing. Red Bull and Coca-
Cola were by far the leading mobile advertisers, offering a
roster of popular iPhone applications for download and placing
banner ads on mobile websites. Six iPhone applications (of
only eight in our analysis with wide distribution) had a user base
of at least 25% 12- to 17-year olds. Furthermore, Coca-Cola
used text messaging to communicate with consumers about
its “My Coke Rewards” program, making the brand the leading
sugary drink advertiser in the mobile space.
Targeting black and Hispanic youth
We also found evidence of sugary drink and energy drink
marketing targeted to black and Hispanic youth. Black children
and teens viewed 80 to 90% more TV ads for these drinks
in 2010 compared with their white peers. This difference is
partially explained by their greater TV viewing times; however,
some brands reached black youth disproportionately more
often than white youth and/or contained messages likely to
appeal to them specifically. For example, black teens and
children viewed 2.5 to 3 times as many ads for Sprite as
compared with white youth, and four of six Sprite ads featured
black main characters. Black youth also viewed more than
2.5 times as many ads for Vitamin Water, which featured the
rapper 50 Cent in one of its ads. At the company level, black
teens viewed more than twice as many sugary drink ads for
Coca-Cola, and black children viewed more than twice as
many PepsiCo sugary drink ads, compared with white youth.
In addition, a few brands (Coca-Cola Classic, 7 Up, and
Vitamin Water) showed much higher increases in the number
of ads viewed by black teens from 2008 to 2010 compared
with changes in exposure by white teens.
On the internet, 16 of the 43 websites we examined were visited
by black youth at least 25% more often compared with white
youth, including 43% of Coca-Cola’s websites. Black youth
visited SpriteStepOff.com nine times more often than did white
youth. In addition, 33% of pages on Pepsi.Com contained
messages with special appeal to blacks (e.g., its “Pepsi We
Inspire” campaign featuring images of black women and
celebrities), and 43% of pages on Sprite.com and 82% on
Gatorade.com primarily featured black actors.
Most sugary drink and energy drink brands did not have a
significant presence on Spanish-language TV or radio. Just 8 of
the 32 brands in our analysis with advertising in 2010 advertised
on national Spanish-language TV, and 15 advertised on local
Spanish-language radio. One brand, Coca-Cola Classic,
accounted for approximately one-third of young people’s
exposure to advertising in these media. Kool-Aid was the only
beverage brand to advertise directly to children or parents
on Spanish-language TV, although one Coca-Cola Classic ad
depicted a parent serving the product to her child. Several
regular soda and energy drink brands had youthful themes
in their advertising, including one-third of Spanish-language
TV ads which featured fútbol. In addition, seven regular soda
and energy drink brands sponsored local Latino events or
causes that were promoted on local Spanish-language TV,
including the “Pepsi Refresh” campaign. The only website with
a substantial number of messages targeted to Hispanics was
Kraft Foods’ Kool-Aid site; these messages appeared on one-
half of pages, including messages to parents that the product is
more affordable and has less sugar than soda. DrPepper.com
also featured Spanish-language and other content targeted to
young Hispanics.
Most Spanish-language ads on TV and radio were viewed or
heard more often by Hispanic adults than by young people,
with a few exceptions: teens heard six times as many Mountain
Dew ads and three times as many SoBe Lifewater and Amp ads
on Spanish-language radio compared with adults. Compared
with non-Hispanic preschoolers, Hispanic preschoolers saw
disproportionately more Spanish-language TV ads for Coca-
Cola Classic and Powerade. This youngest age group viewed
more ads on Spanish-language TV than did children or teens. In
addition, young people viewed 33 to 99% more ads for sugary
drink categories on Spanish-language TV in 2010 than in 2008.
Sugary Drink FACTS 12
Executive Summary
Marketing in stores
We also examined marketing messages on product packages
and promotions inside stores. Child features were found most
often on fruit drink and soda packaging, although overall, just
15% of packages included child features. However, promotions
were common on sugary drink packages, with 28% of products
featuring at least one promotion. Iced tea had the most
promotions of any beverage category (48% of products), and
one-third or more of regular soda, sports drinks, and children’s
fruit drinks had promotions. Ingredient claims appeared on the
majority of packages in every drink category and were most
common on flavored water, energy drinks, and fruit drinks. Most
ingredient claims referred to the specific vitamins, minerals,
electrolytes, antioxidants, or novelty ingredients contained
in products. Products in all drink categories, except energy
drinks, were likely to feature statements about natural or real
ingredients. Light drinks were more likely to contain calorie
claims than full-calorie drinks, most notably on light fruit drinks.
Of note, 14% of full-calorie regular soda cans provided calorie
information on the front of the can.
Retailer promotions were widely used to market sugary drinks
and energy drinks in 2010; and these promotions accounted
for 22% of all sales of the brands in our analysis. Food stores,
in particular, used promotional activity to convince shoppers to
purchase products from these brands. Retailer promotions at
convenience stores, particularly for energy drinks, were also
common. A variety of promotional techniques were employed
by brands in retail outlets; while the precise combination of
techniques varied by category, all relied on some combination
of price promotions, special displays, and published features.
Conclusions
One 8-ounce serving of the typical full-calorie soda, energy
drink, or fruit drink contains 110 calories and 27 to 30 grams
of added sugar, 160% or more of the recommended amount
of sugar that most children and teens should consume in an
entire day.
20
One 20-ounce bottle of regular soda or energy
drink contains 275 calories and 68 to 75 grams of sugar, twice
the daily recommended amount for an adolescent boy. Even
though children’s fruit drinks often come in smaller 6- to 7-ounce
containers, two-thirds of these drinks contain more than 15
grams of sugar, the maximum amount that children should
consume in a day, and one-third contain 20 grams or more.
Flavored water, sports drinks, and iced teas are somewhat lower
in sugar than other sugary drink categories, but still contain as
much as 19 grams of sugar per serving. In addition, sugary
drinks often contain artificial sweeteners, artificial colors, and
significant amounts of caffeine and sodium.
Even though children and teens should rarely, if ever, consume
the sugary drinks and energy drinks analyzed in this report,
beverage companies continue to market them aggressively in
virtually every medium where young people spend their time:
TV, radio, websites, social media, smartphones, local retailers,
and community events. Marketing in all forms of media used
strategies with strong appeal to young people designed to
make the brands appear cool and hip, associating them
with celebrities, popular music, and extreme sporting events.
Promotions that encouraged consumer engagement with the
brand and rewarded young people for purchasing the products
also received significant media support.
Just three fruit drink brands advertised directly to children on
TV – Capri Sun, Kool-Aid, and Sunny D. However, we found
numerous examples of brands that appeared to target teens
and black and Hispanic youth directly. Regular soda brands,
including Coca-Cola, Dr Pepper, Pepsi, Mountain Dew, 7 Up,
and Sprite were consistently among the brands seen or heard
most often by children and teens. Among energy drinks, 5-hour
Energy advertised extensively on TV, and Red Bull and Monster
ranked among the top three in social media presence. Vitamin
Water and Gatorade rounded out the list of brands marketed
most often to young people.
Recommendations
The young people whom sugary drink companies view as an
opportunity to grow their business are also the first generation
expected to live shorter lives than their parents due to obesity
and related diseases.
21
If beverage companies want to
convince the public that they can protect the health of young
people through their own voluntary actions, they need to do
better.
Beverage companies must change their current practices that
expose children and teens to enormous amounts of highly
persuasive marketing for harmful products:
■
Instead of sugary drinks, develop and market child-friendly
products with less added sugar and no artificial sweeteners.
■
To ensure that consumers know what’s inside the drinks
they buy, make nutrition and ingredient information easily
accessible, including disclosing caffeine content online
and on product packages, and indicating sugar content
and artificial sweeteners on the front of packages.
■
Discontinue the potentially misleading practice of
highlighting nutrition-related claims on the front of packages,
without similarly disclosing information about nutrients to
limit (including sugar) and other less desirable ingredients.
■
Remove all sugary drinks, including sports drinks, from sale
in elementary, middle, and high schools, as well as other
locations visited disproportionately more often by children
and teens.
■
Stop targeting teens with marketing for sugary drinks and
other caffeinated products.
Sugary Drink FACTS 13
Executive Summary
Parents and other consumers can also make changes to
encourage beverage companies to improve their marketing
practices:
■
Parents can stop serving sugary drinks, including fruit
drinks, soda, sports drinks, and flavored water, to their
children. The American Academy of Pediatrics advises
parents to regularly serve their children (2 years and older)
only water, low- or non-fat plain milk, and small portions of
100% juice as beverages.
22
They recommend no more than
4 to 6 ounces of 100% juice per day for children (1-6 years),
and 8 to 12 ounces per day for older children.
■
Parents should read the labels of children’s fruit drinks and
other sugary drinks to check for sugar, artificial sweeteners,
and caffeine and juice content. Keep in mind that 4 grams
of sugar equals one teaspoon, and most children should
not consume more than 15 grams of added sugar per day.
■
Contact beverage companies and tell them to stop
marketing sugary drinks directly to children and teens.
Companies are unlikely to change their marketing practices
unless consumers show them that it is the right thing to do for
their business, as well as the health of our nation’s children.
Sugary Drink FACTS 14
According to the American Heart Association,
“Soft drinks and other sugar-sweetened beverages
are the primary sources of added sugars in
Americans’ diets.”
1
Numerous studies of sugary
drink consumption and its effects provide evidence
that they contribute to the obesity crisis more than
any other type of food or beverage. “There is no
reason to give a child a soda or sugar-sweetened
drink. Teens drink these beverages because
they taste good, give an energy boost and they
feel cool drinking them. The powerful influence
of marketing and the targeting of young people
cannot be ignored here.”
2
The negative health effects of consuming sugary drinks are
well documented. Consumption is positively associated with
increased calorie consumption, body weight and diet-related
health issues, as well as poor overall nutrition and tooth decay
in young people.
3,4
Associated caffeine consumption may also
lead to increased anxiety, withdrawal, and sleep difficulties.
The U.S. Centers for Disease Control and Prevention (CDC),
5
U.S. Department of Agriculture (USDA),
6
Institute of Medicine
(IOM),
7
American Academy of Pediatrics,
8
American Medical
Association (AMA),
9
American Heart Association,
10
and World
Health Organization (WHO)
11
have all called for reduced
consumption of added sugars, including from sugary drinks.
Nevertheless, companies spend more on marketing targeted
directly to children and adolescents for beverages than
for any other food category,
12
and the majority of beverage
advertising promotes sugary drinks.
13
Adolescents consume
more sugary drinks than any other age group.
14
Marketing for
sugary drinks may also disproportionately target racial and
ethnic minorities and youth from lower-income families. These
youth consume more sugary drinks and are at higher risk of
obesity and related diseases.
15
The American Beverage Association claims that “sugar-
sweetened beverages are not driving health issues like
obesity and diabetes.”
16
The trade association for the largest
beverage companies points to recent declines in sugary drink
consumption and sales, as well as data showing that these
products contribute just 7% of calories in the diets of the
average American. It also states that the number of beverage
calories in the market has decreased by 21% in the past 10
years, “due in part to industry’s innovation in bringing more
no- and low-calorie beverage options to market.” From 2005
to 2010, per capita consumption of carbonated soft drinks
declined by 13% (from 824 8-ounce servings per year to 715),
and fruit drink consumption went down 17% (222 to 184 8-oz
servings).
17
While these are small steps in the right direction,
every individual in the United States continues to consume
on average more than three 8-oz servings of carbonated
soft drinks, fruit beverages, teas, sports drinks, enhanced
water and energy drinks every day. Much stronger action
by the beverage industry is needed to protect children and
adolescents, especially from marketing that encourages them
to consume products that can damage their health.
18,19,20
Aims and context
The purpose of this report is to document the amount and
impact of sugary drink marketing directed at children and
adolescents. The work is funded by a grant from the Robert
Wood Johnson Foundation to the Rudd Center for Food Policy
and Obesity at Yale University. The goal of this work is to
highlight both helpful and harmful industry practices. In 2009,
the Rudd Center published the Cereal FACTS report, which
provided a thorough review of cereal marketing targeted to
children and adolescents (www.CerealFACTS.org). In 2010,
Fast Food FACTS contained the most comprehensive analysis
of menu items and marketing practices of the top 12 fast food
restaurants and young people’s fast food purchases (www.
FastFoodMarketing.org). We now focus on the sugary drink
category.
Sugary Drink FACTS quantifies the nutritional content and full
array of marketing practices that promote sugary drinks to
children and adolescents. The data presented in this report
provide a means to evaluate current marketing practices and
offer a metric against which future changes can be monitored.
Introduction
Numerous research studies demonstrate that sugary drinks harm young people’s health
■
Sugary drinks contribute 22% of empty calories consumed by young people
21
■
Soda is the #1 source of calories in teens’ diets
22
■
Children consumed 20% more calories from sugary drinks in 1999-2004 than they did 10 years earlier
23
■
Drinking just one 8-oz sugary drink per day increases a child’s odds of becoming obese by 60%
24
■
Companies spend more to market sugary drinks to children and adolescents than any other food category
25
■
Exposure to sugary drink ads is associated with higher overall sugary drink consumption among children
26
■
Beverage companies openly target teens with their marketing programs
27
■
Beverage companies have indicated that they view Hispanics and blacks as a source of future growth for their sugary drink
products
28,29
Table 1. Why sugary drinks?
Sugary Drink FACTS 15
We incorporate the same media measurement data used
by advertisers to quantify exposure to TV advertisements
and product placements, radio advertisements, and digital
marketing. We also include market research data used by the
industry to monitor competitors’ product sales and in-store
promotional activities. In addition, we conducted our own
quantitative and qualitative research when syndicated data
were not available. When possible, we evaluate differences
by target populations, focusing on children, adolescents, and
black and Hispanic youth. We also examine youth exposure
to more healthful beverage categories (100% juice and plain
water) and diet drinks, as well as trends from 2008 to 2010. The
objective is to provide a transparent, science-based evaluation
of the amount and content of sugary drink marketing to children
and adolescents.
This analysis is the most extensive evaluation of sugary drink
products and marketing ever undertaken. We focused our data
collection on nationally available beverage brands that were
also marketed in any national media in 2010. We define sugary
drinks as regular soda, fruit drinks, sports drinks, flavored
water, energy drinks and iced teas that contain added sugar.
Why sugary drinks?
Children and adolescents in the United States consume too
many sugary drinks. Approximately 40% of young people’s
total calories are “empty calories” (i.e., calories from solid fat
and added sugars), and approximately one-quarter of empty
calories are from soda and fruit drinks (averaging 173 kcal
per day).
30
Soda is the third highest source of all calories in
young people’s diets, behind grain desserts and pizza, and the
number-1 source for adolescents ages 14 to 18.
31
Approximately
70% of boys and 60% of girls ages 2 to 19 consume at least
one sugary drink on any given day.
32
Preschoolers, children
and adolescents consume on average 124, 184, and 301
calories, respectively, in sugary drinks every day, representing
7 to 13% of their total calorie intake.
33
Soda contributes 55% of
calories from sugary drinks consumed by all youth, followed
by fruit drinks (37%) and sports drinks (3%), but the types of
sugary drinks consumed changes with age. Approximately
two-thirds of sugary drinks consumed by teens are sodas,
compared with one-half of those consumed by children ages
6 to 11. In contrast, fruit drinks comprise more than one-half of
preschoolers’ sugary drink intake.
From the 1970’s through 2004, consumption of sugary drinks
steadily increased among children and adolescents.
34,35
During
1999-2004, young people consumed 10% more calories from
sugary drinks on average, compared with 1988-1994. The
greatest increase was found among children ages 6 to 11 who
consumed 20% more sugary beverages in 1999-2004.
36
A
more recent study shows a decline in Americans’ consumption
of added sugar between 1999-2000 and 2007-2008. This
decline was largely due to a reduction in soda and fruit drink
consumption.
37
However, added sugar continues to comprise
17% of calories consumed by children and adolescents ages
6 to 17, and sugary drinks contribute approximately one-
half of adolescents’ and one-third of children’s total sugar
consumption.
Increases in sugary drink consumption have also been greater
among demographic groups most at risk for obesity and
related diseases, including black non-Hispanic and Mexican-
American youth and those in lower-income households.
38,39
Whereas sugary drink consumption remained stable among
white non-Hispanic adolescents from 1988-1994 to 1999-
2004, consumption by black adolescents increased by 11%
and consumption by Mexican-American teens increased
by 22%.
40
Sugary drinks now contribute 8.5% of black non-
Hispanic children’s and adolescents’ total calories compared
to 7.7% of calories for white non-Hispanic youth.
41
Sugary
drink consumption also rose by 15% for lower-income teens
compared with a 2% increase for their higher-income peers;
42
and consumption is significantly lower among youth in high-
income households (6.7% of total calories vs. 8.2% for youth in
middle- and lower-income households).
43
Increases in sugary drink consumption have been linked
to rising rates of obesity. For every 8 ounces of sugary
drinks consumed daily (approximately 94 kcal), a child’s
odds of becoming obese increase by 60%.
44
Sugary drinks
account for an estimated 20% or more of the weight gain that
occurred in the U.S. population during the past 30 years.
45
Obesity also increases rates of hypertension, cardiovascular
disease, diabetes, depression, and breast cancer,
46,47
and
the sweeteners found in these beverages are linked to dental
decay, overweight, and type-2 diabetes.
48,49,50
Furthermore,
individuals do not decrease their energy intake to compensate
for calories consumed in the form of sugary drinks, resulting
in increased total energy intake when calories come from
beverages instead of solid foods.
51
Marketing to young people
Sugary drinks contain many calories, but no nutritional value.
Given the health risks associated with their consumption, young
people should be actively discouraged, not encouraged,
to consume these products. Yet encouraging consumption
is precisely the purpose of beverage marketing. Extensive
literature reviews by both the IOM
52
and the WHO
53
conclude
that food marketing to youth increases their preferences for
the energy-dense and nutrient-poor products most commonly
promoted, and likely contributes to poor diet and rising obesity
rates. More recent research demonstrates that marketing of
unhealthy food products also affects much more than brand
preferences and requests to parents; marketing can increase
total caloric intake, taste perceptions of advertised products,
and social norms about consuming unhealthy but great-tasting
foods.
54
A study of children’s exposure to TV advertising
for carbonated beverages showed that consumption of
carbonated beverages increased by 9.4% with every 100
Introduction
Sugary Drink FACTS 16
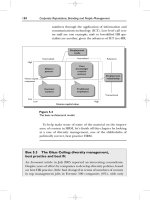
Figure 1. Beverage industry expenditures on youth-targeted marketing programs in 2006
* Includes websites, internet, digital and viral/word-of-mouth
Source: FTC (2008)
incremental ads viewed.
55
Therefore, exposure to beverage
advertising has likely fueled the substantial increases in sugary
drink consumption by young people.
In 2006, beverage companies spent more than $600 million
on marketing programs specifically targeted to children and
adolescents; three-quarters of these expenditures promoted
carbonated beverages (i.e., soda) (see Figure 1).
56
In 2007,
74% of TV beverage ads viewed by children were for products
high in added sugar.
57
Beverage companies appear to be changing their marketing
strategies to reach young people. From 2003 to 2009, children’s
exposure to beverage advertisements on TV fell more than
40%.
58
But this does not mean companies have ceased
marketing to this age group. Unlike other food categories,
beverage companies spend a smaller proportion of their youth-
targeted marketing budgets on TV advertising (23% vs. 46%
for all food companies). Instead, they spend more on less
traditional forms of marketing, including in-school and in-store
marketing, events, and product placements, as well as radio
advertisements.
Carbonated beverage companies also spend a somewhat
larger portion of their marketing budgets on youth-targeted
programs (33%) compared with the food industry as a whole
(27%).
59
In addition, beverage companies use some types
of marketing primarily to target young people. These include
radio (60% of radio spending is youth-targeted), packaging
and labeling (60%), events (82%), product placements (67%),
in-school marketing (68%) and philanthropy, or cause-related
marketing (51%).
Larger portions, lower prices, increased desire for on-the-go
products, and 24-hours-a-day access to retail outlets also likely
contribute to increases in consumption of sugary drinks.
60,61,62
The average serving size has increased from 6.5 fluid ounces
in the 1950s to 13 ounces in 1996 and 20 ounces today.
63,64
Sugary drinks are among the most inexpensive forms of readily
available calories.
65,66
For example, the price of fruits and
vegetables went up by 158% from 1982-84 to 2002, whereas
the price of sugary drinks rose by just 26%.
67
The majority of
sugary drinks are purchased in supermarkets and general
merchandisers (48%), followed by restaurants (20%) and
convenience stores and vending machines (each 12% or
less). Schools also remain an outlet to purchase sugary drinks.
Approximately one-half to three-quarters of middle and high
schools receive a percentage of soft drink sales and 38 to 57%
have exclusive contracts with these companies.
68
Sugary drink
consumption occurs about equally in the home and away from
home (52% and 48%, respectively).
69
Targeting minority youth
Black and Hispanic youth face higher risk for obesity and
related diseases, yet sugary drink companies openly target
minority groups. Coca-Cola, for example, recently proclaimed
that roughly 86% of its future growth will come from Hispanics,
blacks and Asians.
70
The company has identified black youth
Introduction
All other
Philanthropy
Product placements
Packaging/labeling
Athletic sponsorships
Digital*
Radio
Events
In-store
TV ads
In-school
$25
$0
$50
$75
$100
$125
$150
$175
■
Juices and other beverages
■
Carbonated beverages
Sugary Drink FACTS 17
Introduction
specifically as a growth market because of their purchasing
power and influential trendsetting,
71,72
PepsiCo recently
identified Hispanic consumers as a growth market because
they are “getting wealthier and spending more on …beverages
than the average consumer.”
73
PepsiCo reaches Latino youth in
their communities specifically through PepsiMusica, a bilingual
entertainment program.
74,75
Independent research also indicates that sugary drink
companies target minority populations. For example, soda
advertising appears more often in prime-time TV programming
viewed by black versus white audiences,
76,77
and lower-
income black and Latino neighborhoods contain more outdoor
advertisements for sugary drinks compared with white and
higher-income neighborhoods.
78
Although exposure to sugary
drink advertising on TV has decreased over time, this decline
has been smaller for black youth than for white youth.
79
Industry initiatives
The beverage industry appears to acknowledge that marketing
sugary drinks to children is no longer acceptable. In May 2006,
The Alliance for a Healthier Generation, which was founded
by the American Heart Association and the William J. Clinton
Foundation, worked with the American Beverage Association,
Coca-Cola, PepsiCo, and Dr Pepper Snapple Group (formerly
Cadbury Schweppes) to establish the Alliance School
Beverage Guidelines. The guidelines limit portion sizes and
reduce the beverage calories available to children during the
school day.
80
In 2007, leading beverage companies joined the
Children’s Food and Beverage Advertising Initiative (CFBAI) to
shift their advertising directed at children ages 2 to 11 to lower-
calorie and more healthful options.
81
Through the CFBAI, Coca-
Cola and PepsiCo have pledged not to promote carbonated
soft drinks in child-targeted advertising, and Kraft Foods has
pledged to market only beverages that meet Kraft's nutrition
standards.
82
While these industry initiatives represent a first step to reducing
young people’s consumption of sugary beverages, further
improvements are needed. For example, three years after the
Alliance for a Healthier Generation guidelines were introduced,
the number of beverage calories shipped to schools had
declined by 88% compared to pre-agreement levels. However,
an estimated 125 billion calories from sugary drinks remained
for sale to students.
83
Similarly, the CFBAI restricts advertising
by participating companies in child-directed advertising
in traditional media (TV, radio and magazines), product
placements, and the internet; however, children continue to
view a significant amount of advertising in media that do not
qualify as child-directed under the CFBAI, including ads on
prime-time TV programming;
84
product placements on prime-
time TV, such as American Idol;
85
and company websites.
86
Another critical loophole in the CFBAI pledges is that they do
not address other youth-targeted forms of marketing, such as
events, product packaging, and retail promotions.
87
In addition,
the program is voluntary, and some of the largest beverage
advertisers, including Dr Pepper Snapple Group and Sunny
Delight Beverages, have declined to join. Finally, companies
have not pledged to reduce advertising to the age group with
the highest consumption of sugary beverages: adolescents. In
fact, Coca-Cola has declared that it specifically targets teen
consumers, who represent an opportunity for future business
growth.
88
On creating a transparent, open, and
objective process
This report addresses the need for comprehensive, reliable and
current information about sugary drink products and marketing
practices. The data presented in this report and our methods
are described in detail. We use the best available syndicated
marketing data and strategic studies to fill important gaps
in knowledge. We developed the scope of the report and
collected information for it based on detailed reviews of the
literature and discussions with experts in the field, including
with the nutrition, marketing, and public health experts who
serve on our advisory committee.
Despite our best efforts, we acknowledge that no piece
of scientific work is perfect. We learned a great deal from
developing the Cereal and Fast Food FACTS reports and have
incorporated feedback from them to build upon and improve
the research methods for Sugary Drink FACTS. Although we
provide a thorough evaluation of sugary drink marketing to
young people, it is not possible to quantify all types of marketing
targeted to them and evaluate their impact. For example, we
could not quantify the amount of spending on competitive food
and beverage contracts with schools, as these agreements are
proprietary. We invite further feedback from interested parties
as we continue to refine our methods and update our data to
make the information as valid and accurate as possible.
Sugary Drink FACTS report
In this report, we document the nutritional content and marketing
of sugary drinks to young people. We first present the nutritional
quality of sugary drinks, focusing on sugar and caffeine content,
and new beverage products introduced in the past two years.
We also provide data on sales by product category. We then
examine sugary drink marketing in traditional media, including
media spending, TV, and radio advertising, and TV product
placements. The next section details marketing practices
in newer media, including beverage company websites,
advertising on third-party websites, social media (Facebook,
Twitter and YouTube), and mobile marketing. Finally, we present
data on marketing in stores, including product packaging
and retail promotions. We utilized syndicated data when
available, including data from Nielsen, comScore, Arbitron and
SymphonyIRI, and supplemented this information with our own
studies to quantify the extent of these marketing practices.
Sugary Drink FACTS 18
In addition, we conducted content analyses of the different
forms of marketing to assess target audiences, messages, and
techniques presented in the advertisements. When data were
available, we also present evidence of marketing targeted to
black and Hispanic youth.
This research is detailed in the following pages and organized
into five sections:
■
Methods detail the data sources, procedures, and calcula-
tions used to collect and analyze the data;
■
Results present the detailed findings of each of these anal-
yses;
■
Conclusions summarize the findings and discuss implica-
tions and recommendations for changes in sugary drink
marketing to young people;
■
Ranking Tables compare the nutritional content and mar-
keting practices of different brands and beverage compa-
nies; and
■
Appendices provide the detailed data that are summarized
in the Results.
Introduction
Sugary Drink FACTS 19
Methods
We used a variety of data sources and methods
to provide the most comprehensive and objective
analysis possible of the U.S. sugary drink market.
These data enabled us to thoroughly document
and evaluate the nutritional quality and marketing
practices of the most widely distributed sugary
drinks.
Our methods include analyzing the nutritional quality of sugary
drink products; evaluating new product introductions using
the Product Launch Analytics database from Datamonitor;
analyzing data on media exposure and spending from
syndicated sources (i.e., Nielsen, comScore Inc., and Arbitron
Inc.); conducting content analyses of TV advertisements,
company websites, internet banner advertising, social and
viral media, mobile marketing applications, and product
packaging; and documenting product category sales and
in-store promotions using sales data from SymphonyIRI. We
supplemented these analyses by collecting information from
company websites, monitoring the business and consumer
press, visiting supermarkets and other retailers, and calling
consumer helplines.
We did not have access to food industry proprietary
documents, including privately commissioned market
research, media and marketing plans, and other strategic
documents. Therefore we do not attempt to interpret beverage
companies’ goals or objectives for their marketing practices.
In this report, we document: 1) sugary drink and energy drink
products, including new product introductions, and their
nutritional quality; 2) the extent of children’s and adolescents’
exposure to the most widely used forms of sugary drink
marketing, including exposure by black and Hispanic youth;
3) the specific products promoted and marketing messages
conveyed in traditional media, new media, and product
packaging; and 4) sales by product category and type,
including incremental sales from in-store promotions.
Scope of the analysis
This analysis includes nutrition, sales and marketing data for
nationally distributed sugary drink products from the major
beverage companies in the United States. We define sugary
drinks as non-alcoholic beverages with added sugar in their
ingredients. Similar to previous analyses of sugary drink
consumption, we included regular sodas or pop, fruit drinks,
sports drinks, energy drinks, flavored water, and sugar-
sweetened iced teas.
1
Dairy-based products and mix-ins,
smoothies, protein drinks, weight-loss and diabetic products,
hot beverages, and coffee drinks are not included.
The data reflect product formulations as of March 31, 2011
and marketing practices from January 1 to December 31,
2010, unless otherwise noted. In some analyses, we also
provide comparisons with data from 2008 and 2009. This
timeframe captures product reformulations and marketing
programs in place subsequent to companies’ implementation
of the Children’s Food and Beverage Advertising Initiative
(CFBAI).
2
The sugary drink market continues to evolve; the
information presented in this report does not include new
products or product reformulations introduced after March
31, 2011, and advertising campaigns or other marketing
programs introduced in 2011.
The marketing practices analyzed represented approximately
two-thirds of beverage company expenditures on marketing to
children and adolescents in 2006. They include TV advertising
(23% of total expenditures); in-store marketing and packaging/
labeling (16%); event and cause-related marketing and sports
sponsorships (16%); and radio advertising (7%).
3
In addition
to advertising in traditional media and in-store marketing,
we also analyze newer forms of digital marketing, including
internet and mobile marketing. Although these forms of
marketing represented just 4% of beverage company youth-
targeted marketing in 2006,
4
they are relatively inexpensive
compared to traditional media and their use has expanded
exponentially in the past few years.
5,6
The only major form of sugary drink marketing not included in
this report is in-school marketing, which contributed 26% of
beverage company youth-targeted expenditures in 2006.
7
The
Federal Trade Commission (FTC) report notes that the majority
of these expenditures consisted of “payments made or items
provided to schools under ‘competitive’ food and beverage
contracts.” It was not feasible to obtain these documents;
therefore, we could not monitor this form of marketing.
We conducted the marketing analyses at three levels:
■
Category describes the type of beverage (e.g., regular
soda, sports drink). The beverage categories in this
report include products that tend to be grouped together
in industry reports and previous research on sugary drink
consumption. In some cases, we also classified products
into subcategories to identify those with similar nutritional
properties or marketing characteristics.
■
Company refers to the company that is listed on the product
package or that owns the official website for the product. In
a few cases, the distributor is different than the beverage
producer (e.g., Rockstar energy drinks are produced by
Rockstar, but distributed by PepsiCo). We categorized
these products under the producer and not the distributor.
■
Brand references the marketing unit for each beverage.
Brands may include numerous flavors or varieties of the
same product (e.g., Vitamin Water Focus, Vitamin Water
Essential). Brands can have products in multiple categories
or subcategories (e.g., Capri Sun fruit drinks and Capri
Sun Roarin’ Waters flavored water, Ocean Spray full-calorie
and reduced-calorie fruit drinks). In cases where different
versions of a brand had very different marketing campaigns
Sugary Drink FACTS 20
Methods
(e.g., Pepsi Max and Diet Pepsi, Welch’s Essentials and
Welch’s other fruit drinks), we categorized them as separate
brands.
In some cases, we also present data on individual products or
varieties within a brand.
■
Product describes each specific variety and flavor of drinks
offered by each brand.
■
Variety describes a product name or other feature that
characterizes a group of products within a brand (e.g.,
Kool-Aid Singles, Bursts, and Twists; Minute Maid light fruit
drinks).
The purpose of this report is to examine the nutritional content
and marketing of sugary drink products to youth. Although
we collected data for all nationally distributed beverages
produced by the companies examined, the analyses focus
on beverages that contain added sugar. In some analyses,
we provide information on healthier (100% fruit juice and
plain water) and diet (i.e., no sugar, artificially sweetened)
beverages as a comparison with the data on sugary drinks.
Sugary drink products
To identify the products to include in the sugary drink analysis,
we first obtained a list from Nielsen of companies and brands
that advertised on TV in 2009 in the following Nielsen non-
alcoholic beverage Product Classification Codes (PCCs): drink
product, soft drink, regular soft drink, diet soft drink, drinks-
isotonic, bottled water, fruit drink, fruit juice, iced tea, drink
mix, iced tea mix, and drink mix-isotonic. We then conducted
a search of websites for the companies and brands found
in the Nielsen report to identify all non-alcoholic beverages
offered by these companies as of March 31, 2011. Following
collection of all marketing and sales data, we eliminated
brands for which we found no marketing activity during 2010
and that had less than $500,000 in sales nationally in 2010.
Beverage nutrition
For all beverages identified above, we collected nutrition and
ingredient information from the company or brand websites
during March 2011. If nutrition or ingredient information
was not disclosed online, we looked for the product at local
supermarkets and convenience stores in New Haven, CT
in April 2011. When products were not available locally, we
called company customer service helplines at least twice to
request the information. In some cases, we were unable to
obtain nutrition and/or ingredient information from any of these
sources.
Product categories
We identified beverages that contained at least 1 gram
of added sugar as indicated on the nutrition facts panel;
sources of sugar could be listed as sugar, high fructose
corn syrup, fruit juice concentrate, cane sugar, or sucrose.
These beverages were assigned to one of six sugary drink
categories as follows:
■
Regular soda includescarbonated sugar-sweetened soft
drinks. These products are also known as “pop.”
■
Fruit drinks are fruit-flavored and contain less than 100% or
no juice. These products are referred to by manufacturers
as juice drinks, juice beverages, fruit cocktails, and fruit-
flavored drinks. Powdered varieties (e.g., Country Time
Lemonade, Tang, Kool-Aid) are included in this category.
■
Flavored water includes non-carbonated drinks described
as a “water beverage” on the product container or that
include the word “water” in the name of the drink. Typically,
these products are clear and colorless.
■
Sports drinks are marketed as drinks that should
accompany physical activity. They carry the label “sports
drink” or explicitly convey that the beverage should be
consumed around physical activity, with phrases such
as “for athletes,” “pre-game fuel,” and “post-game
replenishment.” Powdered varieties of sports drinks are
included in this category.
■
Iced teas are primarily described as “iced tea” in the
description of the product, and include both ready-to-
serve and powder mixes. Tea-flavored beverages in other
categories are not included in this category unless the iced
tea products were advertised separately (e.g., Crystal Light
Iced Tea).
■
Energy drinks are labeled by the manufacturer as “energy
drinks” or “energy supplements” and contain high levels of
caffeine (typically 80 mg or more per serving). This category
includes carbonated, canned varieties as well as energy
shots. Although some energy drinks do not contain added
sugars (e.g., energy shots), we included all energy drinks
in this category as the American Academy of Pediatrics has
recommended that children and teens do not drink these
products due to their high levels of caffeine.
8
We also identified subcategories of sugary drinks based
on evidence of child-targeted marketing and the amount of
added sugar contained in the product.
■
Children’s products designate brands and products
promoted as intended specifically for children by the
company in its media advertising or on company websites.
Products with a name that contained the word “kid” were
also included in this category. Children’s products that
contained artificial sweeteners but no added sugar are
included as well.
■
Full-calorie drinks are the highest calorie drinks in a brand
line and do not include “light” or “diet” in the name. A few
brands had products with artificial sweeteners, but the
product name did not indicate it was a light product (e.g.,
Sugary Drink FACTS 21
Methods
Rockstar Mocha Roasted, Sunny D Tangy Original); these
were classified as full-calorie drinks.
■
Light drinks are lower-sugar, reduced-calorie versions of
full-calorie drinks. They typically include the words “light” or
“diet” in the name of the product. Light drinks may contain
artificial sweeteners in addition to sugar.
As a point of comparison with the sugary drink results, we
also analyzed marketing for additional beverages, including
both healthier products and artificially sweetened versions of
sugary drink brands.
■
100% juices are products that obtain all of their calories
from fruit or vegetable juice. These products are typically
labeled as “100% juice” on the package.
■
Plain water includes products labeled as “water” that
contain no additional ingredients and 0 calories.
■
Diet drinks contain artificial sweeteners and 0 grams of
added sugar. In our analysis, diet indicates an absence
of sugar but not necessarily an absence of calories. For
instance, some diet products may have a minimal number
of calories from other ingredients, including artificial
sweeteners. Unsweetened products, such as unsweetened
iced tea and powder mixes, are excluded from our analysis.
Nutrition facts and ingredients
We evaluated the nutritional quality of beverages according
to several criteria. We report calories, sugar, sodium, and
caffeine content for all sugary drinks and diet versions of
sugary drink brands within our specified categories. Fat, fiber,
and protein content are also presented. When the information
was available from the manufacturer, we also present the
specific ingredient content of each beverage, including
percent juice, artificial colors, and artificial flavors.
To standardize beverage serving sizes across all categories,
we report nutrition information for each beverage based on
an 8-ounce serving, unless the product was available in only
one size. For example, children’s fruit drink and flavored water
pouches typically come in 6- or 7-ounce sizes and energy
shots typically contain 2 to 2.5 ounces. Specific exceptions
are listed in the nutrition information presented in the Appendix
(Table A.1).
New product introductions
We identified new products introduced in 2009 and 2010 by
the companies in this report to assess beverage companies’
recent actions regarding the nutritional quality of their brands.
We used the Product Launch Analytics database offered by
Datamonitor. Datamonitor is a market research company that
provides data, analysis, and opinion across various sectors.
In our search of this database, we first identified new “soft
drinks” distributed in the United States in 2009 and 2010.
After these parameters were established, we narrowed our
search further to include only the brands in our analysis. We
then removed types of beverages outside the scope of our
analysis (e.g., 100% juice, smoothies, protein shakes).
Researchers assigned each new product to one of the
following categories:
■
New avors of existing products (e.g., strawberry version
of a product previously available in orange). These do
not differ significantly from existing products in nutritional
content or packaging.
■
Reformulations are modifications or new formulations that
change the nutritional quality and/or ingredients of existing
products. This category includes substitutions of sugar with
artificial sweeteners (reduction in calories) or substitutions
of high-fructose corn syrup with sugar, added vitamins or
other nutritional enhancements (e.g., protein, fiber), and
increases or reductions in caffeine.
■
New packaging includes changes in a single-serving size
of an existing product (either smaller or larger) and changes
in packaging type (e.g., drink offered in a new kind of can,
powder vs. ready-to-serve format).
■
Other marketing includes event sponsorships, cause-
related marketing, and new names for existing products.
■
New products are entirely new brands or varieties to the
company’s portfolio. They differ from existing products in
nutritional content and may represent a new drink category
for a brand (e.g., flavored water vs. existing fruit drink).
Changes to each of the new products were also coded as
being positive, negative, or neutral changes in the product’s
nutritional content, or marketing claims:
■
A positive change encourages less consumption of sugar
and/or caffeine. This could be achieved by offering smaller
single-serving packages, less sugar content (that was not
replaced with artificial sweeteners), or a reduction in caffeine.
Introductions of new children’s drinks that contain less sugar
and no artificial sweeteners are also positive changes.
■
A negative change encourages greater consumption
of sugar and/or caffeine. This could be achieved by
offering larger single-serving packages or adding caffeine.
Introductions of new sugary drinks or artificially sweetened
drinks specifically targeted to children are also coded as a
negative change.
■
A neutral change refers to products that are nutritionally
equivalent to existing products within the company’s
portfolio in sugar content, caffeine, and package size.
■
Marketing claims are reformulations that allow companies
to add new nutrition-related claims. Some examples include
the replacement of sugar with artificial sweeteners, the
replacement of high-fructose corn syrup with sugar, and the
inclusion of additional nutrients (e.g., Vitamin C).
Sugary Drink FACTS 22
Methods
New flavors of previously coded new products were not
coded twice as being a negative or positive change. For
example, Arizona offered a children’s version of its lemon-
flavored iced tea in 2009. This introduction was coded as
negative. However, subsequent introductions of different
flavors of Arizona KIDZ iced teas were coded as neutral as
these flavors did not represent a nutritional change from its
existing children’s brand.
Product sales
To identify and evaluate sales by beverage category, we
obtained data from SymphonyIRI, a leading provider of
market, consumer, and shopper intelligence whose clients
include more than 95% of the Fortune 500 consumer
packaged goods and retail companies. The firm’s InfoScan®
product is a scanner-based tracking service that collects
weekly retail information from representative samples of
grocery, drug, mass merchandiser, and convenience stores
across the United States. Collected data include records of all
products that are scanned in these stores during that week,
including each item’s price and record of sale. The records
are then transmitted to SymphonyIRI where they are reviewed
and error-checked. SymphonyIRI applies projection factors to
the sample stores to extrapolate total sales for retail chains,
markets, regions, and the total United States.
We licensed SymphonyIRI sales data for eight beverage
categories: aseptic juices (i.e., juices in single-serving
containers), shelf-stable bottled juices, refrigerated juices,
bottled water, carbonated beverages, sports drinks, energy
drinks, and drink mixes. These SymphonyIRI categories
incorporate all of the sugary drink and diet drink categories
in our analysis, as well as plain water and 100% juice, with
the exception of ready-to-serve iced tea. We received data for
each universal product code (UPC) within these categories
that had more than $500,000 in sales nationwide for the
calendar year 2010 ending December 26.
We obtained data for metropolitan and surrounding counties
in the following eight markets:
■
Dallas/Ft. Worth, TX
■
Baltimore, MD/Washington, DC
■
Los Angeles, CA
■
Chicago, IL
■
Boston, MA
■
Las Vegas, NV
■
Cleveland, OH
■
Birmingham/Montgomery, AL
We selected these markets to provide coverage for each
geographical region of the continental United States,
including both larger- and smaller-sized markets and those
with more demographically diverse populations. To put these
data into perspective, we translated them into per capita
numbers by dividing dollar sales by the total population of
each market. The population for these eight markets is 53.8
million, representing 17% of the total U.S. population.
We report dollar sales by category and subcategory.
9
Due to
the size of the soda category, we also report sales by type of
flavor (cola, citrus, and other).
Marketing in traditional media
To measure traditional media marketing for sugary drinks, we
conducted several analyses using a variety of data sources,
including: 1) licensed Nielsen data for spending in all measured
media, exposure to TV advertising by age group and race,
including Spanish-language advertising, and incidence and
exposure to brand appearances on prime-time TV; 2) licensed
Arbitron data to measure exposure to radio advertising by age
group; and 3) content analysis of the messages promoted in
TV advertising, including local sponsorships.
Advertising spending and TV advertising
exposure
To analyze advertising spending and TV advertising exposure,
we licensed data from Nielsen for 2008 through 2010 in the
following non-alcoholic beverage categories: drink product,
soft drink, regular soft drink, diet soft drink, drinks-isotonic,
bottled water, fruit drinks, fruit juice, iced tea, drink mix, iced
tea mix, and drink mix-isotonic. These Nielsen categories
incorporate all of the sugary drink and diet categories in our
analysis, as well as 100% juice and plain water, although
they do not always correspond directly with our categories.
For example, Nielsen’s drink-isotonic category includes both
energy drinks and sports drinks, and their bottled water
category includes plain and flavored water.
Using the descriptions provided by Nielsen, we assigned
each Nielsen brand to the appropriate brand, category, and
subcategory in our analysis. In some cases, the description
could apply to more than one brand and/or category or
subcategory (e.g., Coca-Cola soft drinks, Capri Sun drink
products). If the majority of advertising spending for products
that fall under that description (e.g., Coca-Cola soft drinks)
were sugary drinks, we assigned those data to the appropriate
sugary drink category. If there was no advertising spending
for individual products within that description, we assigned
the data to the category that had the most individual products
for that brand (e.g., children’s fruit drinks for Capri Sun). For
company-level advertising by companies whose products
did not fall primarily in one category (e.g., Coca-Cola drink
products), we included those numbers in the company but not
the brand analyses.
Sugary Drink FACTS 23
Methods
Advertising spending
Nielsen tracks media spending on TV (including Spanish-
language TV), radio, magazine, newspaper, free standing
insert coupons, outdoor advertising, and the internet. These
data provide a measure of all sugary drink spending. We
report these numbers by brand, company, category, and
subcategory.
TV advertising exposure
To measure exposure to TV advertising, we licensed gross
rating points (GRP) data from Nielsen. GRPs measure the total
audience delivered by a brand’s media schedule, expressed
as a percentage of the population that is exposed to each
commercial over a specified period of time across all types of
TV programming. They are the advertising industry’s standard
measure to assess audience exposure to advertising
campaigns; Nielsen is the most widely used source for
these data.
10
GRPs, therefore, provide an objective outside
assessment of advertising exposure. In addition, GRPs can
be used to measure advertisements delivered to a specific
audience, including different age groups and blacks versus
whites (also known as target rating points or TRPs), and
provide a per capita measure to evaluate relative exposure.
For example, if a sugary drink brand had 2,000 GRPs in 2010
for 2- to 11-year-olds and 1,000 GRPs for 25- to 49-year-olds,
we can conclude that children saw twice as many ads for that
brand in 2010 compared with adults.
The GRP measure differs from the measure used to evaluate
food industry compliance with their CFBAI pledges. The
pledges apply only to advertising in children’s TV programming
as defined by audience composition (i.e., programs in which
at least 25 to 50% of the audience are younger than age
12). Because approximately one-half of all advertisements
viewed by children younger than 12 occur during children’s
programming, this definition captures just one-half of total
child exposure.
11
We employ the GRP measure because
it reflects children’s total exposure to advertising during
all types of TV programming, not just advertising that aired
during children’s programming.
In the TV advertising analyses, we obtained 2008 through
2010 GRP data by age group and race. We first obtained total
GRPs for the following age groups: preschoolers (2-5 years),
children (6-11 years), adolescents (12-17 years), young adults
(18-24 years), and adults (25-49 years). These data provide
total exposure to national (network, cable, and syndicated)
and local (spot market) TV. In addition, we identified national
TV GRPs for blacks (2-11, 12-17, 18-24, and 25-49 years),
as well as whites in the same age groups. Nielsen does
not provide spot market GRPs by race. Finally, we obtained
GRPs for advertisements that aired on Spanish-language
TV for each age group. GRPs for Spanish-language TV are
calculated based on Nielsen’s Hispanic audience estimates.
Nielsen calculates GRPs as the sum of all advertising
exposures for all individuals within a demographic group,
including multiple exposures for individuals (i.e., gross
impressions), divided by the size of the population, and
multiplied by 100. We also use GRP data to calculate the
following TV advertising measures:
■
Average advertising exposure is calculated by dividing
total GRPs for a demographic group during a specific time
period by 100. It provides a measure of ads viewed by
the average individual in that demographic group during
the time period measured. For example, if Nielsen reports
2,000 GRPs for 2- to 5-year-olds for a sugary drink brand
in 2010, we can conclude that the average 2- to 5-year-old
viewed 20 ads for that brand in 2010.
■
Targeted GRP ratios measure relative exposure to
advertising between demographic groups. A targeted ratio
greater than 1.0 indicates that the average person in the
group of interest (e.g., the child in the child-to-adult ratio)
viewed more advertisements than the average person in the
comparison group (the adult). A targeted ratio of less than
1.0 indicates that the person in the group of interest viewed
fewer ads. For example, a child-to-adult targeted ratio of 2.0
indicates that children viewed twice as many ads as adults
viewed. We report the following targeted GRP ratios:
❑
Preschooler-to-adult = GRPs (2-5 years)/GRPs (25-49
years)
❑
Child-to-adult = GRPs (6-11 years)/GRPs (25-49 years)
❑
Teen-to-adult = GRPs (12-17 years)/GRPs (25-49 years)
❑
Child black-to-white = GRPs for blacks (2-11 years)/
GRPs for whites (2-11 years). This measure uses national
GRPs only.
❑
Teen black-to-white = GRPs for blacks (12-17 years)/
GRPs for whites (12-17 years). This measure uses
national GRPs only.
❑
Preschooler Spanish-to-English TV = GRPs for Spanish-
language TV (2-5 years)/GRPs for English-language TV
(2-5 years)
❑
Child Spanish-to-English TV = GRPs for Spanish-
language TV (6-11 years)/GRPs for English-language TV
(6-11 years)
❑
Teen Spanish-to-English TV = GRPs for Spanish-language
TV (12-17 years)/GRPs for English-language TV (12-17
years)
To assess potential targeted marketing to specific age or racial
groups, we compared differences between demographic
groups in their exposure to advertising for sugary drink and
energy drink brands with differences that would be expected
given each group’s average amount of TV viewing. The
average weekly amount of time spent viewing TV in 2010
was obtained from Nielsen Market Breaks for each age and
Sugary Drink FACTS 24
Methods
demographic group in the analysis. If the targeted ratio was
significantly greater than the relative difference in TV viewed
by each group, this suggests that the advertiser designed a
media plan to reach this specific demographic group more
often than would occur naturally.
TV advertising content analysis
To evaluate the messages and marketing techniques used
in the TV advertisements, we conducted a content analysis
of both English- and Spanish-language TV advertising for all
sugary drink and energy drink brands. Using the AdScope
database from Kantar Media, we obtained digital copies of all
beverage advertisements from the companies in our analysis
that aired nationally in the United States from October 1, 2009
through December 31, 2010. Researchers viewed each ad to
remove duplicates, including 15-second shortened versions of
30-second ads. In addition, ads with the same creative execution
but different promotions added to the end were catalogued
as duplicates. The basic version of the ad (excluding the
promotion) was retained for analysis. Distinct promotions were
noted but not included in the final content analysis unless the
promotion was present in all versions of the ad.
We used the coding manual developed for previous research
studies to analyze cereal
12
and fast food
13
advertising as the
basis for the coding manual for the present study. Researchers
examined a sample of sugary drink advertisements to
identify additional messages and marketing techniques that
appeared in sugary drink ads but were not included in the
previous manuals.
Two coders were trained to review the advertisements and
code them for all items in the manual. In two pre-test group
sessions, the project manager and coders independently
coded 20 sugary drink advertisements selected from
advertisements for the companies in our analysis that aired in
2011, immediately following the ads included in our content
analysis. Following these sessions, the project manager
revised and finalized the coding manual.
The coding manual includes nine main categories:
■
Identifying information, such as company, brand, and
variety or flavor advertised.
■
Target audience indicates the type of person to which the
ad appears to appeal most. These include gender, race,
and age of the person shown purchasing and/or consuming
the beverage. If purchase or consumption was not depicted
in the ad, main characters were coded.
■
Sponsorships involve outside entities supported by the
advertising, including event sponsorships (e.g., public
sporting events, concerts), athletic sponsorships (i.e.,
partnerships with sports teams, leagues, or professional
athletes), and cause-related marketing (i.e., partnership
with a charitable organization or donations to a philanthropic
cause).
■
Viewer participation describes marketing that engages
the consumer to take part in marketing decisions usually
made by the company, such as voting for a product name
or flavor or producing an advertisement.
■
Featured third parties include appearances by well-known
non-brand-related entities, including celebrities (e.g.,
actors, athletes, musicians), entertainment properties (e.g.,
movies, TV shows, video games), and licensed characters.
■
Brand spokes-characters are fictional characters or
mascots associated specifically with the brand (e.g., Kool-
Aid Man).
■
Selling point describes the direct qualities or benefits of
the product itself and include:
❑
new/improved if the ad introduces a new or improved
product or flavor;
❑
nutrition/nutrient claims include claims about the
product’s ingredients such as vitamins, and generic
nutrition claims like “good for you;”
❑
physical/mental benets of consuming the product
(e.g., lowers risk of disease, triggers muscle response);
❑
natural claims if the ad uses natural, fresh, real, quality,
or similar words to describe the product;
❑
unique/one of a kind for claims that the product(s) were
superior to that of the competition or suggestions that
they were unique;
❑
hydration if the ad claims the product quenches thirst;
❑
taste for descriptions of the flavor, such as “crisp” or
“clean;”
❑
low-calorie for claims that the product has few or reduced
calories.
■
Product associations describe indirect benefits of the
product suggested in the ad. These include suggestions
or portrayals of physical activity, sex, and inspirational
messages (i.e., product is associated with uplifting
messages to elicit happiness, hope, or inspiration). These
also include appeals for fun and cool/hip, as well as use of
humor, animation, and the sugary drink as a prop (i.e., visual
portrayal of the drink as a plaything, or in some other way that
suggests it is more than a beverage to be consumed).
■
Sugary drink portrayals indicate whether the product
is the primary focus of the ad (i.e., the product and its
direct qualities or benefits messages are prominent), and
suggestions for consumption of the product.
Krippendorff’s Alpha was used to measure inter-rater
reliability. The final reliability sample included 54 ads, or 25%
of the full sample, and each coder coded this same subset of
ads. Krippendorff’s Alpha values ranged from .41 (moderate)
to 1.00 (perfect) agreement with 43% of the items receiving
almost perfect agreement (.81 or higher), 38% of the items