Báo cáo khoa học: X-ray crystallography and structural stability of digestive lysozyme from cow stomach doc
Bạn đang xem bản rút gọn của tài liệu. Xem và tải ngay bản đầy đủ của tài liệu tại đây (331.99 KB, 9 trang )
X-ray crystallography and structural stability of digestive
lysozyme from cow stomach
Yasuhiro Nonaka
1
, Daisuke Akieda
1
, Tomoyasu Aizawa
1
, Nobuhisa Watanabe
1,2
, Masakatsu
Kamiya
3
, Yasuhiro Kumaki
1
, Mineyuki Mizuguchi
4
, Takashi Kikukawa
1
, Makoto Demura
3
and
Keiichi Kawano
1
1 Division of Biological Sciences, Graduate School of Science, Hokkaido University, Sapporo, Japan
2 Department of Biotechnology and Biomaterial Chemistry, Graduate School of Engineering, Nagoya University, Nagoya, Japan
3 Division of Molecular Life Science, Graduate School of Life Science, Hokkaido University, Sapporo, Japan
4 Graduate School of Medicine and Pharmaceutical Sciences, University of Toyama, Toyama, Japan
C-type lysozyme (EC 3.2.1.17), represented by hen
egg-white lysozyme (HEWL), is one of the most
well-known enzymes. It has been found in various ver-
tebrates, arthropods, and some other metazoa. It cata-
lyzes the hydrolysis of the b-1,4-glycoside linkage
between N-acetylglucosamine and N-acetylmuramic
acid of peptidoglycan, and thus breaks the bacterial
cell wall [1]. Most c-type lysozymes reported thus far
are considered to play a role in defense against bacte-
rial infection. It was proposed that the bacteriolytic
activity of lysozymes is also used for digestion in some
species.
In artiodactyl ruminants, which feed on plants, the
foregut chamber has evolved to digest cellulose
efficiently [2–4]. They recruit bacteria that ferment
cellulose in the foregut. The bacteria are broken down
by lysozyme in the true stomach, and the digested com-
ponent is then absorbed in the intestine. The acquisi-
tion of digestive lysozyme is well known as a case of
convergent evolution [4]. In addition to artiodactyla,
many other animals, such as a folivorous monkey (col-
obus) and a bird (hoatzin), as well as the house fly, are
known to have digestive c-type lysozymes [5–7]. Those
folivorous animals obtain nourishment from plant
material in a similar manner to artiodactyla. House fly
larvae feed on bacteria growing in decomposing mate-
rial, and digest the bacteria with lysozyme.
According to phylogenetic analyses, each phyloge-
netic group has independently adapted its defensive
lysozyme for digestion [7,8]. Interestingly, common
Keywords
lysozyme; molecular evolution; protease
resistance; structural stability; X-ray
crystallography
Correspondence
K. Kawano, Graduate School of Science,
Hokkaido University, North 10, West 8,
Kita-ku, Sapporo, Hokkaido 060 0810,
Japan
Fax: +81 11 706 2770
Tel: +81 11 706 2770
E-mail:
(Received 12 November 2008, revised 22
January 2009, accepted 4 February 2009)
doi:10.1111/j.1742-4658.2009.06948.x
In ruminants, some leaf-eating animals, and some insects, defensive lyso-
zymes have been adapted to become digestive enzymes, in order to digest
bacteria in the stomach. Digestive lysozyme has been reported to be resis-
tant to protease and to have optimal activity at acidic pH. The structural
basis of the adaptation providing persistence of lytic activity under severe
gastric conditions remains unclear. In this investigation, we obtained the
crystallographic structure of recombinant bovine stomach lysozyme 2
(BSL2). Our denaturant and thermal unfolding experiments revealed that
BSL2 has high conformational stability at acidic pH. The high stability in
acidic solution could be related to pepsin resistance, which has been previ-
ously reported for BSL2. The crystal structure of BSL2 suggested that
negatively charged surfaces, a shortened loop and salt bridges could pro-
vide structural stability, and thus resistance to pepsin. It is likely that BSL2
loses lytic activity at neutral pH because of adaptations to resist pepsin.
Abbreviations
BSL2, bovine stomach lysozyme 2; DSC, differential scanning calorimetry; HEWL, hen egg-white lysozyme.
2192 FEBS Journal 276 (2009) 2192–2200 ª 2009 The Authors Journal compilation ª 2009 FEBS
properties, e.g. low optimal pH and resistance to pro-
tease, are shared by digestive lysozymes from different
organisms [6,8–10]. Furthermore, ruminant and colo-
bus lysozymes share similarities in amino acid
sequence, and this is unlikely to have occurred by
random drift, suggesting convergent (or parallel)
amino acid replacements [7]. These functional and
structural similarities could have resulted from adap-
tation to severe gastric conditions. However, the
molecular bases for such adaptations remain to be
investigated. Recently, the crystal structure of house
fly digestive lysozyme was solved, explaining the mech-
anism underlying the acidic pH optimum [11]. The pK
a
values of the catalytic residues are lowered by neigh-
boring residues, resulting in the acidic pH optimum.
No experimental three-dimensional structure of ver-
tebrate digestive lysozyme has been reported thus far.
It would be useful to understand the structural bases
for the adaptation by comparing this lysozyme with
house fly digestive and other nondigestive lysozymes.
In this study, we obtained recombinant bovine stom-
ach lysozyme 2 (BSL2), the most highly expressed lyso-
zyme in the cow stomach. X-ray crystallography and
some other experiments were performed to determine
how this lysozyme has acquired the properties
mentioned above. We also discuss the significance of
the probable convergent amino acid replacements.
Results
X-ray crystallography of BSL2
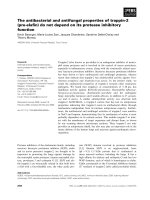
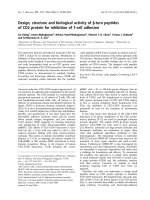
The crystal structure of BSL2 is shown in Fig. 1A, and
the data collection, processing and refinement statistics
are summarized in Table 1. BSL2 was crystallized in
the space group P2
1
2
1
2
1
. The structure was refined at
1.5 A
˚
to an R-factor of 17.8% and an R-free of
22.1%. The average B-value for all protein atoms is
10.17 A
˚
2
, and that for all main chain atoms is 9.25 A
˚
2
.
The electron density map was sufficiently clear to build
a molecular model, and most of the side chain confor-
mations were determined unequivocally, although
some residues showed multiple conformers.
This lysozyme is composed of an a-domain and a
b-domain, both of which are common in the previ-
ously reported structures for other c-type lysozymes.
The a-domain is composed of four a-helices (A–D),
and the b-domain is composed of a large loop and a
three-strand antiparallel b-sheet. Figure 1B is a super-
imposition of the main chain conformations of BSL2,
human lysozyme, HEWL, and house fly midgut
AB
Fig. 1. (A) Ribbon model of BSL2 (Protein
Data Bank ID: 2Z2F) in which a-helices are
sequentially labeled from A to D. The struc-
ture is shown in rainbow colors from the
N-terminus to the C-terminus. The figure
was produced using
MOLFEAT (FiatLux,
Tokyo, Japan). (B) Superimposition of the C
a
conformation of BSL2 (red), human lyso-
zyme (green, 1JSF), HEWL (blue, 1DPX),
and house fly midgut lysozyme (yellow,
A chain of 2FBD). The broken-line circle
represents the loop region following the
C-helix. The figure was produced using
MOLMOL [50].
Table 1. Data collection, processing and refinement statistics.
Data collection
Space group P2
1
2
1
2
1
Cell constants (A
˚
)
a 31.257
b 56.065
c 64.050
Resolution (A
˚
) 50.00–1.50 (1.55–1.50)
a
No. observations 126 692
I ⁄ r(I) 28.085 (17.272)
No. unique reflections 17833 (1662)
R
merge
0.046 (0.088)
Completeness (%) 95.0 (90.7)
Multiplicity 7.1 (7.1)
Refinement data
Resolution (A
˚
) 17.94–1.50
No. reflections 16 849
R-factor 0.178
R
free
0.221
Rmsd from ideal values
Bond lengths (A
˚
) 0.009
Bond angles (°) 1.261
a
Values in parentheses are for the last resolution shell.
Y. Nonaka et al. Structure and stability of bovine stomach lysozyme
FEBS Journal 276 (2009) 2192–2200 ª 2009 The Authors Journal compilation ª 2009 FEBS 2193
lysozyme. The rmsd between BSL2 and human lyso-
zyme, calculated using the backbone atoms in the
a-helices, is 0.38 A
˚
, that between BSL2 and HEWL is
0.35 A
˚
, and that between BSL2 and house fly lysozyme
is 0.79 A
˚
. The backbone structure of BSL2 is closer to
that of the vertebrate nondigestive lysozyme than to
that of insect digestive lysozyme.
pH dependence of the lytic activity of BSL2
The digestive lysozymes reported thus far tend to have
a pH optimum at acidic pH, whereas nondigestive
lysozymes have a broad optimum at neutral pH [8,9].
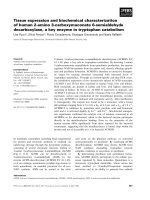
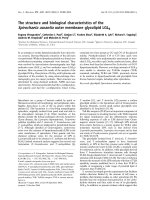
The relative lytic activities of recombinant BSL2 and
commercial HEWL at pH 4–7 are shown in Fig. 2.
The pH optimum of BSL2 was about 5, whereas that
of HEWL occurred at pH values higher than 6. BSL2
exhibited less activity than HEWL, even at the optimal
pH of BSL2. At pH 7, BSL2 showed almost no lytic
activity.
Structural stability of BSL2 in acidic conditions
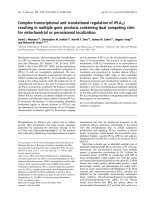
Digestive lysozymes need protease resistance to main-
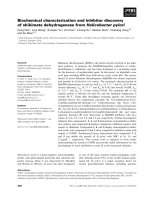
tain their lytic activity in the stomach. As shown in
Fig. 3, BSL2 is more resistant than HEWL to pepsin.
Pepsin readily digested HEWL in acidic conditions
with physiological ionic strength (150 mm NaCl),
whereas BSL2 remained intact after 4 h. This result
corresponded to that for natural BSL2 from bovine
stomach, based on residual activity [9].
In one report, protease resistance was correlated with
protein thermostability [12]. To evaluate the structural
stability of BSL2, denaturant-induced unfolding and
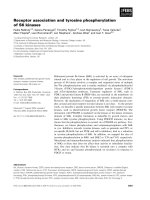
thermal unfolding were monitored. Figure 4 shows the
guanidinium hydrochloride-unfolding curves of BSL2
and HEWL, as determined by CD ellipticity at 222 nm,
indicating the disruption of the native structure. The
parameters derived from these unfolding curves are
shown in Table 2. At pH 6.0, BSL2 and HEWL were
similar in their midpoints (C
m
), Gibbs free energies
without denaturant (DG
w
), and m values indicative of
cooperativity. At pH 2.0, in contrast, BSL2 unfolded at
a higher concentration of guanidinium hydrochloride
than HEWL. The Gibbs free energy of BSL2 at low
pH was much greater than that of HEWL, indicating
the high conformational stability of BSL2. The transi-
tion temperatures (T
m
) and unfolding enthalpy values
(DH
u
) at pH 2.0, obtained by thermal unfolding experi-
ments using differential scanning calorimetry (DSC),
are also summarized in Table 2. BSL2 unfolded at a
higher temperature and had a greater DH
u
value, also
indicating greater structural stability.
Hydrogen exchange properties were monitored by
1D
1
H-NMR at pH 1.9, to compare the conforma-
tional flexibilities of BSL2 and HEWL (Fig. 5). Gener-
ally, there are few or no peaks around 10 p.p.m.,
except for the peaks of tryptophan indole hydrogen
atoms. Both BSL2 and HEWL have six tryptophan
residues, and five peaks appear around 10 p.p.m. for
both proteins. In the spectra of HEWL, most of the
indole hydrogen peaks diminished rapidly within
30–60 min, and only the peak at 10.3 p.p.m. remained
after a 120 min exchange. In the spectra of BSL2,
three peaks were observed after the 30 min exchange,
and decreased gradually. In particular, the peak of
Trp64 in BSL2 diminishes more slowly than that of
the corresponding residue, Trp63, in HEWL. The tryp-
tophan residues whose peaks diminished rather slowly
could exist in rigid and unexposed regions.
Fig. 2. Bacteriolytic activities of BSL2 (gray bars) and HEWL (white
bars) at different pH values, ionic strength 0.1, and 25 °C. The rela-
tive activities are expressed by taking the activity of HEWL at
pH 7.0 as 1.0.
A
B
C
Fig. 3. SDS ⁄ PAGE of pepsin-treated BSL2 and HEWL with (A)
0m
M NaCl (B) 150 mM NaCl, and (C) 500 mM NaCl. Aliquots of the
solution were sampled at intervals of 1 h. M is the marker lane.
Structure and stability of bovine stomach lysozyme Y. Nonaka et al.
2194 FEBS Journal 276 (2009) 2192–2200 ª 2009 The Authors Journal compilation ª 2009 FEBS
Discussion
Although BSL2 has an acidic optimal pH, the relative
activity level is lower than or comparable to that of
HEWL, even at acidic pH (Fig. 2). BSL2, like many
acidophilic proteins [13–15], possesses a greater num-
ber of acidic residues than nondigestive lysozymes
(Table 3). An increase in acidic residues would result
in low lytic activity, because the electrostatic attraction
between the lysozyme and the negatively charged bac-
terial membrane becomes weaker, especially at neutral
pH. BSL isozymes are considered to function below
pH 6 in nature [9]. It is likely that BSL2 has lost lytic
activity at neutral pH and retains it below pH 6.
In the case of house fly digestive lysozyme, the crys-
tallographic analysis and catalytic activity experiments
indicated that the catalytic residues have lower pK
a
values than those of HEWL, and thus the optimal pH
is shifted to the acidic range [11]. Using the crystallo-
graphic structures, we calculated the pK
a
values of the
Fig. 4. Guanidinium hydrochloride-induced unfolding curves of
BSL2 (circles) and HEWL (triangles) monitored by CD at (A) pH 2.0
and (B) pH 6.0. The apparent fractions of unfolding protein, f
app
,
were plotted against the concentration of guanidinium hydrochlo-
ride. The lines are the transition curves estimated by the nonlinear
least squares method.
Table 2. Thermodynamic parameters for guanidinium hydrochlo-
ride-induced and thermal unfolding.
pH 2.0 pH 6.0
BSL2 HEWL BSL2 HEWL
Guanidinium hydrochloride-induced unfolding
C
m
(M) 3.07 2.17 4.17 4.16
DG
w
(kJÆmol
)1
) 32.9 17.3 53.4 41.9
m (kJÆmol
)1
M) 10.7 7.97 12.8 10.1
Thermal unfolding
T
m
(K) 333.8 326.6
DH (kJÆmol
)1
)
a
406.4 386.4
a
The unfolding enthalpies at transition temperature T
m
.
W64
A
B
W111
Normalized intensityNormalized intensity
11.0 10.8 10.6 10.4 10.2
p.p.m.
10.0 9.8
11.0 10.8 10.6 10.4 10.2
p.p.m.
10.0 9.8
W63
W34
W108
W108
W62
W63
W111
W123
Fig. 5. 1D
1
H-NMR spectra of (A) BSL2 and (B) HEWL in 95%
H
2
O ⁄ 5% D
2
O (thick lines) and after 30, 60 or 120 min of hydro-
gen–deuterium exchange in 100% D
2
O (thin lines). The spectra
were acquired at pH 1.9.
Y. Nonaka et al. Structure and stability of bovine stomach lysozyme
FEBS Journal 276 (2009) 2192–2200 ª 2009 The Authors Journal compilation ª 2009 FEBS 2195
catalytic residues Glu35 and Asp52 (numbering for
HEWL), for BSL2 and other lysozymes, with prop-
ka 2.0 [16]. The predicted pK
a
values were 6.15 and
4.27 for BSL2, 5.93 and 4.20 for HEWL, and 4.89 and
3.84 for house fly lysozyme. Although these values do
not agree completely with the experimental results [11],
the acidic shifts of the pK
a
values for house fly lyso-
zyme are well predicted. The calculated pK
a
values for
BSL2 are not reduced as compared to those for
HEWL. Glu35 in BSL2 is surrounded by hydrophobic
residues, as it is in HEWL, and this results in the high
pK
a
, whereas the polarity of Thr110 reduces the pK
a
for house fly lysozyme. In the case of Asp52, the pK
a
is modulated by the hydrogen bond network. There
are hydrogen bonds formed by Asp52, Asn46 and
Asp48 in HEWL. House fly lysozyme has an aspara-
gine at position 48, and the absence of the negative
charge should reduce the pK
a
of Asp52 as compared
to HEWL [11]. Asn46 in BSL2 is distant from Asp52,
and the absence of this hydrogen bond network would
reduce the pK
a
. However, Asp52 in BSL2 is more
exposed to solvent than that in HEWL, and this raises
the pK
a
. As a result, the calculated pK
a
values for
BSL2 were comparable to those for HEWL. The result
suggests that the catalytic activity of BSL2 is not
adapted to acidic conditions, unlike the case with
house fly lysozyme.
BSL2 and other vertebrate digestive lysozymes have
been reported to be resistant to pepsin digestion, as is
also shown in Fig. 3. The efficiency of peptide bond
fission by protease reflects the conformational flexibil-
ity of the polypeptide substrate [12,17,18]. The correla-
tion between structural rigidity and stability has been
reported for many proteins [19–22]. The high confor-
mational stability of BSL2 as compared to HEWL
(Table 2) suggests greater structural rigidity. The
higher rigidity was also suggested by the hydrogen
exchange experiment (Fig. 5). Trp64 in BSL2 is pro-
tected, whereas Trp63 in HEWL is not. This residue
exists in the b-domain, and is oriented to the interface
between the two domains. Therefore, the interface of
BSL2 is less susceptible to unfolding than that of
HEWL. These results support the notion that confor-
mational rigidity protects BSL2 from pepsin digestion.
Because the house fly lysozyme is resistant to cathep-
sin D, a protease from the house fly midgut [5], the
house fly midgut lysozyme would have structural
stability and rigidity similar to that of BSL2. As
observed for thermophilic enzymes, an increase in con-
formational rigidity often leads to a reduction in enzy-
matic activity [22–24]. The lower lytic activity of BSL2
(Fig. 2) may also be caused by the increased rigidity,
and not only by the increased negative charge.
The numbers of positive and negative charges differ
among these lysozymes (Table 3). The surfaces of
HEWL and human lysozyme are predominantly posi-
tively charged. A lysozyme covered with positively
charged surfaces will have a loose structure, because
electrostatic repulsion significantly increases on the
molecular surface. BSL2 has a negatively charged
b-domain and a positively charged a-domain. The
electrostatic repulsion on the surface will be weaker,
and this could contribute to the higher stability. There
are fewer charged residues on the surface of the house
fly lysozyme, and the electrostatic repulsion will be
smaller. The house fly lysozyme may have achieved
structural stability by decreasing the positively charged
residues.
The increase in acidic residues is also expected to
result in an increase in the number of salt bridges. The
numbers of the salt bridges in BSL2 and HEWL, how-
ever, are comparable (Table 3). It is noteworthy that
BSL2 contains a complex salt bridge (Glu83–Lys91–
Glu86) that is absent in the three other lysozymes. A
triangular salt bridge formed by two acidic residues
and one basic residue can be more strong than the
sum of simple salt bridges [25–27]. The loop located
between Glu83 and Lys91 connects the b-domain and
the a-domain. In the case of calcium-binding lysozyme,
calcium binding at this loop stabilizes the native struc-
ture [28,29]. By analogy, the electrostatic interaction at
this loop is considered to contribute to the overall
structural stability.
The overall structures of these lysozymes are very
similar (Fig. 1B), and the numbers of hydrogen bonds
are comparable (Table 3). A marked difference is
observed in the region from the C-terminus of the
C-helix to the following loop, residues 100–103 in
HEWL (Fig. 1B). The C-helices of human lysozyme
and HEWL are terminated at residue 101 followed by
proline or glycine, which can destabilize the a-helix
[30]. BSL2 and house fly lysozyme lack this proline or
glycine residue, and thus the C-helices are longer and
the following loops are shorter than those of HEWL
and human lysozyme. This would prevent pepsin
Table 3. Comparison of structural parameters among lysozymes.
BSL2 HEWL Human House fly
No. of residues 129 129 130 122
No. of charged residues
Negative 15 9 11 9
Positive 18 18 20 12
No. of salt bridges 4 3 5 3
No. of hydrogen bonds 125 122 125 109
Hydrogen bonds ⁄ residue 0.97 0.95 0.96 0.89
Structure and stability of bovine stomach lysozyme Y. Nonaka et al.
2196 FEBS Journal 276 (2009) 2192–2200 ª 2009 The Authors Journal compilation ª 2009 FEBS
digestion, because there are proteolytic sites for pepsin
in this loop for HEWL and human lysozyme [18,31].
The amino acid replacements at positions 14, 21, 50,
75 and 87 were considered to be significant for the
adaptation of digestive lysozyme, on the basis of the
analyses using vertebrate digestive and nondigestive
lysozyme sequences [7,32]. No remarkable difference,
such as the alteration of hydrogen bonds, is found at
these positions between BSL2 and human lysozyme,
except at residue 21. The side chain of Lys21 in BSL2
forms hydrogen bonds with the side chains of Tyr20
and Ser101, whereas the side chain of Arg21 in human
lysozyme hydrogen-bonds to the backbone carbonyl
oxygens of Val100 and Asp102. As discussed above,
the region that includes residues 100–102 could be
associated with resistance to pepsin. The replacement
of residue 21 could also be an adaptation to stabilize
this region.
Experimental procedures
Expression and purification of BSL2
In an Escherichia coli expression system, removal of an
extra methionine residue at the N-terminus does not take
place in the case of lysozyme [33]. We obtained recom-
binant BSL2 with a perfect sequence using the methylo-
trophic yeast Pichia pastoris, basically as described by
Digan et al. [34].
The cDNA was ligated to the expression vector pPIC3
(Invitrogen, Carlsbad, CA, USA). To secrete BSL2 into the
culture, we incorporated the native signal sequence of
BSL2. The plasmid was linearized by SalI, and transformed
into P. pastoris GS115 by electroporation. Genotypic selec-
tion and phenotypic screening were performed on a mini-
mal dextrose plate (1.34% yeast nitrogen base, 4 · 10
)5
%
biotin, 1% dextrose, and 1.5% agar) and on a minimal
methanol lysoplate (1.34% yeast nitrogen base, 4 · 10
)5
%
biotin, 0.061% Micrococcus lysodeikticus, and 1.5% agar,
in 10 mm potassium phosphate buffer, pH 5.0), as previ-
ously reported, except for pH and buffer concentration
[35]. Colonies on a minimal dextrose plate were inoculated
onto a minimal methanol lysoplate, and 200 lL of metha-
nol was spread on the plate cover and incubated at 30 °C
for about 1–3 days. The radius of the translucent plaque
around the colony was measured as an indicator of the
colony’s lysozyme expression level.
P. pastoris for BSL2 expression was cultivated using a jar
fermenter with high-density fermentation [36–38]. To avoid
proteolysis, we recovered the culture after induction for
48 h. To purify recombinant lysozyme using cation
exchange chromatography, the supernatant of the culture
was diluted so that the electrical conductivity was decreased
to < 5 mSÆcm
)1
. The diluted supernatant was filtered
through a nitrocellulose membrane. The supernatant was
loaded onto an SP-Sepharose Fast Flow column (300 mL)
(GE Healthcare, Piscataway, NJ, USA) equilibrated with
50 mm sodium acetate buffer (pH 4.8), and the adsorbed
proteins were eluted with 50 mm sodium acetate buffer with
1 m NaCl (pH 4.8). The elution was monitored by absor-
bance at 280 nm. The sample solution was dialyzed with
50 mm sodium acetate buffer (pH 4.8) to decrease electrical
conductivity. After dialysis, the sample was loaded onto an
SP-Sepharose Fast Flow column equilibrated with 50 mm
sodium acetate buffer (pH 4.8), and eluted with a salt linear
gradient of 50 mm sodium acetate buffer with 1 m NaCl
(pH 4.8). The main peak fraction was dialyzed with 20 mm
NH
4
HCO
3
and freeze-dried.
Assay of lytic activity
The lytic activities of BSL2 and HEWL against M. lys-
odeikticus were estimated using the turbidimetric method
[39]. Lyophilized M. lysodeikticus was purchased from
Sigma-Aldrich (St Louis, MO, USA). Suspensions of
M. lysodeikticus were prepared in sodium acetate (for pH 4
and 5) and sodium phosphate (for pH 6 and 7) buffer. The
ionic strength of each buffer was adjusted to 0.1 [40]. Lyso-
zyme solution and M. lysodeikticus suspension were mixed,
and the decrease in absorbance was monitored at 540 nm
with a thermostatically controlled cell holder at 25 °C. The
relative activity was calculated from the speed of the absor-
bance decrement.
Pepsin digestion
Pepsin was obtained from Sigma-Aldrich. HEWL was
obtained from Seikagaku Corp. (Tokyo, Japan). Lysozymes
were dissolved in 10 mm HCl (pH 2), and the final protein
concentration was 0.5 mgÆmL
)1
. The digestion experiment
was carried out in the presence of pepsin at 37 °C. The
aliquots were sampled at intervals of 1 h and then frozen
until electrophoresis.
X-ray crystallography
A crystal of BSL2 was obtained by the vapor diffusion (sit-
ting drop) method, using 0.1 m sodium Hepes buffer at
pH 7.5, containing 0.2 m NaCl and 30% 2-methyl-2,4-penta-
nediol. The space group of the crystal was P2
1
2
1
2
1
, with
cell dimensions a = 31.257 A
˚
, b = 56.065 A
˚
, and c =
64.050 A
˚
. There is one monomeric molecule in an asymmet-
ric unit. The X-ray diffraction data of BSL2 were collected
from a single crystal at 93 K, using a MicroMAX-007
generator (Rigaku, Tokyo, Japan) and an R-AXIS IV++
detector (Rigaku). The reflections were processed with the
program hkl-2000 [41]. The I ⁄ r(I) in the last resolution shell
(1.55–1.50) was 17.272. The resolution was limited by the
Y. Nonaka et al. Structure and stability of bovine stomach lysozyme
FEBS Journal 276 (2009) 2192–2200 ª 2009 The Authors Journal compilation ª 2009 FEBS 2197
acceptance of the detector. The limit at the edge of the detec-
tor using an 80 mm crystal-to-film distance is approximately
1.5 A
˚
resolution. The structure was solved by the molecular
replacement method, using the program molrep [42] pack-
aged in ccp4 [43]. The structure of recombinant human lyso-
zyme (Protein Data Bank code: 1LZ1) [44] was used as the
search model. The structure was refined using the program
refmac5 [45] in the ccp4 suite, and was visually inspected
using coot [46]. Water molecules were found by the func-
tions in refmac5 and coot, and were checked visually using
coot. A sodium ion was added to the model as judged by the
electron density, coordination number, and interatomic dis-
tance. The structure was deposited in the Protein Data Bank
under the code 2Z2F.
Analysis of structural features
A salt bridge in Table 3 was defined as a negative residue
and a positive residue with an interatomic distance of
< 4.0 A
˚
. The hydrogen bonds were detected using the
what if web interface with the following criteria: maximal
distances of 3.5 A
˚
for donor–acceptor and 2.5 A
˚
for
hydrogen–acceptor, and minimal angles of 60° for donor–
hydrogen–acceptor and 90° for hydrogen–acceptor–X.
Water-mediated hydrogen bonds were not included.
CD
CD at 222 nm was measured with a Jasco J-725 spectro-
polarimeter (Japan Spectroscopic, Tokyo, Japan), using
optical cells with path length of 1 mm. The guanidinium
hydrochloride-induced unfolding experiment was carried
out at 298 K using 50 mm KCl ⁄ HCl buffer at pH 2.0, and
50 mm sodium phosphate buffer at pH 6.0. The concentra-
tion of guanidinium hydrochloride was determined by the
difference between the refractive indices of guanidinium
hydrochloride solution and guanidinium hydrochloride-free
solution. The protein concentration was 8–10 lm. The
unfolding curves were fitted to the following equation:
DG =–RTlnK = DG
w
– mC, where DG and DG
w
are the
Gibbs free energy with denaturant and that without
denaturant respectively, and R, T, K, m and C are the gas
constant, absolute temperature, equilibrium constant,
cooperativity index, and denaturant concentration,
respectively.
DSC
DSC was carried out using VP-DSC (MicroCal, Northamp-
ton, MA, USA), at a scan rate of 1.0 KÆmin
)1
. Sample
solution was prepared with reference buffer 50 mm glycine-
HCl at pH 2.0. To extend the temperature range, all DSC
measurements were performed under a pressure of 2.0 atm.
The protein concentration and pH were confirmed after the
scan. The DSC curves were analyzed to obtain the transi-
tion temperatures (T
m
) and unfolding enthalpies (DH
u
) [47].
Hydrogen–deuterium exchange experiment
Hydrogen–deuterium exchange was measured by 1D
1
H-
NMR performed on a Bruker 500 MHz instrument (Bruker
BioSpin, Rheinstetten, Germany), with a cryogenic probe
and a JEOL ECA-600 instrument (JEOL, Tokyo, Japan).
The exchange was initiated by dissolving protein that had
been lyophilized with pH-adjusted buffer (pH 1.9) in D
2
O
to give a final protein concentration of 0.3 mm in 50 mm
sodium phosphate. The sample was incubated at 298 K. A
total of 32 scans of each sample were collected at 30 or
60 min intervals. To acquire the spectra before hydrogen
exchange, lysozyme solution was subjected to
1
H-NMR in
the same buffer with 95% H
2
O ⁄ 5% D
2
O. The peaks of
unexchangeable hydrogens were used to normalize inten-
sity. The peaks of indole hydrogens were assigned on the
basis of the BMRB database (bmr1093 and bmr4562 for
HEWL and bmr76 for human lysozyme were used), and
using proshift [48], a chemical-shift prediction tool.
Estimation of protein concentration
The protein concentrations were estimated spectrophoto-
metrically by following the extinction coefficients at 280 nm
for a 1% solution in a 1 cm cell: E = 28.4 for BSL2, and
E = 26.5 for HEWL, estimated using protparam [49].
Acknowledgements
This study was supported by the Program for the Pro-
motion of Basic Research Activities for Innovative
Biosciences (PROBRAIN), Japan. We thank the staff
of the High-Resolution NMR Laboratory, Graduate
School of Science, Hokkaido University, for the NMR
measurements, Professor I. Tanaka, Graduate School
of Life Science, Hokkaido University, for the X-ray
crystallography, and Emeritus Professor K. Nitta,
Graduate School of Science, Hokkaido University, for
helpful advice.
References
1 Prager EM & Jolles P (1996) Animal lysozymes c and g:
an overview. In Lysozyme: Model Enzymes in Biochemis-
try and Biology (Jolles P, ed.), pp. 9–31. EXS, Basel.
2 Langer P (1974) Stomach evolution in the artiodactyla.
Mammalia 38, 295–314.
3 Janis C (1976) The evolutionary strategy of the equidae
and the origins of rumen and cecal digestion. Evolution
30, 757–774.
Structure and stability of bovine stomach lysozyme Y. Nonaka et al.
2198 FEBS Journal 276 (2009) 2192–2200 ª 2009 The Authors Journal compilation ª 2009 FEBS
4 Irwin DM (1996) Molecular evolution of ruminant lyso-
zymes. In Lysozyme: Model Enzymes in Biochemistry
and Biology (Jolles P, ed.), pp. 347–361. EXS, Basel.
5 Espinoza-Fuentes FP & Terra WR (1987) Physiological
adaptations for digesting bacteria – water fluxes and
distribution of digestive enzymes in Musca domestica
larval midgut. Insect Biochem 17, 809–817.
6 Kornegay JR, Schilling JW & Wilson AC (1994) Molec-
ular adaptation of a leaf-eating bird – stomach lyso-
zyme of the hoatzin. Mol Biol Evol 11, 921–928.
7 Stewart CB, Schilling JW & Wilson AC (1987) Adap-
tive evolution in the stomach lysozymes of foregut
fermenters. Nature 330, 401–404.
8 Prager EM (1996) Adaptive evolution of lysozyme:
changes in amino acid sequence, regulation of expres-
sion and gene number. In Lysozyme: Model Enzymes in
Biochemistry and Biology (Jolles P, ed.), pp. 323–345.
EXS, Basel.
9 Dobson DE, Prager EM & Wilson AC (1984) Stomach
lysozymes of ruminants. I. Distribution and catalytic
properties. J Biol Chem 259, 11607–11616.
10 Stewart CB & Wilson AC (1987) Sequence convergence
and functional adaptation of stomach lysozymes from
foregut fermenters. Cold Spring Harb Symp Quant Biol
52, 891–899.
11 Cancado FC, Valerio AA, Marana SR & Barbosa JA
(2007) The crystal structure of a lysozyme c from
housefly Musca domestica, the first structure of a diges-
tive lysozyme. J Struct Biol 160, 83–92.
12 Daniel RM, Cowan DA, Morgan HW & Curran MP
(1982) A correlation between protein thermostability
and resistance to proteolysis. Biochem J 207, 641–644.
13 Bonisch H, Schmidt CL, Schafer G & Ladenstein R
(2002) The structure of the soluble domain of an archa-
eal rieske iron–sulfur protein at 1.1 A resolution. J Mol
Biol 319, 791–805.
14 Sielecki AR, Fedorov AA, Boodhoo A, Andreeva NS
& James MNG (1990) Molecular and crystal-structures
of monoclinic porcine pepsin refined at 1.8-A resolu-
tion. J Mol Biol 214, 143–170.
15 Fushinobu S, Ito K, Konno M, Wakagi T & Matsuzawa
H (1998) Crystallographic and mutational analyses of
an extremely acidophilic and acid-stable xylanase:
biased distribution of acidic residues and importance of
Asp37 for catalysis at low pH. Protein Eng 11, 1121–
1128.
16 Li H, Robertson AD & Jensen JH (2005) Very fast
empirical prediction and rationalization of protein pKa
values. Proteins 61, 704–721.
17 Fontana A, Fassina G, Vita C, Dalzoppo D, Zamai M
& Zambonin M (1986) Correlation between sites of lim-
ited proteolysis and segmental mobility in thermolysin.
Biochemistry 25, 1847–1851.
18 Frare E, Mossuto MF, de Laureto PP, Dumoulin M,
Dobson CM & Fontana A (2006) Identification of the
core structure of lysozyme amyloid fibrils by proteoly-
sis. J Mol Biol 361, 551–561.
19 Tang KES & Dill KA (1998) Native protein fluctua-
tions: the conformational-motion temperature and the
inverse correlation of protein flexibility with protein
stability. J Biomol Struct Dyn 16, 397–411.
20 Gershenson A, Schauerte JA, Giver L & Arnold FH
(2000) Tryptophan phosphorescence study of enzyme
flexibility and unfolding in laboratory-evolved thermo-
stable esterases. Biochemistry 39, 4658–4665.
21 Vihinen M (1987) Relationship of protein flexibility to
thermostability. Protein Eng
1, 477–480.
22 Zavodszky P, Kardos J, Svingor A & Petsko GA (1998)
Adjustment of conformational flexibility is a key event
in the thermal adaptation of proteins. Proc Natl Acad
Sci USA 95, 7406–7411.
23 Varley PG & Pain RH (1991) Relation between stabil-
ity, dynamics and enzyme-activity in 3-phosphoglycerate
kinases from yeast and Thermus thermophilus. J Mol
Biol 220, 531–538.
24 Wrba A, Schweiger A, Schultes V, Jaenicke R &
Zavodszky P (1990) Extremely thermostable d-glycer-
aldehyde-3-phosphate dehydrogenase from the
eubacterium Thermotoga maritima. Biochemistry 29,
7584–7592.
25 Mayne L, Englander SW, Qiu R, Yang JX, Gong YX,
Spek EJ & Kallenbach NR (1998) Stabilizing effect of a
multiple salt bridge in a prenucleated peptide. JAm
Chem Soc 120, 10643–10645.
26 Gvritishvili AG, Gribenko AV & Makhatadze GI
(2008) Cooperativity of complex salt bridges. Protein
Sci 17, 1285–1290.
27 Horovitz A, Serrano L, Avron B, Bycroft M & Fersht
AR (1990) Strength and cooperativity of contributions
of surface salt bridges to protein stability. J Mol Biol
216, 1031–1044.
28 Nitta K, Tsuge H & Iwamoto H (1993) Comparative
study of the stability of the folding intermediates of the
calcium-binding lysozymes. Int J Pept Protein Res 41,
118–123.
29 Kikuchi M, Kawano K & Nitta K (1998) Calcium-bind-
ing and structural stability of echidna and canine milk
lysozymes. Protein Sci 7, 2150–2155.
30 Fersht A (1999) Structure and Mechanism in Protein
Science. W. H. Freeman and Co., New York.
31 Ibrahim HR, Inazaki D, Abdou A, Aoki T & Kim M
(2005) Processing of lysozyme at distinct loops by pep-
sin: a novel action for generating multiple antimicrobial
peptide motifs in the newborn stomach. Biochim
Biophys Acta Gen Subj 1726, 102–114.
32 Zhang J & Kumar S (1997) Detection of convergent
and parallel evolution at the amino acid sequence level.
Mol Biol Evol 14, 527–536.
33 Miki T, Yasukochi T, Nagatani H, Furuno M, Orita T,
Yamada H, Imoto T & Horiuchi T (1987) Construction
Y. Nonaka et al. Structure and stability of bovine stomach lysozyme
FEBS Journal 276 (2009) 2192–2200 ª 2009 The Authors Journal compilation ª 2009 FEBS 2199
of a plasmid vector for the regulatable high-level expres-
sion of eukaryotic genes in Escherichia coli – an appli-
cation to overproduction of chicken lysozyme. Protein
Eng 1, 327–332.
34 Digan ME, Lair SV, Brierley RA, Siegel RS, Williams
ME, Ellis SB, Kellaris PA, Provow SA, Craig WS, Veli-
celebi G et al. (1989) Continuous production of a novel
lysozyme via secretion from the yeast, Pichia pastoris.
Biotechnology 7, 160–164.
35 Koganesawa N, Aizawa T, Masaki K, Matsuura A,
Nimori T, Bando H, Kawano K & Nitta K (2001)
Construction of an expression system of insect
lysozyme lacking thermal stability: the effect of selec-
tion of signal sequence on level of expression in the
Pichia pastoris expression system. Protein Eng 14,
705–710.
36 Brierley RA, Bussineau C, Kosson R, Melton A & Siegel
RS (1990) Fermentation development of recombinant
Pichia pastoris expressing the heterologous gene – bovine
lysozyme. Ann NY Acad Sci 589, 350–362.
37 Katakura Y, Zhang WH, Zhuang GQ, Omasa T,
Kishimoto M, Goto W & Suga KI (1998) Effect of
methanol concentration on the production of human
beta(2)-glycoprotein I domain V by a recombinant
Pichia pastoris: a simple system for the control of meth-
anol concentration using a semiconductor gas sensor.
J Ferment Bioeng 86, 482–487.
38 Koganesawa N, Aizawa T, Shimojo H, Miura K, Ohni-
shi A, Demura M, Hayakawa Y, Nitta K & Kawano K
(2002) Expression and purification of a small cytokine
growth-blocking peptide from armyworm Pseudaletia
separata by an optimized fermentation method using
the methylotrophic yeast Pichia pastoris. Protein Expr
Purif 25, 416–425.
39 Yoshimura K, Toibana A, Kikuchi K, Kobayashi M,
Hayakawa T, Nakahama K, Kikuchi M & Ikehara M
(1987) Differences between Saccharomyces cerevisiae
and Bacillus subtilis in secretion of human lysozyme.
Biochem Biophys Res Commun 145, 712–718.
40 Miller GL & Golder RH (1950) Buffers of pH 2 to 12
for use in electrophoresis. Arch Biochem 29, 420–423.
41 Otwinowski Z & Minor W (1997) Processing of x-ray
diffraction data collected in oscillation mode. In
Macromolecular Crystallography, Part A (Carter CWJ
& Sweet RM, eds), pp. 307–326. Academic Press,
San Diego.
42 Vagin A & Teplyakov A (2000) An approach to multi-
copy search in molecular replacement. Acta Crystallogr
D Biol Crystallogr 56, 1622–1624.
43 Collaborative Computational Project, Number 4 (1994)
The CCP4 suite – programs for protein crystallography.
Acta Crystallogr D Biol Crystallogr 50, 760–763.
44 Artymiuk PJ & Blake CCF (1981) Refinement of
human lysozyme at 1.5 A resolution analysis of non-
bonded and hydrogen-bond interactions. J Mol Biol
152, 737–762.
45 Murshudov GN, Vagin AA & Dodson EJ (1997)
Refinement of macromolecular structures by the maxi-
mum-likelihood method. Acta Crystallogr D Biol Crys-
tallogr 53, 240–255.
46 Emsley P & Cowtan K (2004) Coot: model-building
tools for molecular graphics. Acta Crystallogr D Biol
Crystallogr 60, 2126–2132.
47 Griko YV, Freire E, Privalov G, van Dael H & Priva-
lov PL (1995) The unfolding thermodynamics of c-type
lysozymes: a calorimetric study of the heat denaturation
of equine lysozyme. J Mol Biol
252, 447–459.
48 Meiler J (2003) Proshift: protein chemical shift predic-
tion using artificial neural networks. J Biomol NMR 26,
25–37.
49 Gasteiger E, Hoogland C, Gattiker A, Duvaud S,
Wilkins MR, Appel RD & Bairoch A (2005) Protein
identification and analysis tools on the ExPASy server.
In The Proteomics Protocols Handbook (Walker JM,
ed.), pp. 571–607. Humana Press, Totowa, NJ.
50 Koradi R, Billeter M & Wuthrich K (1996) Molmol: a
program for display and analysis of macromolecular
structures. J Mol Graph 14, 51–55, 29–32.
Structure and stability of bovine stomach lysozyme Y. Nonaka et al.
2200 FEBS Journal 276 (2009) 2192–2200 ª 2009 The Authors Journal compilation ª 2009 FEBS