Báo cáo khoa học: Allosteric and binding properties of Asp1–Glu382 truncated recombinant human serum albumin – an optical and NMR spectroscopic investigation pot
Bạn đang xem bản rút gọn của tài liệu. Xem và tải ngay bản đầy đủ của tài liệu tại đây (338.92 KB, 10 trang )
Allosteric and binding properties of Asp1–Glu382
truncated recombinant human serum albumin – an optical
and NMR spectroscopic investigation
Gabriella Fanali
1
, Giorgio Pariani
1
, Paolo Ascenzi
2,3
and Mauro Fasano
1
1 Dipartimento di Biologia Strutturale e Funzionale, Universita
`
dell’Insubria, Busto Arsizio, Italy
2 Istituto Nazionale per le Malattie Infettive IRCCS ‘Lazzaro Spallanzani’, Roma, Italy
3 Laboratorio Interdisciplinare di Microscopia Elettronica, Universita
`
Roma Tre, Roma, Italy
Human serum albumin (HSA), the most prominent
protein in plasma, is best known for its exceptional
ligand-binding capacity, the most strongly bound com-
pounds being hydrophobic organic anions of medium
size, long-chain fatty acids, heme, and bilirubin. More-
over, HSA abundance (its concentration being
45 mgÆmL
)1
in serum of healthy human adults) makes
it an important determinant of the pharmacokinetic
behavior of many drugs. HSA also accounts for most
of the antioxidant capacity of human serum. Further-
more, HSA participates in heme iron reuptake follow-
ing hemolytic events, acts as an NO depot, and
displays (pseudo)enzymatic properties [1,2].
The amino acid sequence of HSA shows three
homologous domains, probably arising from divergent
evolution of a degenerated ancestral gene followed by
a fusion event. Terminal regions of sequential domains
contribute to the formation of interdomain helices
linking domain I to domain II, and domain II to
domain III, respectively. On the other hand, each
domain is known to be composed of two separate sub-
domains (named A and B), connected by a random
coil. The multidomain structural organization of HSA
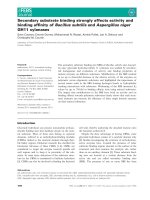
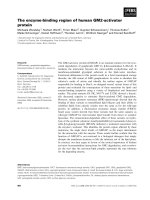
provides a variety of ligand-binding sites (Fig. 1) [1–5].
Among them, two main drug-binding regions have
been identified, and named as Sudlow’s sites [6].
Keywords
human serum albumin; ibuprofen; nuclear
magnetic relaxation dispersion; truncated
human serum albumin; warfarin
Correspondence
M. Fasano, Dipartimento di Biologia
Strutturale e Funzionale, Universita
`
dell’Insubria, Via A. da Giussano, 12,
I-21052 Busto Arsizio (VA), Italy
Fax: +39 0331 339459
Tel: +39 0331 339450
E-mail:
(Received 10 October 2008, revised 29
December 2008, accepted 6 February 2009)
doi:10.1111/j.1742-4658.2009.06952.x
Human serum albumin (HSA) is known for its exceptional ligand-binding
capacity; indeed, its modular domain organization provides a variety of
ligand-binding sites. Its flexible modular structure involves more than the
immediate vicinity of the binding site(s), affecting the ligand-binding prop-
erties of the whole protein. Here, biochemical characterization by
1
H-NMR relaxometry and optical spectroscopy of a truncated form of
HSA (tHSA) encompassing domains I and II (Asp1–Glu382) is reported.
Removal of the C-terminal domain III results in a number of contacts that
involve domain I (containing the heme site) and domain II (containing the
warfarin site) being lost; however, the allosteric linkage between heme and
warfarin sites is maintained. tHSA shows a nuclear magnetic relaxation dis-
persion profile similar to that of HSA, and displays increased affinity for
ibuprofen, warfarin, and heme, suggesting that the fold is preserved. More-
over, the allosteric properties that make HSA a peculiar monomeric protein
and account for the regulation of ligand-binding modes by heterotropic
interactions are maintained after removal of domain III. Therefore, tHSA
is a valuable model with which to investigate allosteric properties of
HSA, allowing independent analysis of the linkages between different
drug-binding sites.
Abbreviations
HSA, human serum albumin; NMRD, nuclear magnetic relaxation dispersion; tHSA, truncated human serum albumin; ZFS, zero field
splitting.
FEBS Journal 276 (2009) 2241–2250 ª 2009 The Authors Journal compilation ª 2009 FEBS 2241
Ibuprofen, a nonsteroidal anti-inflammatory agent,
and warfarin, a coumarinic anticoagulant drug, are
considered to be stereotypical ligands for Sudlow’s
site II and Sudlow’s site I, respectively.
Warfarin binds to Sudlow’s site I with
K
d
= 3.0 · 10
)6
m, in a pocket formed by the packing
of all six helices of subdomain IIA [3,7–9]. The interac-
tion between warfarin and HSA appears to be domi-
nated by hydrophobic contacts, although specific
electrostatic interactions are observed. Ibuprofen binds
primarily to Sudlow’s site II, with K
d
= 1.8 · 10
)6
m
[3,10,11]. Site II is composed of all six helices of sub-
domain IIIA, and it is topologically similar to site I,
with the exception that it may accommodate two fatty
acid anions. A secondary ibuprofen site has been
located at the interface between subdomains IIA and
IIB [12]. Moreover, multiple recognition sites for drug,
fatty acid and hormone binding to HSA have also
been identified [1,2,8,12,13].
Heme endows HSA with peculiar optical and mag-
netic spectroscopic properties, which can be used to
investigate ligand-dependent and pH-dependent struc-
tural properties [9,14–19]. Heme binds to HSA in a
D-shaped cavity limited by Tyr138 and Tyr161, which
provide p–p stacking interactions with the porphyrin;
Tyr161 supplies a donor oxygen to the ferric heme
iron, forming a pentacoordinate high-spin system [20].
Heme propionates point towards the interface between
domains I and III, and are stabilized by salt bridges
with Arg114 and Lys190 residues [21,22]. Interestingly,
the heme site of HSA has a low affinity for long-chain
and medium-chain fatty acids, suggesting that its
geometry has evolved to specifically bind to the heme
[23,24].
The conformational adaptability of HSA involves
more than the immediate vicinity of the binding site(s),
affecting both the structure and the ligand-binding
properties of the whole HSA molecule, which displays
ligand-dependent allosteric conformational transi-
tion(s) [1,2]. Heme regulates drug binding to Sudlow’s
site I by heterotropic interactions. Indeed, the affinity
of Fe(III)heme for HSA decreases by about one order
of magnitude upon drug binding, and accordingly
Fe(III)heme binding to HSA decreases drug affinity to
the same extent. Therefore, drugs that bind to Sud-
low’s site I (e.g. warfarin) act as allosteric effectors for
Fe(III)heme association, and vice versa [9,18,25–29].
Also, the heme cleft and the secondary ibuprofen site
are allosterically coupled [18,23]. Furthermore, drugs
allosterically modulate heme–HSA reactivity [20,30].
HSA also undergoes pH-induced conformational
transitions. Between pH 2.7 and pH 4.3, HSA shows a
fast-migrating (F) form, characterized by a dramatic
increase in viscosity, low solubility, and a significant
loss of the a-helical content. Between pH 4.3 and
pH 8.0, and in the absence of allosteric effectors, HSA
displays the neutral (N) form, which is characterized
by a ‘heart-shaped’ structure. At pH values > 8, and
in the absence of ligands, HSA changes conformation
to the basic (B) form, which displays increased affinity
for some ligands [1–3,9,14–16,19,31–33].
Few years ago, five recombinant HSA fragments
were prepared and characterized, in order to identify
the protein region containing the warfarin primary
binding site [7,34]. Here, we report a thorough bio-
chemical characterization, including Fe(III)heme-bind-
ing properties, of a truncated form of HSA (tHSA)
encompassing residues Asp1–Glu382, which corre-
spond to domains I and II. On the basis of the three-
dimensional structure of full-length HSA, tHSA
contains the primary binding sites for heme and warfa-
rin, and the secondary ibuprofen-binding site (Fig. 1).
Results and Discussion
Dynamics and hydration of tHSA
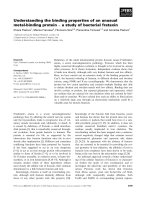
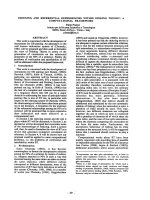
Figure 2 shows the nuclear magnetic relaxation disper-
sion (NMRD) profiles of 1.0 · 10
)3
m HSA and tHSA
solutions at pH 7.0 and 25 °C. The data shown here
have been analyzed using Eqn (1), and are consistent
with a molecular correlation time s
c
of 20 ± 1 ns for
tHSA, which appears reasonable in comparison to
s
c
= 48 ± 2 ns obtained for full-length HSA under
the same experimental conditions (Table 1). Indeed,
the molecular correlation time is dependent on the
molecular mass of the molecule. A systematic analysis
Fig. 1. Heme (Protein Data Bank entry: 1O9X [22]), warfarin (Pro-
tein Data Bank entry: 2BXD [12]), and ibuprofen (Protein Data Bank
entry: 2BXG [12]) modes of binding to HSA. Domains I and II are
rendered as blue and orange ribbons, respectively. Domain III,
which has been removed in tHSA, is rendered as pale red ribbons.
Heme, warfarin and ibuprofen are rendered in black as ball and
stick.
Allosteric properties of truncated albumin G. Fanali et al.
2242 FEBS Journal 276 (2009) 2241–2250 ª 2009 The Authors Journal compilation ª 2009 FEBS
of a number of proteins with different sizes indicates
that such a value could be expected for a 44 kDa pro-
tein [35]; therefore, solution dynamics indicate that
tHSA is not aggregated or misfolded.
The analysis of the amplitude of the NMRD profile
[i.e. b in Eqn (1)] can provide quantitative informa-
tion on the number of water molecules contributing to
the overall NMRD effect [see Eqns (1,2) and Table 1].
tHSA shows a b-value of (1.3 ± 0.1) · 10
7
s
)2
,as
compared to the value of (2.2 ± 0.1) · 10
7
s
)2
observed for full-length HSA. By assuming that the
b-values obtained by the model-free analysis according
to Eqn (1) of the data shown in Fig. 2 are due to bur-
ied water molecules and exchangeable protons, and by
taking into account that the generalized order para-
meter S
I
is reported to fall in the range 0.5–1 [36], we
should expect that about 51 water molecules are local-
ized within the tertiary structure of tHSA, as com-
pared to 88 water molecules in full-length HSA.
Moreover, all of the water molecules appear to be able
to exchange with bulk water in a time longer than the
reorientational correlation time of the protein and
shorter than their own relaxation time [36,37]. There-
fore, removal of domain III dramatically affects pro-
tein hydration, with a reduction of internal water
molecules by a factor of two, independently of the
value of the S
I
parameter (in the range 0.5–1).
Binding of Fe(III)heme to tHSA
tHSA contains the complete primary heme-binding
site, and shows optical and magnetic spectroscopic
properties comparable to those of the full-length pro-
tein. Heme binds to tHSA, at pH 7.0 and 25 °C
(Fig. S1), with K
d
= 7.4 · 10
)8
m (i.e. K
1
in
Scheme 1), indicating that the Fe(III)heme affinity for
tHSA is slightly higher than that reported for HSA
(K
d
= 5.0 · 10
)7
m, i.e. K
5
in Scheme 2 [18]). Heme is
known to drive the allosteric transition towards the
B-state, thus perturbing molecular contacts between
the HSA subdomains that stabilize the N-state [8,38].
The affinity constant observed here indicates, there-
fore, that the geometry of the Fe(III)heme-binding site
is preserved. Moreover, the small, although significant,
increase in Fe(III)heme affinity for tHSA could result
from the removal of molecular contacts between
domains I and III that could hinder the N to B transi-
tion in full-length HSA.
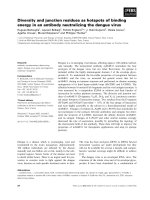
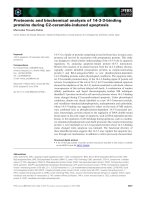
Figure 3 shows the electronic absorption spectra of
Fe(III)heme–tHSA and of full-length Fe(III)heme–
HSA. For both Fe(III)heme–proteins, the Soret band
Fig. 2. NMRD profiles of full-length HSA (filled squares) and tHSA
(open circles), at pH 7.0 and 25 °C. The protein concentration was
1.0 · 10
)3
M. The continuous lines were obtained by analysis of
the data according to Eqn (1). For details, see text.
Table 1. Parameters obtained from the fitting procedure of NMRD
data in Fig. 2 using Eqns (1,2).
tHSA HSA
D (s
)1
) 0.15 0.16
b (s
)2
) 1.3 · 10
7
2.2 · 10
7
v 0.77 0.76
s
c
(s) 2.0 · 10
)8
4.8 · 10
)8
N
I
51 88
tHSA + heme
Heme–tHSA
K
1
+ L
+ L
K
2
K
4
tHSA–L + heme
Heme–tHSA–L
K
3
Scheme 1. Equilibria for heme and drug binding to tHSA, according
to linked functions [48].
HSA + heme
Heme–HSA
K
5
+ L
+ L
K
6
K
8
HSA–L + heme
Heme–HSA–L
K
7
Scheme 2. Equilibria for heme and drug binding to HSA, according
to linked functions [48].
G. Fanali et al. Allosteric properties of truncated albumin
FEBS Journal 276 (2009) 2241–2250 ª 2009 The Authors Journal compilation ª 2009 FEBS 2243
is characterized by a maximum at 400 nm, which is
consistent with the high-spin state of the Fe(III) atom.
The intensity of the Soret absorption is only slightly
affected on going from pH 7 to pH 11. On the other
hand, a shoulder at 360 nm appears in Fe(III)heme–
tHSA at pH > 9; this spectral change is not observed
in Fe(III)heme–HSA. This finding might be accounted
for by significant differences in the B-state of tHSA
with respect to full-length HSA, potentially arising
from the loss of contacts between domains I and III.
Relaxometric properties of Fe(III)heme–tHSA
Fe(III)heme–HSA has been widely investigated by
1
H-
NMR relaxometry [14,18,19,37]. The high value of the
paramagnetic contribution to the paramagnetic rela-
xivity (R
1p
) of Fe(III)heme–HSA (12.5 mm
)1
Æs
)1
at
0.01 MHz, and 4.0 mm
)1
Æs
)1
at 10 MHz, respectively,
pH 7.0 and 25 °C) has been formerly ascribed to the
occurrence of slowly exchanging water molecules in
the surroundings of the paramagnetic Fe(III)heme cen-
ter [14,18]. Indeed, the high number of internal water
molecules calculated above supports this statement.
The paramagnetic contribution to the solvent water
proton relaxation rate observed for Fe(III)heme–HSA
is quite large as compared to oxygen-carrier heme–pro-
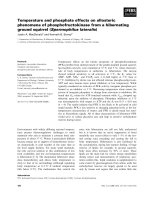
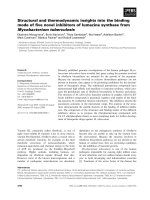
teins in the ferric form [39–43]. Figure 4 shows the
NMRD profiles of heme–HSA and heme–tHSA. The
paramagnetic contribution is dependent on the Larmor
frequency, as expected for an S =5⁄ 2 high-spin sys-
tem [44]. Owing to the zero field splitting (ZFS) of the
S =5⁄ 2 manifold, NMRD data cannot be analyzed in
terms of the classic Solomon–Bloembergen–Morgan
approach [45]. In slowly rotating systems, where the
electronic relaxation time is shorter than the reorienta-
tional correlation time, the ZFS Hamiltonian interacts
with the Zeeman Hamiltonian in a time-dependent
way, and the electronic relaxation cannot be described
simply in terms of electron dipole–dipole interaction.
Although a rigorous approach would take into
account the orientation and the magnitude of the ZFS
tensor by numerical methods [46], a set of simplified
equations have been proposed to analytically describe
the electronic relaxation in S >1⁄ 2 systems (see
Experimental procedures) [47].
By fitting NMRD profiles using Eqns (3–11), a set
of parameters governing the electronic relaxation was
obtained (Table 2). It is noteworthy that the exchange
lifetime (s
M
) of the localized water molecules close to
the Fe(III)heme does not change significantly. The
A
B
Fig. 3. Visible region of the electronic absorption spectra of Fe(III)-
heme–tHSA (A) and Fe(III)heme–HSA (B), at 25.0 ° C. The protein
concentration was 1.0 · 10
)6
M in 1.0 · 10
)1
M phosphate buffer.
The pH values were changed from 7.0 to 11.0 by using 1.0
M
NaOH (pH 7.0, continuous line; pH 8.0, dotted line; pH 9.0, dash–
dot line; pH 10.0, dash–dot–dot line; pH 11.0, short dash–dot line).
For details, see text.
Fig. 4. NMRD profile of 1.0 · 10
)3
M Fe(III)heme–HSA (filled
squares) and of 1.0 · 10
)3
M Fe(III)heme–tHSA (open circles), at
pH 7.0 and 25 °C. The continuous lines were obtained by the analy-
sis of data according to Eqns (3–11). For details, see text and
Experimental procedures.
Allosteric properties of truncated albumin G. Fanali et al.
2244 FEBS Journal 276 (2009) 2241–2250 ª 2009 The Authors Journal compilation ª 2009 FEBS
orientation and magnitude of the ZFS tensor, as well
as the correlation time for the static ZFS modulation
(s
v
), are slightly affected in tHSA with respect to full-
length HSA, reflecting possible rearrangements of the
heme without relevant structural changes; it should be
noted that the reduction of the s
v
parameter from
3.0 · 10
)11
s in the full-length HSA to 1.5 · 10
)11
sin
the truncated protein reflects the reduction of the
molecular mass and thus the time constant of the static
ZFS modulation. On the other hand, the population
of localized water molecules close to Fe(III)heme is
reduced to 53%. If it is assumed that, on average, four
water molecules reside at an average distance of 3.3 A
˚
from iron ion in Fe(III)heme–HSA, this number is
reduced to 2.1 in Fe(III)heme–tHSA. Interestingly, the
fraction of water molecules close to Fe(III)heme
reflects the overall reduction of the number of water
molecules within tHSA (58%) as calculated from the
data in Fig. 2. Moreover, the almost coincident corre-
spondence between all the other parameters indicates
that the Fe(III)heme geometry is not significantly
affected by removal of domain III.
Drug binding to tHSA and to Fe(III)heme–tHSA
To ascertain whether drug binding affects heme affin-
ity, Fe(III)heme binding to tHSA was investigated in
the presence of ibuprofen and warfarin. Analysis of
binding isotherms (Fig. S2) according to Eqn (12)
allowed us to obtain K
d
= 3.4 · 10
)6
m for Fe(III)-
heme binding to tHSA in the presence of 1.0 · 10
)4
m
ibuprofen, and K
d
= 3.0 · 10
)6
m (i.e. K
3
in
Scheme 1) for Fe(III)heme binding to tHSA in the
presence of 1.0 · 10
)5
m warfarin (Table 2). The anal-
ysis of hyperbolic binding curves (Fig. S3) according
to Eqn (12) allowed us to obtain K
d
= 1.3 · 10
)5
m
for ibuprofen binding to Fe(III)heme–tHSA, and
K
d
= 5.0 · 10
)6
m for warfarin binding to Fe(III)-
heme–tHSA (i.e. K
4
in Scheme 1). According to linked
functions [48], K
2
Æ K
3
= K
1
Æ K
4
. Therefore, from the
data reported above, it is possible to obtain the value
of the dissociation equilibrium constants for tHSA–
ibuprofen (K
d
= 2.8 · 10
)7
m) and tHSA–warfarin
(K
d
= 1.2 · 10
)7
m) complex formation, respectively
(i.e. K
2
in Scheme 1; see Table 4).
For comparison, Fe(III)heme binding to full-length
HSA in the presence of drugs was investigated. Values
of K
d
obtained by data analysis according to Eqn (12)
are reported in Table 3. In the presence of ibuprofen
(Fig. S4), the K
d
value for Fe(III)heme–HSA complex
formation (K
d
= 3.9 · 10
)6
m, i.e. K
7
in Scheme 2) is
similar to the K
d
value for Fe(III)heme–tHSA complex
formation (K
d
= 3.4 · 10
)6
m), under the same experi-
mental conditions. Also in the presence of warfarin,
the affinity of Fe(III)heme for HSA (K
d
= 1.2 ·
10
)6
m, i.e. K
7
in Scheme 2) is similar to that reported
for Fe(III)heme–tHSA complex formation (K
d
= 3.0 ·
10
)6
m).
Finally, the effect of Fe(III)heme on drug affinity
for full-length HSA was taken into account (Fig. S5).
Ibuprofen binds to Fe(III)heme–HSA with
K
d
= 5.4 · 10
)6
m (i.e. K
8
in Scheme 2). Interestingly,
this value is smaller than that obtained for ibuprofen
binding to Fe(III)heme–tHSA (K
d
= 1.3 · 10
)5
m)
under the same experimental conditions, indicating a
higher affinity of ibuprofen for full-length HSA. As
the binding isotherms were obtained by measuring
changes in the Soret band of Fe(III)heme, binding of
ibuprofen to a site that does not alter the heme envi-
ronment would be spectroscopically silent. Conversely,
the K
d
value for warfarin binding to full-length
Fe(III)heme–HSA (K
d
= 3.1 · 10
)6
m, i.e. K
8
in
Scheme 2) is not significantly different from that
obtained for warfarin binding to Fe(III)heme–tHSA
(K
d
= 5.0 · 10
)6
m) (Table 4). According to linked
Table 2. Parameters obtained from the fitting procedure of NMRD
data in Fig. 4 using Eqns (3–11).
tHSA HSA
q (a.u.) 2.1 4.0
r (A
˚
) 3.3 3.3
s
M
(s) 8.0 · 10
)6
6.6 · 10
)6
s
v
(s) 1.5 · 10
)11
3.0 · 10
)11
h (°)36 45
D (cm
)1
)49 41
D (radÆs
)2
) 1.6 · 10
18
1.6 · 10
18
Table 4. Values of the equilibrium dissociation constants (K
d
, M) for
drug binding to tHSA and HSA in the absence and in the presence
of Fe(III)heme, at pH 7.0 and 25 °C.
Drug tHSA
Fe(III)heme–
tHSA HSA
Fe(III)heme–
HSA
Warfarin 1.2 · 10
)7a
5.0 · 10
)6
1.3 · 10
)6a
3.1 · 10
)6
Ibuprofen 2.8 · 10
)7a
1.3 · 10
)5
3.9 · 10
)6a
5.4 · 10
)6
a
Calculated according to linked functions (Schemes 1,2).
Table 3. Values of the equilibrium dissociation constants (K
d
, M) for
Fe(III)heme binding to tHSA and HSA in the absence and presence
of ibuprofen and warfarin, at pH 7.0 and 25 °C.
No drug Warfarin Ibuprofen
tHSA 7.4 · 10
)8
3.0 · 10
)6
3.4 · 10
)6
HSA 5.0 · 10
)7a
1.2 · 10
)6
3.9 · 10
)6
a
From [18].
G. Fanali et al. Allosteric properties of truncated albumin
FEBS Journal 276 (2009) 2241–2250 ª 2009 The Authors Journal compilation ª 2009 FEBS 2245
functions [48], K
6
Æ K
7
= K
5
Æ K
8
. Therefore, from the
data reported above, it is possible to obtain the value
of the dissociation equilibrium constant for full-length
HSA–ibuprofen (K
d
= 3.9 · 10
)6
m) and for full-
length HSA–warfarin (K
d
= 1.3 · 10
)6
m, i.e. K
6
in
Scheme 2) complex formation, respectively (see
Scheme 2 and Table 4).
Conclusion
The data reported here indicate that tHSA is a valuable
model with which to investigate the allosteric properties
of HSA. Indeed, by removal of the C-terminal domai-
n III, a number of contacts that involve domain I (con-
taining the heme site) and domain II (containing the
warfarin site) are lost; nevertheless, the allosteric linkage
between the heme and warfarin (i.e. Sudlow’s site I) sites
is maintained. Moreover, tHSA allows independent
analysis of the linkages between different drug-binding
sites. In the case of ibuprofen, for instance, modulation
of Fe(III)heme affinity cannot be attributed to ibupro-
fen binding to either its primary (in domain III)
or secondary (in domain II) binding site in full-length
HSA. Indeed, after removal of domain III, ibuprofen
binds to a single site, thus allowing investigation of the
effect of the occupancy of the secondary ibuprofen-
binding site on Fe(III)heme affinity.
Finally, it is worth noting that the three ligands
considered here (i.e. ibuprofen, warfarin, and heme)
display an increased affinity for tHSA with respect to
HSA. If tHSA could fold in a different conformation,
or could not achieve a stable fold, it would be reason-
able to envisage that one or more of the considered
ligands would display reduced or no affinity. This defi-
nitely supports the idea that tHSA is a fragment of the
HSA structure with similar folding and similar confor-
mational transitions. The analysis of NMRD profiles
of tHSA and Fe(III)heme–tHSA, as well as the
analysis of the optical spectra of Fe(III)heme–tHSA,
are in agreement with this premise.
The allosteric properties that make HSA a peculiar
monomeric protein and account for the regulation of
ligand-binding modes by heterotropic interactions are
maintained after the removal of domain III. Indeed,
warfarin allosterically inhibits Fe(III)heme binding,
and, in turn, Fe(III)heme allosterically inhibits warfa-
rin binding. Moreover, a similar allosteric mechanism
modulates ibuprofen and Fe(III)heme binding to tHSA
that would not occur in the full-length protein. Actu-
ally, binding of ibuprofen to the (secondary) tHSA
binding site inhibits Fe(III)heme binding, and, in turn,
Fe(III)heme inhibits ibuprofen binding. This finding
explains a former observation that was attributed to
ibuprofen binding to the warfarin site of HSA when
the structural description of the ibuprofen-binding
mode(s) was not available [9].
In conclusion, a detailed analysis of allosteric mech-
anisms that regulate ligand binding to HSA has been
made possible by using a simple model protein (tHSA)
that maintains the allosteric properties of full-length
HSA with a reduced number of binding sites. A deep
understanding of the functional links between different
sites of HSA is essential to avoid critical and unex-
pected changes in the pharmacokinetic properties of
therapeutic drugs.
Experimental procedures
tHSA cloning, expression, and purification
The cDNA sequence of tHSA (corresponding to residues
Asp1–Glu382 of HSA) was amplified by PCR from a
human liver cDNA library, and cloned into pPICZa-A (In-
vitrogen, Carlsbad, CA, USA), downstream of the Saccha-
romyces cerevisiae secretion factor, under the control of the
AOX1 promoter. Primer synthesis and construct sequencing
services were provided by MWG Biotech (Ebersberg,
Germany). The construct was amplified in Escherichia coli,
and subsequently transformed into Pichia pastoris strain
GS115. Cells grown in glycerol medium were harvested and
resuspended in methanol containing the medium to induce
protein synthesis. Protein expression in the medium was
checked by SDS ⁄ PAGE. The medium containing the
expressed protein was ultrafiltered using a 10 kDa cut-off
membrane (Centricon Plus70; Millipore Corporation, Biller-
ica, MA, USA), and the concentrated protein was lyophi-
lized. To remove hydrophobic ligands, the protein was
dissolved in water, acidified to pH 3.5 with acetic acid, and
treated for 2 h with activated charcoal at room temperature
[49]. After charcoal removal by centrifugation (20 000 g for
20 min at 2°C), the pH was brought to 7.0 with aqueous
ammonia. The protein concentration was measured accord-
ing to Bradford [50], and the solution was then partitioned
into aliquots and freeze-dried. The integrity of the protein
was checked by digestion with trypsin and subsequent
MALDI-TOF MS analysis (Reflex III; Bruker Daltonics,
Bremen, Germany). All other reagents (Sigma-Aldrich, St
Louis, MO, USA) were of the highest purity available, and
were used without further purification. HSA (Sigma-
Aldrich, St Louis, MO, USA) was essentially fatty acid-
free, according to the charcoal delipidation protocol
[49,51,52], and was used without further purification.
Protein and ligand solutions
The Fe(III)heme–tHSA and Fe(III)heme–HSA solutions
were prepared by adding the appropriate volume of the
Allosteric properties of truncated albumin G. Fanali et al.
2246 FEBS Journal 276 (2009) 2241–2250 ª 2009 The Authors Journal compilation ª 2009 FEBS
1.2 · 10
)2
m Fe(III)heme solution, dissolved in
1.0 · 10
)1
m NaOH, to a 1.0 · 10
)3
m protein solution in
0.1 m phosphate buffer (pH 7.0), to a final Fe(III)heme–
protein concentration of 1.0 · 10
)3
m. The concentration of
the Fe(III)heme stock solution was checked as bis-imidazo-
late complex in SDS micelles with an extinction coefficient
of 14.5 mm
)1
cm
)1
(at 535 nm) [53]. The ibuprofen solution
was prepared by dissolving the drug in 1.0 · 10
)1
m phos-
phate buffer, at pH 7.0 and 25.0 °C. The warfarin solution
was prepared by stirring the drug in 1.0 · 10
)1
m phos-
phate buffer at pH 12.0 until it dissolved, and then adjust-
ing the pH to 7.0 with HCl (at 25.0 °C).
NMRD
NMRD profiles, i.e. plots of solvent water proton relaxa-
tion rates as a function of the applied magnetic field, were
measured on a Stelar Spinmaster FFC field cycling spec-
trometer (Stelar, Mede, PV, Italy), operating in a field
range from 2.4 · 10
)4
T to 2.35 · 10
)1
T (corresponding to
proton Larmor frequencies from 0.01 MHz to 10 MHz).
The temperature was set at 25 °C by using a built-in tem-
perature controller, and directly measured in the probehead
with a mercury thermometer. The relaxometer is able to
switch the magnetic field strength in a millisecond time-
scale, and works under complete computer control. As a
blank, the measurement of T
1
of the buffer solution
(1.0 · 10
)1
m phosphate buffer, pH 7.0) was performed in
the same range of temperatures. An absolute uncertainty in
1 ⁄ T
1
of about 1%, on average, has been assessed.
NMRD profiles of 1.0 · 10
)3
m tHSA and HSA were
analyzed in terms of a model-free approach [35,36], accord-
ing to Eqn (1):
R
1
ðxÞ¼R
w
TðÞþD þ b 1 À vðÞ0:2JðxÞþ0:8Jð2xÞ½
f
þ v 0:1Jð0Þþ0:3JðxÞþ0:6Jð2xÞ½gð1Þ
where R
w
(T) = 0.9756
T
· 0.6985 is the relaxation rate of
the blank (i.e. of the buffer) solution at any given tempera-
ture T, D is the part of R
1
(x) that remains in the extreme
motional narrowing regime, b is the mean square fluctua-
tion of the lattice variable coupled to the observed nuclear
spin, and s
c
is the correlation time for the time-dependent
spin-lattice coupling. J(x) is the Lorentzian spectral density
function JðxÞ¼
s
c
1 þðxs
c
Þ
2
:
By assuming that the NMRD profile is determined by
water molecules buried within the protein core in intermedi-
ate–fast exchange with bulk water, s
c
turns out to be the
reorientational correlation time, and the amplitude
parameter A would be related to the number of internal
water molecules (N
I
) as described hereafter (Eqn 2).
N
I
S
2
I
¼
b  N
T
x
2
D
ð2Þ
N
T
is the number of total water molecules (per protein),
and x
D
is the intramolecular dipole frequency. In the case
of hydrogen nuclei, x
D
= 2.36 · 10
5
radÆs
)1
. S
I
is the
mean-square generalized order parameter for the internal
water molecules, and cannot be > 1 [39].
NMRD profiles of 1.0 · 10
)3
m Fe(III)heme–tHSA and
Fe(III)heme–HSA were obtained by subtracting from the
measured relaxation rate the relaxation rate of the corre-
sponding apoprotein (i.e. tHSA and HSA) at the same
frequency. Profiles were analyzed in terms of Eqns (3–11)
[47]:
R
1p
¼
Nq
55:56
T
1m
þ s
M
ðÞ
À1
ð3Þ
T
1m
¼ R
1z
þ R
1x
ðÞ
À1
ð4Þ
R
1z
¼
35
3
K
r
6
U
1
h
z
ðÞ
s
Sz
1 þ x
2
I
s
2
Sx
ð5Þ
R
1x
¼
2
3
K
r
6
U
2
h
z
ðÞ
10s
Sx
1þ16c
2
D
2
s
2
Sx
þ
16s
Sx
1þ4c
2
D
2
s
2
Sx
þ
9s
Sx
1þx
2
I
s
2
Sx
ð6Þ
K ¼
15
2
l
0
4p
h
2p
2
c
2
s
c
2
I
SðS þ 1Þð7Þ
U
1
h
z
ðÞ¼
1 þ P
2
cos h
z
ðÞ
3
ð8Þ
U
2
h
z
ðÞ¼
2 À P
2
sin h
z
ðÞ
6
ð9Þ
s
À1
Sz
¼
2
35
½4SðS þ 1ÞÀ3D
2
Â
40s
m
1 þ 4c
2
D
2
s
2
v
þ
80s
m
1 þ 16c
2
D
2
s
2
v
þ
160s
v
1 þ 36c
2
D
2
s
2
v
ð10Þ
s
À1
Sx
¼
2
35
½4SðSþ1ÞÀ3D
2
 168s
v
þ
152s
v
1 þ4c
2
D
2
s
2
v
þ
200s
v
1 þ16c
2
D
2
s
2
v
þ
40s
v
1 þ36c
2
D
2
s
2
v
ð11Þ
where N is the molar concentration of Fe(III)heme, q is the
number of water molecules coordinated to the metal ion,
r is the average distance between the metal ion and the
protons of the water molecules, s
M
is their mean residence
lifetime, x
I
is the proton Larmor frequency, P
2
(x) is the
second-order Legendre polynomial, s
v
is the correlation
time of the modulation of the transient ZFS, D is the aver-
age energy of the electron–ZFS coupling, D is the energy
separation of ZFS levels, h is the orientation of the ZFS
tensor in the molecular frame with respect to the laboratory
frame, c is the speed of light, l
0
is the permeability of
vacuum, h is the Planck constant, S is the electron spin
quantum number, and c
S
and c
I
are the electron and the
proton nuclear magnetogyric ratios, respectively.
G. Fanali et al. Allosteric properties of truncated albumin
FEBS Journal 276 (2009) 2241–2250 ª 2009 The Authors Journal compilation ª 2009 FEBS 2247
Optical binding studies
Fe(III)heme binding to HSA and tHSA, in the absence
and presence of 1.0 · 10
)4
m ibuprofen and 1.0 · 10
)5
m
warfarin, was investigated spectrophotometrically using an
optical cell with 1.0 cm path length on a Cary 50 Bio
spectrophotometer (Varian Inc., Palo Alto, CA, USA). In
experiments carried out at different Fe(III)heme concen-
trations, a small amount of the 1.0 · 10
)3
m HSA or
tHSA solution was diluted in the optical cell in
1.0 · 10
)1
m phosphate buffer and 10% dimethylsulfoxide
(pH 7.0), to a final protein concentration of 1.0 · 10
)6
m.
Then, small amounts of Fe(III)heme (1.2 · 10
)2
m) were
added to the protein solution, and the absorbance spectra
were recorded after incubation for few minutes, after
each addition. In experiments carried out at different
drug concentrations, a small amount of Fe(III)heme
(1.2 · 10
)2
m) and of HSA solution (about 1.0 · 10
)3
m)
was diluted in the optical cell in 1.0 · 10
)1
m phosphate
buffer and 10% dimethylsulfoxide (pH 7.0), to a final
Fe(III)heme–HSA or Fe(III)heme–tHSA concentration of
1.0 · 10
)6
m. Then, small aliquots of 1.0 · 10
)3
m
ibuprofen or 2.0 · 10
)2
m warfarin were added to the
Fe(III)heme–protein solution, and the absorbance spectra
were recorded after incubation for a few minutes after
each addition. Binding isotherms were analyzed by
plotting the absorbance change as a function of the
ligand concentration. Data were analyzed according to
Eqn (12):
where DA is the difference in the Soret band (400 nm)
absorbance, DA
max
is the absorbance difference at
saturating ligand concentration, K
d
is the dissociation
equilibrium constant for ligand–protein complex
formation, [L
t
] is the total concentration of the variable
ligand [Fe(III)heme, warfarin, or ibuprofen], [P
t
] is the
total concentration of the protein [(t)HSA, Fe(III)heme–
(t)HSA, warfarin–(t)HSA, or ibuprofen–(t)HSA], and N
is the number of equivalent binding sites (N = 1 for
both tHSA and HSA for each of the three ligands
considered).
Acknowledgements
We gratefully acknowledge S. Aime and S. Baroni for
helpful discussions.
References
1 Fasano M, Curry S, Terreno E, Galliano M, Fanali G,
Narciso P, Notari S & Ascenzi P (2005) The extraordi-
nary ligand binding properties of human serum albu-
min. IUBMB Life 57, 787–796.
2 Ascenzi P, Bocedi A, Notari S, Fanali G, Fesce
R & Fasano M (2006) Allosteric modulation of drug
binding to human serum albumin. Mini Rev Med Chem
6, 483–489.
3 Peters T Jr (ed.) (1996) All about Albumin: Biochemistry,
Genetics and Medical Applications. Academic Press, San
Diego; London.
4 Curry S, Mandelkov H, Brick P & Franks N (1998)
Crystal structure of human serum albumin complexed
with fatty acid reveals an asymmetric distribution of
binding sites. Nat Struct Biol 5, 827–835.
5 Curry S (2002) Beyond expansion: structural studies on
the transport roles of human serum albumin. Vox Sang
83, 315–319.
6 Sudlow G, Birkett DJ & Wade DN (1975) The charac-
terization of two specific drug binding sites on human
serum albumin. Mol Pharmacol 11, 824–832.
7 Dockal M, Chang M, Carter DC & Ru
¨
ker F (2000)
Five recombinant fragments of human serum albumin.
Tools for the characterization of the warfarin binding
site. Protein Sci 9, 1455–1465.
8 Petitpas I, Bhattacharya AA, Twine S, East M & Curry
S (2001) Crystal structure analysis of warfarin binding
to human serum albumin: anatomy of drug site I. J Biol
Chem 276, 22804–22809.
9 Baroni S, Mattu M, Vannini A, Cipollone R, Aime S,
Ascenzi P & Fasano M (2001) Effect of ibuprofen and
warfarin on the allosteric properties of haem–human
serum albumin. A spectroscopic study. Eur J Biochem
268, 6214–6220.
10 Hage DS, Noctor TA & Wainer IW (1995) Character-
ization of the protein binding of chiral drugs by high-
performance affinity chromatography. Interactions of
R- and S-ibuprofen with human serum albumin.
J Chromatogr A 693, 23–32.
11 Chen J, Fitos I & Hage DS (2006) Chromatographic
analysis of allosteric effects between ibuprofen and ben-
zodiazepines on human serum albumin. Chirality 18,
24–36.
DA ¼
DA
max
Á K
À1
d
Á L
t
½þN Á P
t
½ÁK
À1
d
þ 1
ÀÁ
À
ffiffiffiffiffiffiffiffiffiffiffiffiffiffiffiffiffiffiffiffiffiffiffiffiffiffiffiffiffiffiffiffiffiffiffiffiffiffiffiffiffiffiffiffiffiffiffiffiffiffiffiffiffiffiffiffiffiffiffiffiffiffiffiffiffiffiffiffiffiffiffiffiffiffiffiffiffiffiffiffiffiffiffiffiffiffiffiffiffiffiffiffiffiffiffiffiffiffiffiffiffiffiffiffiffi
K
À1
d
Á L
t
½þN Á P
t
½ÁK
À1
d
þ 1
ÀÁ
2
À4K
À2
d
Á L
t
½ÁN Á P
t
½
q
!
2K
À1
d
Á L
t
½
ð12Þ
Allosteric properties of truncated albumin G. Fanali et al.
2248 FEBS Journal 276 (2009) 2241–2250 ª 2009 The Authors Journal compilation ª 2009 FEBS
12 Ghuman J, Zunszain PA, Petitpas I, Bhattacharya AA,
Otagiri M & Curry S (2005) Structural basis of the
drug-binding specificity of human serum albumin.
J Mol Biol 353, 38–52.
13 Sugio S, Kashima A, Mochizuki S, Noda M & Kobay-
ashi K (1999) Crystal structure of human serum albu-
min at 2.5 A
˚
resolution. Protein Eng 12, 439–446.
14 Fasano M, Baroni S, Vannini A, Ascenzi P & Aime S
(2001) Relaxometric characterization of human hemal-
bumin. J Biol Inorg Chem 6, 650–658.
15 Mattu M, Vannini A, Coletta M, Fasano M & Ascenzi
P (2001) Effect of bezafibrate and clofibrate on the
heme-iron geometry of ferrous nitrosylated heme–
human serum albumin: an EPR study. J Inorg Biochem
84, 293–296.
16 Fasano M, Mattu M, Coletta M & Ascenzi P (2002)
The heme-iron geometry of ferrous nitrosylated heme–
serum lipoproteins, hemopexin, and albumin: a compar-
ative EPR study. J Inorg Biochem 91, 487–490.
17 Monzani E, Curto M, Galliano M, Minchiotti L, Aime
S, Baroni S, Fasano M, Amoresano A, Salzano AM,
Pucci P et al. (2002) Binding and relaxometric proper-
ties of heme complexes with cyanogen bromide
fragments of human serum albumin. Biophys J 83,
2248–2258.
18 Fanali G, Bocedi A, Ascenzi P & Fasano M (2007)
Modulation of heme and myristate binding to human
serum albumin by anti-HIV drugs. An optical and
NMR spectroscopic study. FEBS J 274, 4491–4502.
19 Fanali G, Ascenzi P & Fasano M (2007) Effect of
prototypic drugs ibuprofen and warfarin on global
chaotropic unfolding of human serum heme–albumin: a
fast-field-cycling
1
H-NMR relaxometric study. Biophys
Chem 129, 29–35.
20 Nicoletti FP, Howes BD, Fittipaldi M, Fanali G, Fasano
M, Ascenzi P & Smulevich G (2008) Ibuprofen induces
an allosteric conformational transition in the heme com-
plex of human serum albumin with significant effects on
heme ligation. J Am Chem Soc 130, 11677–11688.
21 Wardell M, Wang Z, Ho JX, Robert J, Ru
¨
ker F, Ruble
J & Carter DC (2002) The atomic structure of human
methemalbumin at 1.9 A
˚
. Biochem Biophys Res Com-
mun 291, 813–819.
22 Zunszain PA, Ghuman J, Komatsu T, Tsuchida E &
Curry S (2003) Crystal structural analysis of human
serum albumin complexed with hemin and fatty acid.
BMC Struct Biol 3, 6, doi:10.1186/1472-6807-3-6.
23 Simard JR, Zunszain PA, Hamilton JA & Curry S
(2006) Location of high and low affinity fatty acid
binding sites on human serum albumin revealed by
NMR drug-competition analysis. J Mol Biol 361,
336–351.
24 Fasano M, Fanali G, Leboffe L & Ascenzi P (2007)
Heme binding to albuminoid proteins is the result of
recent evolution. IUBMB Life 59, 436–440.
25 Chuang VTG & Otagiri M (2002) How do fatty acids
cause allosteric binding of drugs to human serum albu-
min? Pharm Res 19, 1458–1464.
26 Fitos I, Visy J & Kardos J (2002) Stereoselective kinet-
ics of warfarin binding to human serum albumin: effect
of an allosteric interaction. Chirality 14, 442–448.
27 Chen J, Ohnmacht C & Hage DS (2004) Studies of
phenytoin binding to human serum albumin by high-
performance affinity chromatography. J Chromatogr
B Analyt Technol Biomed Life Sci 809, 137–145.
28 Ascenzi P, Bocedi A, Bolli A, Fasano M, Notari S &
Polticelli F (2005) Allosteric modulation of monomeric
proteins. Biochem Mol Biol Educ 33, 169–176.
29 Kim HS & Hage DS (2005) Chromatographic analysis
of carbamazepine binding to human serum albumin.
J Chromatogr B Analyt Technol Biomed Life Sci 816,
57–66.
30 Ascenzi P & Fasano M (2007) Abacavir modulates per-
oxynitrite-mediated oxidation of ferrous nitrosylated
human serum heme–albumin. Biochem Biophys Res
Commun 353, 469–474.
31 Wilting J, van der Giesen WF, Janssen LH, Weideman
MM, Otagiri M & Perrin JH (1980) The effect of albu-
min conformation on the binding of warfarin to human
serum albumin. The dependence of the binding of war-
farin to human serum albumin on the hydrogen,
calcium, and chloride ion concentrations as studied by
circular dichroism, fluorescence, and equilibrium dialy-
sis. J Biol Chem 255, 3032–3037.
32 Yamasaki K, Maruyama T, Yoshimoto K, Tsutsumi Y,
Narazaki R, Fukuhara A, Kragh-Hansen U & Otagiri
M (1999) Interactive binding to the two principal ligand
binding sites of human serum albumin: effect of the
neutral-to-base transition. Biochim Biophys Acta 1432,
313–323.
33 Sakai H, Masada Y, Horinouchi H, Yamamoto M,
Ikeda E, Takeoka S, Kobayashi K & Tsuchida E (2004)
Hemoglobin-vesicles suspended in recombinant human
serum albumin for resuscitation from hemorrhagic
shock in anesthetized rats. Crit Care Med 32, 539–545.
34 Dockal M, Carter DC & Ru
¨
ker F (1999) The three
recombinant domains of human serum albumin. Struc-
tural characterization and ligand binding properties.
J Biol Chem 274, 29303–29310.
35 Bertini I, Fragai M, Luchinat C & Parigi G (2000)
1
H NMRD profiles of diamagnetic proteins: a model-
free analysis. Magn Res Chem 38, 543–550.
36 Halle B, Denisov VP & Venu K (1999) Multinuclear
relaxation dispersion studies of protein hydration. In
Biological Magnetic Resonance: Structure Computation
and Dynamics in Protein NMR (Krishna NR & Berliner
LJ, eds), 17 , 419–484. Kluwer Academic ⁄ Plenum
Publishers, New York.
37 Fasano M, Orsale M, Melino S, Nicolai E, Forlani F,
Rosato N, Cicero D, Pagani S & Paci M (2003) Surface
G. Fanali et al. Allosteric properties of truncated albumin
FEBS Journal 276 (2009) 2241–2250 ª 2009 The Authors Journal compilation ª 2009 FEBS 2249
changes and role of buried water molecules during the
sulfane sulfur transfer in Rhodanese from Azotobacter
vinelandii: a fluorescence quenching,
15
N NMR relaxa-
tion, and nuclear magnetic relaxation dispersion
spectroscopic study. Biochemistry 42, 8550–8557.
38 Fanali G, Fesce R, Agrati C, Ascenzi P & Fasano M
(2005) Allosteric modulation of myristate and Mn(III)-
heme binding to human serum albumin – optical and
NMR spectroscopy characterization. FEBS J 272,
4672–4683.
39 Fabry ME & Eisenstadt M (1974) The mechanism of
water proton nuclear magnetic resonance relaxation in
the presence of mammalian and Aplysia metmyoglobin
fluoride. J Biol Chem 249, 2915–2919.
40 Giacometti GM, Ascenzi P, Brunori M, Rigatti G, Gia-
cometti G & Bolognesi M (1981) Absence of water at
the sixth co-ordination site in ferric Aplysia myoglobin.
J Mol Biol 151, 315–319.
41 Modi S, Behere DV, Mitra S & Bendall DS (1991)
Coordination geometry of haem in cyanogen bromide
modified myoglobin and its effect on the formation
of compound I. J Chem Soc Chem Commun 1991, 830–
831, doi:10.1039/C39910000830.
42 Aime S, Ascenzi P, Fasano M & Paoletti S (1993)
NMR relaxometric studies of water accessibility to
haem cavity in horse heart and sperm whale myoglobin.
Magn Reson Chem 31, S85–S89.
43 Aime S, Fasano M, Paoletti S, Cutruzzola
`
F, Desideri
A, Bolognesi M, Rizzi M & Ascenzi P (1996) Structural
determinants of fluoride and formate binding to hemo-
globin and myoglobin: crystallographic and 1H-NMR
relaxometric study. Biophys J 70, 482–488.
44 Banci L, Bertini I & Luchinat C (1991) Electron and
Nuclear Relaxation. VCH, Weinheim.
45 Schaefle N & Sharp R (2004) Electron spin relaxation
due to reorientation of a permanent zero field splitting
tensor. J Chem Phys 121, 5387–5394.
46 Belorizky E, Fries PH, Helm L, Kowalewski J, Kruk
D, Sharp RR & Westlund PO (2008) Comparison of
different methods for calculating the paramagnetic
relaxation enhancement of nuclear spins as a function
of the magnetic field. J Chem Phys 128, 052315,
doi: 10.1063/1.2833957.
47 Sharp RR (2002) Closed-form expressions for
level-averaged electron spin relaxation times outside the
Zeeman Limit: application to paramagnetic NMR
relaxation. J Magn Res 154 , 269–279.
48 Wyman J (1964) Linked functions and reciprocal effects
in hemoglobin: a second look. Adv Protein Chem 19,
223–286.
49 Cabrera-Crespo J, Goncalves VM, Martins EA, Grellet
S, Lopes AP & Raw I (2000) Albumin purification from
human placenta. Biotechnol Appl Biochem 31, 101–106.
50 Bradford MM (1976) A rapid and sensitive method for
the quantitation of microgram quantities of protein
utilizing the principle of protein-dye binding. Anal
Biochem 72, 248–254.
51 Sogami M & Foster JF (1968) Isomerization reactions of
charcoal-defatted bovine plasma albumin. The N–F tran-
sition and acid expansion. Biochemistry 7, 2172–2182.
52 Chen RF (1967) Removal of fatty acids from serum
albumin by charcoal treatment. J Biol Chem 242, 173–
181.
53 Boffi A, Das TK, Della Longa S, Spagnuolo C & Rous-
seau DL (1999) Pentacoordinate hemin derivatives in
sodium dodecyl sulfate micelles: model systems for the
assignment of the fifth ligand in ferric heme proteins.
Biophys J 77, 1143–1149.
Supporting information
The following supplementary material is available:
Fig. S1. Binding isotherm for Fe(III)heme–tHSA com-
plex formation, at pH 7.0 and 25 °C.
Fig. S2. Fe(III)heme binding to tHSA, at pH 7.0 and
25 °C.
Fig. S3. Drug binding to Fe(III)heme–tHSA, at
pH 7.0 and 25 °C.
Fig. S4. Fe(III)heme binding to HSA in the presence
of drugs, at pH 7.0 and 25 °C.
Fig. S5. Drug binding to Fe(III)heme–HSA, at pH 7.0
and 25 °C.
This supplementary material can be found in the
online version of this article.
Please note: Wiley-Blackwell is not responsible for
the content or functionality of any supplementary
materials supplied by the authors. Any queries (other
than missing material) should be directed to the corre-
sponding author for the article.
Allosteric properties of truncated albumin G. Fanali et al.
2250 FEBS Journal 276 (2009) 2241–2250 ª 2009 The Authors Journal compilation ª 2009 FEBS