Báo cáo khoa học: ThermoFAD, a ThermofluorÒ-adapted flavin ad hoc detection system for protein folding and ligand binding pdf
Bạn đang xem bản rút gọn của tài liệu. Xem và tải ngay bản đầy đủ của tài liệu tại đây (415.01 KB, 8 trang )
ThermoFAD, a Thermofluor
Ò
-adapted flavin ad hoc
detection system for protein folding and ligand binding
Federico Forneris, Roberto Orru, Daniele Bonivento, Laurent R. Chiarelli and Andrea Mattevi
Department of Genetics and Microbiology, University of Pavia, Italy
Identification of optimal purification and storage con-
ditions is one the most critical investigations in the
biochemical analysis of a protein. Challenging projects
such as characterisation of macromolecular complexes,
membrane proteins or large multidomain human pro-
teins often do not provide the large amounts of sample
required by protein biochemistry techniques, restricting
the investigation to a very limited, sometimes not
reproducible, set of information. In this respect, the
Thermofluor
Ò
technique [1] (Fig. 1A) is an example of
how it is possible to minimise the amounts of protein
and time used for analysis of various parameters such
as ligand stabilisation, pH effects, and storage condi-
tions [2–4]. Thermofluor
Ò
determines the unfolding
temperature of a protein through evaluation of the
fluorescence of a solvatochromic dye such as 1-anilino-
8-naphthalenesulfonate [5] or SYPRO Orange [6],
which have a low fluorescence quantum yield in water
and a high quantum yield when bound to the hydro-
phobic surface of denatured proteins (Fig. 1A). Over
recent years, several reports have described successful
use of the Thermofluor
Ò
technique for identification of
the stabilising conditions of biochemically uncharacter-
ised proteins [5–8], library screening of potential
ligands for selected drug targets [9–11], or simple
investigations of the behaviour of proteins under vari-
ous conditions [12,13]. Although dedicated instruments
are commercially available for Thermofluor
Ò
analysis
[1], the experiment can be performed without any tech-
nical adaptation, using even the cheapest available
Keywords
flavin; fluorescence screening; ligand
screening; protein stability; Thermofluor
Ò
Correspondence
F. Forneris and A. Mattevi, Dipartimento di
Genetica e Microbiologia, Universita
`
di
Pavia, Via Ferrata 1, 27100 Pavia, Italy
Fax: +39 0382 528496
Tel: +39 0382 985534
E-mail: ;
Website: />(Received 14 January 2009, revised 3 March
2009, accepted 16 March 2009)
doi:10.1111/j.1742-4658.2009.07006.x
In living organisms, genes encoding proteins that contain flavins as a pros-
thetic group constitute approximately 2–3% of the total. The fluorescence
of flavin cofactors in these proteins is a property that is widely employed
for biochemical characterisation. Here, we present a modified Thermofluor
Ò
approach called ThermoFAD (Thermofluor
Ò
-adapted flavin ad hoc detec-
tion system), which simplifies identification of optimal purification and
storage conditions as well as high-affinity ligands. In this technique, the fla-
vin cofactor is used as an intrinsic probe to monitor protein folding and
stability, taking advantage of the different fluorescent properties of flavin-
containing proteins between the folded and denatured state. The main
advantage of the method is that it allows a large amount of biochemical
data to be obtained using very small amounts of protein sample and stan-
dard laboratory equipment. We have explored several cases that demon-
strate the reliability and versatility of this technique when applied to
globular flavoenzymes, membrane-anchored flavoproteins, and macro-
molecular complexes. The information gathered from ThermoFAD analysis
can be very valuable for any biochemical and biophysical analysis, includ-
ing crystallisation. The method is likely to be applicable to other classes of
proteins that possess endogenous fluorescent cofactors and prosthetic
groups.
Abbreviations
LSD1, lysine-specific histone demethylase 1; MAO, monoamine oxidase; ThermoFAD, Thermofluor
Ò
-adapted flavin ad hoc detection system;
FMO, flavin-dependent monooxygenase.
FEBS Journal 276 (2009) 2833–2840 ª 2009 The Authors Journal compilation ª 2009 FEBS 2833
real-time PCR apparatus [13,14]. The fluorescence
signal is increased when the dye partitions into the
hydrophobic patches of proteins that become solvent-
exposed during the denaturation process. The presence
of compounds interacting with the protein molecules
at various levels, from solvation to covalent binding,
alters the unfolding behaviour of the protein under
analysis, and a shift in the unfolding temperature can
be directly associated with a stabilisation or a destabil-
isation effect [4,11]. However, use of dyes that bind
hydrophobic surfaces, such as SYPRO Orange, suffers
from the limitation that the detergents used to solubi-
lize membrane proteins interfere with the analysis, cre-
ating a hydrophobic environment due to micelle
formation. This dye-detergent interaction does not
allow correct measurement of the unfolding tempera-
ture of the sample, limiting the analysis to water-solu-
ble proteins. For the same reason, Thermofluor
Ò
cannot be applied successfully to many proteins that
expose hydrophobic patches to the solvent (e.g. pro-
teins that interact in macromolecular complexes),
because the dyes produce a fluorescence signal due to
binding to these regions, masking the signal associated
with protein unfolding.
In both prokaryotic and eukaryotic organisms, genes
encoding proteins that contain flavins as prosthetic
group are estimated to constitute approximately 2–3%
of the total. Enzymes that employ flavins for catalysis
are involved in a multitude of processes, from drug
metabolism to gene regulation [15]. Because of their
spectroscopic features, flavoproteins form one of the
most studied protein classes. In particular, the fluores-
cence of the flavin is an intrinsic property that is
widely used for biochemical characterisation of flavo-
proteins. By comparing the emission and excitation
ranges of the dyes typically used in Thermofluor
Ò
experiments, we noticed that flavins have fluorescence
properties that fall in the same wavelength range. The
conventional excitation wavelength used in RT-PCR
instruments is 450–530 nm, whereas flavins show fluo-
rescence excitation maxima at 373–375 and 445–
450 nm (Fig. 1B,C) [16]. This broad shape of the flavin
excitation spectrum makes the RT-PCR excitation
wavelengths suitable for generating sufficient fluores-
cence intensity for detection. With regard to fluores-
cence emission, the highest intensity for flavins is at
535 nm [16]. Depending on the instrumental setup,
RT-PCR instruments have various optical ranges for
fluorescence detection, from fixed intervals to a com-
pletely customizable detection range [17]. However, we
found that most RT-PCR systems, even the cheapest
ones available on the market, can generally be used to
excite flavins and measure their fluorescence signal
without any specific adaptation. As the fluorescence of
flavin cofactors in flavoproteins is usually quenched by
the protein environment when the protein is properly
folded [16], we realised that is possible to measure the
unfolding temperature of a flavoprotein using Thermo-
fluor
Ò
by monitoring the increase in cofactor fluores-
cence (Fig. 1B). This approach allows fast and reliable
A
B
C
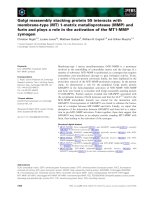
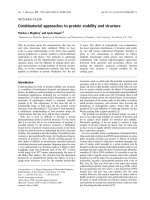
Fig. 1. (A) Schematic representation of the Thermofluor
Ò
binding
assay. A solvatochromic dye (i.e. SYPRO Orange) is used as an
indicator of protein unfolding. Binding of the dye to the unfolded
protein results in a significant increase in its intrinsic fluorescence.
(B) Schematic representation of ThermoFAD. In this case, the
increase in fluorescence is generated by exposure of the flavin
cofactor to the solvent upon protein unfolding. (C) Overview of fluo-
rescence properties of flavins and comparison with RT-PCR instru-
mental parameters. Dashed line, flavin excitation spectrum;
continuous line, flavin emission spectrum; red, wavelength range
for RT-PCR fluorescence excitation; green, SYBR Green detection
range; orange, SYPRO Orange detection range. Flavin fluorescence
emission can be measured using the SYBR Green fluorescence
filter on the RT-PCR instrument without any adaptation.
A Thermofluor
Ò
-adapted flavin ad hoc detection system F. Forneris et al.
2834 FEBS Journal 276 (2009) 2833–2840 ª 2009 The Authors Journal compilation ª 2009 FEBS
evaluation of many protein parameters using extremely
low amounts of sample. Moreover, it is more versatile
than conventional Thermofluor
Ò
because, by using
intrinsic fluorescence instead of that of an external
dye, it is not influenced by the noise generated by
hydrophobic compounds present in solution or hydro-
phobic patches that may interact with the dyes used in
Thermofluor
Ò
. We named this modified Thermofluor
Ò
approach ‘ThermoFAD’ (Thermofluor
Ò
-adapted flavin
ad hoc detection system).
Results
The ThermoFAD technique
A ThermoFAD analysis requires only 20 lL of protein
sample, in a concentration range from 0.3 to
4.0 mgÆmL
)1
, and an RT-PCR instrument. The whole
experiment takes < 2 h and allows evaluation of
1–384 samples at the same time (depending on the
set-up of the PCR instrument). In a typical experi-
ment, 1–2 lL of a concentrated sample are added
together with the buffers and ligands for analysis
directly into the wells of the RT-PCR instrument.
Next, a temperature gradient is applied, starting from
15–20 °C and increasing to 90 °C, measuring the
fluorescence signal every 0.5 min. As in a standard
RT-PCR Thermofluor
Ò
experiment, a sigmoidal curve
(thermogram) is obtained by plotting the fluorescence
intensity against the temperature. The unfolding tem-
perature is then determined as the maximum of the
derivative of this sigmoidal curve (Figs 2 and 3) [1]. By
comparing various thermograms for the same protein
under various conditions, it is possible to evaluate
which compounds stabilise (or destabilise) the sample
under analysis and to screen many conditions with a
minimum consumption of protein [5].
In order to validate our ThermoFAD technique, we
have chosen a set of flavoproteins with various features
in terms of biological activity, size, and type of interac-
tion (covalent and non-covalent) with the flavin cofac-
tor (Table 1). As an indication of the efficiency and
sensitivity of our approach, we compared the results
obtained with ThermoFAD with conventional Thermo-
fluor
Ò
measurements obtained using SYPRO Orange as
the fluorescent probe for denaturation (Fig. 2). The
results are in perfect agreement for the whole set of
flavoproteins under analysis (Table 1). The sensitivity
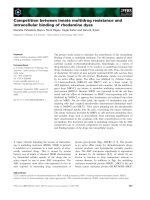
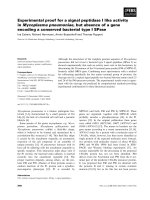
Fig. 2. Comparison between Thermofluor
Ò
and ThermoFAD for various flavoproteins. The selected flavoproteins differ with respect to the
type of flavin cofactor, flavin linkage to the protein, and source organism of the protein (for details see Table 1). Thermal stability curves are
plotted against normalised fluorescence signal. Green lines, Thermofluor
Ò
experiments using SYPRO Orange as fluorescent dye; red lines,
ThermoFAD experiments measured without addition of any dye. The detector filter of the RT-PCR instrument for ThermoFAD is the one that
is commonly used for SYBR Green dye (fluorescence emission of 523–543 nm; see Fig. 1C).
F. Forneris et al. A Thermofluor
Ò
-adapted flavin ad hoc detection system
FEBS Journal 276 (2009) 2833–2840 ª 2009 The Authors Journal compilation ª 2009 FEBS 2835
and specificity of ThermoFAD make the technique
extremely versatile, in that it allows evaluation of the
stability of a flavoprotein even in partially purified sam-
ples (data not shown), which is impossible to detect
using dyes that bind nonspecifically to all the hydro-
phobic patches present in solution. Here, we report on
the application of the modified Thermofluor
Ò
approach
to a few of our investigated flavoproteins (Table 1 and
Fig. 2) with the intention of demonstrating the advan-
tages offered by the ThermoFAD technique.
Comparison of the stability of a soluble and
globular flavoenzyme (FMO) in the presence of
various ligands
We tested a number of conditions for optimal stabili-
sation of a flavin-containing monooxygenase (FMO)
from Methilophaga sp. strain SK1. FMOs are
involved in the metabolism of several drugs, cataly-
sing the oxygenation of many nitrogen-, sulphur-,
phosphorus- and selenium-containing nucleophilic
compounds using molecular oxygen and NADPH as
substrates [18]. Using ThermoFAD, we compared the
stability of FMO in various buffers and evaluated the
effect of addition of NADP(H) analogues on protein
stability. Our buffer screening led to identification of
optimal stabilisation conditions for FMO that corre-
spond to the buffer that was successfully used for
crystallisation of this flavoprotein [18] (Fig. 3A).
Moreover, the ThermoFAD analysis allowed us to
identify NADP analogues with higher affinity to
FMO compared to NADP:3-acetylpiridine ADP, thio-
NADP and nicotinic acid ADP. These compounds
were then tested as FMO crystallisation additives,
leading to high-quality crystals, with a significant
increase in the diffraction quality and resolution of
the data (F. Forneris and A. Mattevi, unpublished
results).
ThermoFAD on a membrane-anchored
flavoenzyme in the presence of detergents
When working with membrane proteins, it is necessary
to use detergents after membrane extraction through-
out the purification and characterisation process. The
choice of detergent is the most critical parameter in
obtaining a stable and active protein suitable for
biochemical and structural characterisation. For this
reason, effective detergent screening methods are
required (see [19] for a recent development in this area).
Thermofluor
Ò
is an excellent candidate for this type of
analysis, but suffers from the limitation that the fluo-
rescent dyes used to determine the protein unfolding
temperature interact with the detergent lipophilic
moiety. This limitation makes the analysis difficult, if
not impossible [20]. However, ThermoFAD allowed
unfolding temperature analysis of a membrane-
anchored flavoprotein to be performed in the presence
of detergents, because the flavin cofactor fluorescence is
not influenced by these amphipathic molecules. As a
test case, we used human monoamine oxidase B, a
membrane-bound flavoenzyme that catalyses the oxida-
tion of arylalkylamine neurotransmitters and bears a
FAD cofactor covalently attached to a cysteine residue
[21]. We performed both Thermofluor
Ò
(using SYPRO
Orange as a dye) and ThermoFAD experiments on the
same sample in order to compare the two techniques.
The Thermofluor
Ò
experiment did not produce a
sigmoidal curve, most likely because of interaction of
SYPRO Orange with the detergent and ⁄ or the hydro-
phobic membrane-binding region of the enzyme. On
the other hand, ThermoFAD produced a clear result
Table 1. Comparison of unfolding temperature using Thermofluor
Ò
and ThermoFAD for various flavoproteins. ND, not determined.
Protein Organism Bound flavin Reference
Protein
concentration
(mgÆmL
)1
)
T
m
(°C)
Thermofluor
â
ThermoFAD
Lysine-specific demethylase
+ CoREST complex
Mammal (Homo sapiens) Non-covalent FAD [23] 1.0 48.1 48.4
Polyamine oxidase Plant (Zea mays) Non-covalent FAD [25] 0.6 50.0 50.2
L-Galactono-c-lactone dehydrogenase Plant (Arabidopsis thaliana) Non-covalent FAD [26] 1.3 58.2 58.6
Flavin-dependent
monooxygenase
Bacterial (Methylophaga sp.) Non-covalent FAD [18] 2.0 43.0 43.3
Monoamine oxidase B Mammal (Homo sapiens) Covalent (Cys) FAD [27] 1.0 ND 51.2
Alditol oxidase Bacterial [Streptomyces
coelicolor A3(2)]
Covalent (His) FAD [28] 1.5 49.7 49.4
Cytokinin dehydrogenase Plant (Zea mays) Covalent (His) FAD [29] 1.0 59.9 60.3
Vanillyl-alcohol oxidase Fungus; (Penicillium
simplicissimum)
Covalent (His) FAD [30] 1.1 58.0 57.7
A Thermofluor
Ò
-adapted flavin ad hoc detection system F. Forneris et al.
2836 FEBS Journal 276 (2009) 2833–2840 ª 2009 The Authors Journal compilation ª 2009 FEBS
with a nice sigmoidal curve indicating an unfolding
temperature of 51.2 °C (Fig. 2). The significance of this
result was further verified by circular dichroism spec-
tropolarimetry. By means of this technique, we mea-
sured a value for the unfolding temperature (57 °C)
that is slightly higher than that measured by Thermo-
FAD, probably reflecting the inherent differences
between the two methodologies. ThermoFAD senses
the exposure of flavin to water, which is likely to be an
earlier event in the denaturation process than the loss
of secondary structures, as probed by circular dichro-
ism. Our study of human monoamine oxidase B shows
that ThermoFAD can be efficiently used in the case of
flavoproteins that require detergents for stabilisation or
that contain hydrophobic patches on their surface.
Evaluation of in vitro reconstitution of a protein
complex using ThermoFAD
A more complicated case is an investigation conducted
on the human flavin-dependent histone demethylase
LSD1. This flavoenzyme catalyses removal of a methyl
group from a protein substrate (histone H3) with a
highly specific substrate specificity (Lys4). LSD1 is a
partially non-globular, multidomain protein that is
known to interact with a co-repressor protein named
corepressor of the neural receptor REST (CoREST).
LSD1 and CoREST assemble to generate a hetero-
dimeric sub-complex that is part of several nuclear
multiprotein complexes [22]. Using ThermoFAD, we
were able to measure the stabilising effect induced by
association of CoREST with purified LSD1 (Fig. 3B).
Binding of CoREST to LSD1 shifts the unfolding tem-
perature by 4 °C, consistent with a tight association
between the two proteins. Thus, the experiment allowed
us to quickly establish using a very limited amount of
protein that the complex could be reconstituted in vitro.
Moreover, we confirmed that various histone H3 pep-
tides bind tightly to LSD1, in perfect agreement with
biochemical enzymatic assays [23]. Importantly, the
increases in protein stability are proportional to the
inhibitory power of the analysed peptides (Fig. 3C).
Especially interesting is the finding that the histone H3
peptide with the Lys4Met mutation has the highest
stabilising effect. This peptide is a tight nanomolar
inhibitor, which was successfully used for crystal
structure determination of the LSD1 ⁄ CoREST ⁄ histone
peptide ternary complex [24].
Discussion
Our method shows that it is possible to exploit the
intrinsic fluorescence of flavin cofactor to determine the
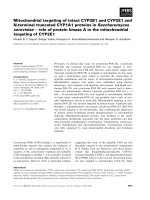
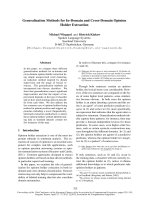
A
B
C
Fig. 3. (A) Evaluation of FMO stability using ThermoFAD against var-
ious buffers at various pH values. (B) ThermoFAD comparison of
LSD1 stability with (red) and without (green) addition of the protein
CoREST. The T
m
shift corresponds to formation of a heterodimeric
complex between the two proteins. The Thermofluor
Ò
profile of iso-
lated CoREST is shown in blue; in this case it is not possible to calcu-
late a T
m
value because of the many exposed hydrophobic patches
of CoREST that bind to the dye before complete unfolding of the pro-
tein. (C) ThermoFAD profiling of LSD1 ⁄ CoREST stability towards
known inhibitor peptides. All data are in good agreement with the
biochemical analysis [23]. In particular, the Lys4Met (K4M) peptide
shows the highest stabilising effect, in agreement with the fact that
it is the peptide that allowed us to solve the crystal structure of the
LSD1 ⁄ CoREST complex with a bound peptide substrate analogue.
F. Forneris et al. A Thermofluor
Ò
-adapted flavin ad hoc detection system
FEBS Journal 276 (2009) 2833–2840 ª 2009 The Authors Journal compilation ª 2009 FEBS 2837
unfolding temperature of flavoproteins, instead of using
the fluorescent dyes commonly used in Thermofluor
Ò
experiments. This approach simplifies the screening and
identification of optimal conditions for protein stability,
storage and ligand binding. In addition, this technique
does not require any customised procedure or specific
chemical compound, and can also be used in the pres-
ence of compounds that are known to interfere signifi-
cantly with the dyes used in the conventional
Thermofluor
Ò
approach, such as detergents or contami-
nants. We have provided some examples of the versatil-
ity of this technique, which can be used with proteins
with covalently and noncovalently bound flavin cofac-
tors to identify stabilising agents, high-affinity ligands,
protein complex formation, and other factors that can
affect protein stability. This information is obviously
very valuable for any biochemical and biophysical
analysis, including crystallisation. In all cases, the exper-
iments were performed in just a few hours using
standard laboratory equipment with minimal sample
consumption. As flavoproteins are among the most
widely studied protein classes because of their abun-
dance, variety and biological importance, we believe
that this fast, cheap and reliable method will be of
great help for the many groups that study new and
uncharacterised flavoproteins. Moreover, it is likely to
be applicable to other classes of proteins that possess
endogenous fluorescent cofactors and prosthetic groups.
Experimental procedures
Protein samples
All flavoproteins used for our analysis were expressed and
purified as described in the original papers reporting their
biochemical and structural characterisation (Table 1). Their
purity was checked by SDS–PAGE analysis, and protein
concentration was evaluated by measuring the UV ⁄ vis
absorbance of the bound flavin cofactor using published
extinction coefficients.
ThermoFAD experimental setup
Experiments were performed using a MiniOpticon real-time
PCR detection system, using 48-well RT-PCR plates (Bio-
Rad Laboratories, Hercules, CA, USA). Measurements were
performed using an excitation wavelength range between 470
and 500 nm and a SYBR Green fluorescence emission filter
(523–543 nm), which falls within the same fluorescence range
as the isoalloxazine ring of FAD or flavin mononucleotide
(470–570 nm) (Fig. 1C). The flavoprotein concentration
required for optimal signal-to-noise ratio was initially evalu-
ated using LSD1 as a benchmark. Unfolding curves were
generated using a temperature gradient from 20 to 90 °C,
performing a fluorescence measurement after every 0.5 °C
increase after a 10-s delay for signal stabilisation. All experi-
ments were performed at least three times, and the reported
T
m
values are based on the mean values determined from the
peaks of the derivatives of the experimental data. In a typical
experiment, 1–2 lL of a concentrated protein were mixed
together with the ligands for analysis directly into the wells
of the RT-PCR instrument and diluted with reaction buffer
(50 mm KPi, pH 7.5) to a final volume of 20 lL. The best
concentrations for ThermoFAD analysis were between
0.5 and 4 mgÆmL
)1
, and all subsequent experiments were
carried out using protein concentrations in this range.
Evaluation of the reliability of Thermo FAD versus
Thermofluor
â
for various flavoproteins
To compare the results of the ThermoFAD analysis with
conventional Thermofluor
Ò
, we performed experiments in
parallel with the same amounts of flavoproteins, with and
without the addition of 3 lL of 5000· SYPRO Orange
(Sigma-Aldrich, St Louis, MO, USA). The experimental
setup, gradients and methods were identical in the Thermo-
FAD and Thermofluor
Ò
analyses. Detection was performed
using the SYPRO Orange and SYBR Green fluorescence
filters for both techniques to evaluate the interference possi-
bly caused by superposition of the flavin fluorescence on
that of the SYPRO Orange. No interference was detected
(data not shown).
Determination of stabilisation conditions for FMO
FMO was concentrated using an Amicon concentrator
(Millipore Corp., Billerica, MA, USA) with a 30 kDa
cutoff to a final concentration of 20 mgÆmL
)1
. A set of 15
buffers at 50 mm concentration in the pH range 4.2–10.6
was prepared in RT-PCR plates, and 2 lL of flavoenzyme
were added to each well (final protein concentration of
2.0 mgÆmL
)1
). Buffers that showed a significant stabilisa-
tion effect are reported in Fig. 3A.
Determination of the unfolding temperature of
human monoamine oxidase B
Human monoamine oxidase B, stored at 3 mgÆmL
)1
in
50 mm KPi pH 7.0 supplemented with 0.8% w ⁄ v octyl-
glucoside, was diluted in the same buffer to a final concen-
tration of 1 mgÆmL
)1
and used for thermal unfolding
assays. The unfolding temperature was also measured by
circular dichroism spectropolarimetry. For this purpose, we
used a Jasco J-710 spectropolarimeter (Jasco Europe, Cre-
mella, Italy) equipped with a Neslab RT-11 programmable
water bath (Thermo Fisher Scientific, Waltham, MA, USA)
and a 1 mm path-length cuvette. Thermal denaturation was
A Thermofluor
Ò
-adapted flavin ad hoc detection system F. Forneris et al.
2838 FEBS Journal 276 (2009) 2833–2840 ª 2009 The Authors Journal compilation ª 2009 FEBS
followed by continuous measurements of ellipticity at
222 nm in the temperature range 25–70 °C with a constant
heating rate of 1 °CÆmin
)1
.
LSD1
⁄
CoREST reconstitution and inhibition
assays
Human LSD1, 8 mgÆmL
)1
in 50 mm KPi buffer supple-
mented with 5% v ⁄ v glycerol pH 7.2, was diluted with the
same buffer to a final concentration of 1 mgÆmL
)1
. Experi-
ments were performed using the LSD1 alone or supplied
with human CoREST in stoichometric amounts to deter-
mine the T
m
increase associated with formation of the hete-
rodimeric protein complex. For inhibition assays, a
tandem-affinity purified LSD1 ⁄ CoREST complex [24] was
used instead of LSD1 alone for better comparison with pre-
viously published biochemical data [23]. The complex was
used at a final concentration of 1 mgÆmL
)1
, and 3 lLof
2mm histone peptide inhibitors were added to each well.
Copyright notice
The Thermofluor
Ò
assay was developed by 3-Dimen-
sional Pharmaceuticals Inc., which is now part of
Johnson & Johnson Pharmaceutical Research & Devel-
opment (Raritan, NJ, USA). ‘Thermofluor
Ò
’ is a trade-
mark registered in the USA and certain other
countries.
Acknowledgements
Financial support from the Italian Ministry of Science
(PRIN06 and FIRB programmes), the Fondazione
Cariplo, the Italian Association for Cancer Research,
and the American Chemical Society Petroleum
Research Fund (46271-C4) is gratefully acknowledged.
We thank Drs Dale E. Edmondson (Emory University,
Atlanta, GA, USA), Claudia Binda (University of
Pavia, Italy), Willem J. van Berkel (University of
Wageningen, the Netherlands) and Marco W. Fraaije
(University of Groningen, the Netherlands) for provid-
ing us with protein material and helpful advice.
References
1 Pantoliano MW, Petrella EC, Kwasnoski JD, Lobanov
VS, Myslik J, Graf E, Carver T, Asel E, Springer BA,
Lane P et al. (2001) High-density miniaturized thermal
shift assays as a general strategy for drug discovery.
J Biomol Screen 6, 429–440.
2 Cummings MD, Farnum MA & Nelen MI (2006)
Universal screening methods and applications of
ThermoFluor. J Biomol Screen 11 , 854–863.
3 Kervinen J, Ma H, Bayoumy S, Schubert C, Milligan
C, Lewandowski F, Moriarty K, Desjarlais RL, Rama-
chandren K, Wang H et al. (2006) Effect of construct
design on MAPKAP kinase-2 activity, thermodynamic
stability and ligand-binding affinity. Arch Biochem
Biophys 449, 47–56.
4 Klinger AL, McComsey DF, Smith-Swintosky V,
Shank RP & Maryanoff BE (2006) Inhibition of car-
bonic anhydrase-II by sulfamate and sulfamide groups:
an investigation involving direct thermodynamic bind-
ing measurements. J Med Chem 49, 3496–3500.
5 Mezzasalma TM, Kranz JK, Chan W, Struble GT,
Schalk-Hihi C, Deckman IC, Springer BA & Todd MJ
(2007) Enhancing recombinant protein quality and yield
by protein stability profiling. J Biomol Screen 12, 418–
428.
6 Geerlof A, Brown J, Coutard B, Egloff MP, Enguita
FJ, Fogg MJ, Gilbert RJ, Groves MR, Haouz A,
Nettleship JE et al. (2006) The impact of protein char-
acterization in structural proteomics. Acta Crystallogr
D Biol Crystallogr 62, 1125–1136.
7 Ericsson UB, Hallberg BM, Detitta GT, Dekker N &
Nordlund P (2006) Thermofluor-based high-throughput
stability optimization of proteins for structural studies.
Anal Biochem 357, 289–298.
8 Carver TE, Bordeau B, Cummings MD, Petrella EC,
Pucci MJ, Zawadzke LE, Dougherty BA, Tredup JA,
Bryson JW, Yanchunas J Jr et al. (2005) Decrypting the
biochemical function of an essential gene from Strepto-
coccus pneumoniae using ThermoFluor technology.
J Biol Chem 280, 11704–11712.
9 Parks DJ, Lafrance LV, Calvo RR, Milkiewicz KL,
Gupta V, Lattanze J, Ramachandren K, Carver TE,
Petrella EC, Cummings MD et al. (2005) 1,4-Benzodiaz-
epine-2,5-diones as small molecule antagonists of the
HDM2–p53 interaction: discovery and SAR. Bioorg
Med Chem Lett 15, 765–770.
10 Abad MC, Askari H, O’Neill J, Klinger AL, Milligan C,
Lewandowski F, Springer B, Spurlino J & Rentzeperis D
(2008) Structural determination of estrogen-related
receptor gamma in the presence of phenol derivative
compounds. J Steroid Biochem Mol Biol 108, 44–54.
11 Matulis D, Kranz JK, Salemme FR & Todd MJ (2005)
Thermodynamic stability of carbonic anhydrase: mea-
surements of binding affinity and stoichiometry using
ThermoFluor. Biochemistry 44, 5258–5266.
12 Siebold C, Berrow N, Walter TS, Harlos K, Owens RJ,
Stuart DI, Terman JR, Kolodkin AL, Pasterkamp RJ
& Jones EY (2005) High-resolution structure of the
catalytic region of MICAL (molecule interacting with
CasL), a multidomain flavoenzyme-signaling molecule.
Proc Natl Acad Sci USA 102, 16836–16841.
13 Nettleship JE, Brown J, Groves MR & Geerlof A
(2008) Methods for protein characterization by mass
F. Forneris et al. A Thermofluor
Ò
-adapted flavin ad hoc detection system
FEBS Journal 276 (2009) 2833–2840 ª 2009 The Authors Journal compilation ª 2009 FEBS 2839
spectrometry, thermal shift (ThermoFluor) assay, and
multiangle or static light scattering. Methods Mol Biol
426, 299–318.
14 Lo MC, Aulabaugh A, Jin G, Cowling R, Bard J,
Malamas M & Ellestad G (2004) Evaluation of fluores-
cence-based thermal shift assays for hit identification
in drug discovery. Anal Biochem 332, 153–159.
15 Frago S, Gomez-Moreno C & Medina M (2008) Flavins
and Flavoproteins 2008. Prensas Universitarias de
Zaragoza, Spain.
16 Munro AW & Noble MA (1999) Fluorescence analysis
of flavoproteins. Methods Mol Biol 131, 25–48.
17 Kubista M, Andrade JM, Bengtsson M, Forootan A,
Jona
´
k J, Lind K, Sindelka R, Sjo
¨
back R, Sjo
¨
green B,
Stro
¨
mbom L et al. (2006) The real-time polymerase
chain reaction. Mol Aspects Med 27, 95–125.
18 Alfieri A, Malito E, Orru R, Fraaije MW & Mattevi A
(2008) Revealing the moonlighting role of NADP in the
structure of a flavin-containing monooxygenase. Proc
Natl Acad Sci USA 105, 6572–6577.
19 Alexandrov AI, Mileni M, Chien EY, Hanson MA &
Stevens RC (2008) Microscale fluorescent thermal
stability assay for membrane proteins. Structure 16,
351–359.
20 Kean J, Cleverley RM, O’Ryan L, Ford RC, Prince SM
& Derrick JP (2008) Characterization of a CorA Mg
2+
transport channel from Methanococcus jannaschii using
a Thermofluor-based stability assay. Mol Membr Biol
25, 653–663.
21 Edmondson DE, Binda C & Mattevi A (2007) Struc-
tural insights into the mechanism of amine oxidation by
monoamine oxidases A and B. Arch Biochem Biophys
464, 269–276.
22 Forneris F, Binda C, Battaglioli E & Mattevi A (2008)
LSD1: oxidative chemistry for multifaceted functions
in chromatin regulation. Trends Biochem Sci 33, 181–
189.
23 Forneris F, Binda C, Vanoni MA, Battaglioli E &
Mattevi A (2005) Human histone demethylase LSD1
reads the histone code. J Biol Chem 280, 41360–
41365.
24 Forneris F, Binda C, Adamo A, Battaglioli E &
Mattevi A (2007) Structural basis of LSD1-CoREST
selectivity in histone H3 recognition. J Biol Chem 282,
20070–20074.
25 Binda C, Coda A, Angelini R, Federico R, Ascenzi P &
Mattevi A (1999) A 30-angstrom-long U-shaped
catalytic tunnel in the crystal structure of polyamine
oxidase. Structure 7, 265–276.
26 Leferink NG, van den Berg WA & van Berkel WJ
(2008) l-Galactono-gamma-lactone dehydrogenase from
Arabidopsis thaliana, a flavoprotein involved in vitamin
C biosynthesis. FEBS J 275, 713–726.
27 Binda C, Newton-Vinson P, Huba
´
lek F, Edmondson
DE & Mattevi A (2002) Structure of human mono-
amine oxidase B, a drug target for the treatment of
neurological disorders. Nat Struct Biol 9, 22–26.
28 Heuts DP, van Hellemond EW, Janssen DB & Fraaije
MW (2007) Discovery, characterization, and kinetic
analysis of an alditol oxidase from Streptomyces coeli-
color. J Biol Chem 282, 20283–20291.
29 Malito E, Coda A, Bilyeu KD, Fraaije MW & Mattevi
A (2004) Structures of Michaelis and product complexes
of plant cytokinin dehydrogenase: implications for
flavoenzyme catalysis. J Mol Biol 341, 1237–1249.
30 Mattevi A, Fraaije MW, Mozzarelli A, Olivi L, Coda A
& van Berkel WJ (1997) Crystal structures and inhibitor
binding in the octameric flavoenzyme vanillyl-alcohol
oxidase: the shape of the active-site cavity controls
substrate specificity. Structure 5, 907–920.
A Thermofluor
Ò
-adapted flavin ad hoc detection system F. Forneris et al.
2840 FEBS Journal 276 (2009) 2833–2840 ª 2009 The Authors Journal compilation ª 2009 FEBS