Báo cáo khoa học: The pivotal regulator GlnB of Escherichia coli is engaged in subtle and context-dependent control potx
Bạn đang xem bản rút gọn của tài liệu. Xem và tải ngay bản đầy đủ của tài liệu tại đây (462.55 KB, 17 trang )
The pivotal regulator GlnB of Escherichia coli is engaged
in subtle and context-dependent control
Wally C. van Heeswijk
1
, Douwe Molenaar
1
, Sjouke Hoving
1,
* and Hans V. Westerhoff
1,2
1 Department of Molecular Cell Physiology, Faculty of Earth and Life Sciences, Vrije Universiteit, Amsterdam, The Netherlands
2 Manchester Centre for Integrative Systems Biology, University of Manchester, UK
Because the environment changes frequently for many
unicellular organisms, subtle regulation may be impor-
tant for relative fitness. Appropriate adaptation
requires a precise response to an accurate assessment
of environmental changes. In some systems, the signal
is transduced by the reversible covalent modification of
a protein cascade, without transferring a chemical
group down the chain. The functional activity of the
protein at the bottom of the hierarchy depends on the
modification state of that protein. The advantage of
modulating the activity of a protein by a cascade-type
of regulation rather than by allosteric interaction
remains unclear. Based on theoretical analysis, it has
been argued that regulatory cascades might serve the
function of high signal amplification [1–9]. Here, we
suggest that the opposite may be the case: they may
serve the function of subtlety of regulation.
In stark contrast to the number of theoretical sug-
gestions, little is known experimentally about the
extent to which the various proteins participating in a
Keywords
glutamine synthetase; metabolic control
analysis; P
II;
signal transduction cascades;
ultrasensitivity
Correspondence
W. C. van Heeswijk, Faculty of Earth and
Life Sciences, Department of Molecular Cell
Physiology, Vrije Universiteit, De Boelelaan
1085, NL
-1081 HV Amsterdam,
The Netherlands
Fax: +31 20 598 7229
Tel: +31 20 598 7228
E-mail:
Website: />mcp/main/index.html
*Present address
Novartis Institutes of Biomedical Research,
Basel, Switzerland
(Received 5 February 2009, revised 3 April
2009, accepted 8 April 2009)
doi:10.1111/j.1742-4658.2009.07058.x
This study tests the purported signal amplification capability of the gluta-
mine synthetase (GS) regulatory cascade in Escherichia coli. Intracellular
concentrations of the pivotal regulatory protein GlnB were modulated by
varying expression of its gene (glnB). Neither glnB expression nor P
II
* (i.e.
the sum of the concentration of the P
II
-like proteins GlnB and GlnK) had
control over the steady-state adenylylation level of GS when cells were
grown in the presence of ammonia, in which glnK is not activated. Follow-
ing the removal of ammonia, the response coefficient of the transient
deadenylylation rate of GS–AMP was again zero with respect to both glnB
expression and P
II
* concentration. This was at wild-type P
II
* levels. A 20%
decrease in the P
II
* level resulted in the response coefficients increasing to 1,
which was quite significant yet far from expected for zero-order ultrasensi-
tivity. The transient deadenylylation rate of GS–AMP after brief incubation
with ammonia was also measured in cells grown in the absence of ammonia.
Here, GlnK was present and both glnB expression and P
II
* lacked control
throughout. Because at wild-type levels of P
II
*, the molar ratio of P
II
*-tri-
mer ⁄ adenylyltransferase-monomer was only slightly above 1, it is suggested
that the absence of control by P
II
* is caused by saturation of adenylyltrans-
ferase by P
II
*. The difference in the control of deadenylylation by P
II
*
under the two different growth conditions indicates that control of signal
transduction is adjusted to the growth conditions of the cell. Adjustment of
regulation rather than ultrasensitivity may be the function of signal trans-
duction chains such as the GS cascade. We discuss how the subtle interplay
between GlnB, its homologue GlnK and the adenylyltransferase may be
responsible for the ‘redundant’, but quantitative, phenotype of GlnB.
Abbreviations
ATase, adenylyltransferase; GS, glutamine synthetase; IPTG, isopropyl b-
D-1-thiogalactoside; MCA, metabolic control analysis; UTase,
uridylyltransferase.
3324 FEBS Journal 276 (2009) 3324–3340 ª 2009 The Authors Journal compilation ª 2009 FEBS
regulatory cascade control signal transduction in vivo.
Statements like ‘this protein is or is not involved’
do not suffice if subtlety of regulation is the issue. The
relative extents to which the various proteins control
signal transduction in the physiological state needs to
be addressed. Does a (small) change in the activity of
one of these proteins affect the strength of the
response to the signal and does such a change interfere
with the rate of signal transfer through the chain?
Because phenotypes may be quantitative and subtle,
analysis of knockout strains may not suffice. To
address these questions a method is needed to quantify
the magnitude of the control exercised by a protein on
a physiological function, as well as the extent to which
that magnitude changes with the conditions.
Such methods have been developed for the control
by enzymes of the fluxes through metabolic pathways.
One of these is known as metabolic control analysis
(MCA) [10–12]. In this method, the activity of the rele-
vant enzyme (e
i
) is modulated by inhibitor titration
[13] or gene-expression titration [14,15] and the relative
effect on the physiological property of interest, e.g.
flux (J) through the pathway, is measured to give the
flux–control coefficient (C
J
ei
) (i.e. the intrinsic control
of the modulated enzyme on the flux). The activity of
some enzymes can be modulated by the binding of an
allosteric effector, e.g. a regulatory protein (A). If one
modulates the concentration of the latter, then the
relative effect on the physiological property of interest,
e.g. flux through the pathway (J), divided by the rela-
tive (small) modulation of the effector concentration
gives the flux–response coefficient (R
J
A
), whereas the
effect of A on the local rate (v
ei
) of enzyme e
i
is quan-
tified by an elasticity coefficient (e
m
ei
A
) [10]. The
response, control and elasticity coefficients relate to
each other through R
J
A
¼ C
J
ei
Á e
m
ei
A
[10]. In signal trans-
duction cascades, the steady-state response of a steady
fraction of a modified enzyme to an effector molecule
may be called signal amplification if the corresponding
response coefficient is > 1 [16].
Here, we use the MCA approach both conceptually
and experimentally to address the question of how
intensely a regulatory protein controls signal transduc-
tion. Because the glutamine synthetase (GS) adenylyla-
tion cascade has been studied extensively at the
genetic and molecular (e.g. kinetic) levels [17,18], we
used this cascade as the experimental model system;
GS catalyses the incorporation of ammonia into gluta-
mate to form glutamine [19]. Glutamine is a precursor
at a branch point for several biosynthetic pathways
[20]. GS is a homo-dodecameric protein [21]. This key
enzyme in nitrogen anabolism is regulated at three
levels: allosteric regulation, post-translational modifi-
cation and transcriptional regulation [17–19]. The
covalent modification of GS is regulated by a dual,
bicyclic cascade (Fig. 1). GS can be both adenylylated
and deadenylylated by the bifunctional enzyme ade-
nylyltransferase (ATase) [22]; the N-terminal domain
of ATase carries the deadenylylation activity, the
C-terminal domain carries the adenylylation activity
[23–25]. Covalent modification of all 12 subunits of
GS (GS
12
) to yield GS
12
–AMP
12
results in an almost
inactive enzyme. Adenylylation of GS is stimulated by
the protein GlnB, whereas deadenylylation is stimu-
lated by the modified GlnB (GlnB–UMP) protein [22].
N-poor
GlnK
3
GlnK
3
–UMP
1–3
GlnB
3
–UMP
1–3
UTase
N-poor
N-rich
UTase
GlnB
3
N-rich
GS
12
–AMP
1–12
+
+
GS
12
ATase
+
+
glu + NH
3
gln
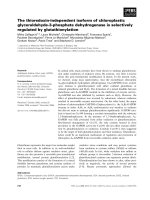
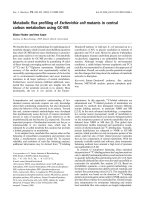
Fig. 1. The GS adenylylation dual bicyclic cascade in Escherichia coli.
The activity of GS which catalyses the incorporation of ammonia
(NH
3
) into glutamate (glu) forming glutamine (gln), is regulated by a
dual bicyclic cascade. Only the protein components are shown; addi-
tional substrates and products and the small molecule effectors, glu-
tamine and 2-oxoglutarate, of the four reactions are not included.
Reactions catalysed by the bifunctional enzymes UTase (EC 2.7.7.59)
and ATase (EC 2.7.7.49) are shown as solid curved arrows. Details
and kinetics of the reactions catalysed by UTase and ATase have
been described previously [22,26]. Stimulation of GlnB
3
, GlnB
3
–
UMP
1–3
, GlnK
3
and GlnK
3
–UMP
1–3
are shown by thin right-angled
arrows. +, stimulation. When cells are grown in N-poor medium (e.g.
in the absence of ammonia but in the presence of glutamine), UTase
catalyses the uridylylation of GlnB
3
and GlnK
3
forming GlnB
3
–UMP
1–3
and GlnK
3
–UMP
1–3
, respectively. The latter two stimulate ATase to
deadenylylate GS
12
–AMP
1–12
into native and active GS
12
. Reversibly,
when cells are grown in N-rich medium (e.g. in the presence of
ammonia) or in the absence of ammonia and pulsed with ammonia,
UTase catalyses the de-uridylylation of GlnB
3
–UMP
1–3
and GlnK
3
–
UMP
1–3
forming native GlnB
3
and GlnK
3
, respectively. GlnB
3
and
GlnK
3
stimulate ATase to adenylylate GS
12
into the almost inactive
GS
12
–AMP
12
. However, in N-rich medium the expression of glnK is
not activated [32,33,36] and therefore, in N-rich conditions GS is
regulated by only one bicyclic cascade.
W. C. van Heeswijk et al. GlnB: ultrasensitive versus subtle control
FEBS Journal 276 (2009) 3324–3340 ª 2009 The Authors Journal compilation ª 2009 FEBS 3325
Modification of GlnB is catalysed by the bifunctional
enzyme uridylyltransferase (UTase) [26]. GlnB is a
homotrimeric protein [27,28] and all three subunits
can be uridylylated. UTase may monitor the glutamine
concentration and GlnB may monitor 2-oxoglutarate
[26,29]. GlnB is also involved in the transcriptional
regulation of glnA, the gene encoding GS, via the
two-component regulation system NRI ⁄ NRII (NtrC ⁄
NtrB) (not shown in Fig. 1) [30,31]. GlnK, a para-
logue of GlnB [32–34], is also a homotrimer [35], and
can also stimulate the adenylylation reaction in vitro
[33,34], however, it is less potent than GlnB [34]. In
the presence of purified UTase or in extracts contain-
ing overproduced UTase, GlnK can be modified to
GlnK–UMP [33,34]. In N-poor media, glnK is
expressed and GS is regulated by a dual bicyclic
cascade (Fig. 1). In N-rich media, transcription of
glnK is not activated [32,33,36] and GS should be
regulated by only one bicyclic cascade. In this study,
we focus on the deadenylylation reaction.
To investigate the actual in vivo importance of GlnB,
the cascade must be studied in a wild-type chromosomal
background. Although helpful, a deletion strain missing
one of the proteins operating in the cascade will not
yield definitive information about the physiological state
because its signal flux is completely interrupted. Delet-
ing a parallel signal transduction pathway, e.g. by delet-
ing the glnK gene, will artificially force signal
transduction into the other route. Indeed, it has been
shown for some growth conditions of Escherichia coli
that GlnK can complement the absence of GlnB [33].
Borrowing a strategy from MCA, we therefore
implemented a small modulation of the GlnB concen-
tration in an otherwise wild-type environment, which
should not, therefore, affect the regulation structure of
the GS adenylylation system. We observed that the
pivotal regulatory protein GlnB does not control the
steady-state activity of GS. Its control of the deade-
nylylation rate of GS–AMP depends on the growth
history of the cells, but does not purport to signal
amplification. Functional implications and the mecha-
nistic basis for this conditional redundancy of GlnB
(and GlnK) are discussed.
Results
Modulation of the GlnB concentration in vivo and
the levels of GlnB and GlnK
In order to modulate cellular GlnB activity around
wild-type levels, we inserted a promoter cassette
containing a lacI
q1
gene and an isopropyl b-d-1-thio-
galactoside (IPTG)-inducible, P
A1lacO-1
promoter [37],
upstream of the glnB gene at the wild-type chromo-
somal location (Fig. 2). The P
A1lacO-1
promoter–opera-
tor sequence consisted of promoter P
A1
of phage T7
combined with two lacO-1 operators, as constructed
A
*
-
P
NotI*
NotI
glnBorfXB
cam
trpA
term
.
lacI
q1
A1lacO-1
RBS
EcoNI*
EcoNI*
B
0
50
100
150
200
0 50 100 150 200 250 300 350
[PII* ng·mg
–1
protein]
[IPTG] (µ
M
)
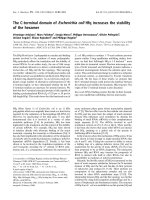
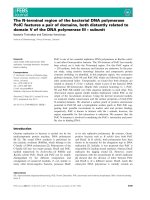
Fig. 2. Modulation of the glnB expression by IPTG. (A) The IPTG-
inducible promoter upstream of the glnB gene at the wild-type
chromosomal location of strain WCH15. The drawing is not to
scale. The promoter cassette was inserted as a NotI fragment into
the EcoNI site upstream of the translation start of the glnB gene
(NotI* and EcoNI* are blunted sites). The promoter cassette con-
tains a cam gene for chloramphenicol-resistance, a synthetic trpA-
transcriptional terminator [60], a LacI
q1
gene [38,39] and a synthetic
P
A1LacO-1
promoter [37]. The ribosomal binding site (RBS, black box)
is wild-type. Solid arrows indicate the orientation of transcription.
The dotted arrow indicates the transcription start point of the IPTG-
inducible promoter. (B) Intracellular P
II
* concentration as a function
of the extracellular IPTG concentration (l
M). Cells were grown in
the presence of ammonia. Cultures are the same as in Fig. 3. [P
II
*]
was measured by western blot analysis using polyclonal GlnB anti-
body, as described in Materials and methods. For the [P
II
*] dataset
(including error bars) see Fig. 3B. The error bars of the [P
II
*] values
<25ngÆmg
)1
protein are smaller than the symbol. Although this
antibody cross-reacts with GlnK, [P
II
*] may regarded as being
[GlnB] because glnK is not expressed in this medium. Closed cir-
cles depict WCH15 grown in the presence of the indicated concen-
tration of IPTG; the black line is a result of a linear regression
calculation of the data points from 0 to 150 l
M IPTG. Open circle,
YMC10 (wild-type); open square, RB9060 (4glnB). The IPTG con-
centration that should correspond with [P
II
*] of YMC10 and
RB9060 was calculated by interpolation of the two most proximate
[IPTG, P
II
*] data points of each strain.
GlnB: ultrasensitive versus subtle control W. C. van Heeswijk et al.
3326 FEBS Journal 276 (2009) 3324–3340 ª 2009 The Authors Journal compilation ª 2009 FEBS
by Lutz & Bujard [37]. The lacI
q1
gene contained a
promoter up-mutation which produced 100 times more
repressor than wild-type cells [38,39]. The inducible
promoter was inserted upstream of the glnB gene in a
lacY deletion mutant (lacU169) in order to enhance
the controllability of expression of the glnB gene by
IPTG [40]. The combination of these three elements in
strain WCH15 enabled us to titrate, using IPTG, the
cellular GlnB concentration around wild-type levels
(Fig. 2B). In the experiment shown in Fig. 2B, cells
were grown in the presence of ammonia and the indi-
cated IPTG concentration. The cellular GlnB concen-
tration in the various cultures was analysed by western
blot using a polyclonal GlnB antibody, as described in
Materials and methods. Because the polyclonal GlnB
antibody cross-reacted with paralogue GlnK, which
has the same electrophoretic mobility as GlnB [32], the
IPTG-dependent increase in the intensity of the GlnB
band was quantified as the sum of the concentrations
of GlnB and GlnK and was denoted by P
II
*. Note that
P
II
* includes the modified forms of GlnB and GlnK as
well, i.e. GlnB–UMP and GlnK–UMP. Because tran-
scription of glnK is not activated in medium containing
ammonia, [P
II
*] may be regarded as being [GlnB].
As shown in Fig. 2B, [P
II
*], and hence [GlnB], in the
wild-type strain (YMC10) is 87 ngÆmg
)1
protein.
[P
II
*] of the DglnB strain and of WCH15 without
IPTG is not completely zero because glnK may have
some residual activity. The (minor) difference between
the two strains may be because of inaccuracies in the
western blot method.
In cells grown in the presence of ammonia, GlnB
at wild-type levels does not control the GS–AMP
deadenylylation rate, although it does at lower
levels
WCH15 cells were grown overnight to A
600
$ 0.3 at
various IPTG concentrations in minimal medium con-
taining 22 mm glucose, 14 mm ammonia and 14 mm
l-glutamine (N-rich). At this growth stage, almost all
GS subunits were adenylylated (Fig. 3A; t = 0). The
adenylylation state of GS was expressed in terms of
the average number AMP moieties per GS dodecamer
(n), as inferred from an activity assay (see Materials
and methods). When we removed the ammonia plus
glutamine from the medium, by pipetting the washed
cells into the same medium without a nitrogen source
[32,33] (see Materials and methods), we found that
GS–AMP was de-modified towards GS, presumably
because of a shift in the P
II
* ⁄ P
II
*–UMP ratio towards
P
II
*–UMP. At various times after removal of the
nitrogen source, the maximum deadenylylation rate,
i.e. the rate in the inflection point of the curve in
Fig. 3A, was calculated as described in Materials and
methods. The cellular P
II
* concentration of the differ-
ent cultures was measured by western blot analysis
using a polyclonal GlnB antibody, as described above.
The deadenylylation rate in WCH15 without IPTG
was similar to the rate in the glnB deletion strain
(Fig. 3A), confirming the very low expression level of
glnB (and glnK) in WCH15 without IPTG. When we
increased the GlnB concentration towards wild-type
levels (by adding various concentrations of IPTG), the
rate of GS–AMP deadenylylation per GS-dodecamer
was proportional to the induced P
II
* concentration
(Fig. 3B). Because the variation in the IPTG concen-
tration primarily affects glnB expression, this result
demonstrates that signal transduction through the GS
deadenylylation cascade can be controlled by GlnB
(glnK is hardly expressed in medium containing ammo-
nia) [32,33,36]. Surprisingly, when the P
II
* concentra-
tion was around and above the wild-type level of
87 ngÆmg
)1
protein (open circle in Fig. 3B), the rate of
GS–AMP deadenylylation per GS-dodecamer was
insensitive to (small) variations in the P
II
* concentra-
tion. Consequently, in wild-type cells, the response
coefficient of the GS–AMP deadenylylation rate per
GS-dodecamer with respect to P
II
* concentration was
0. In a narrow region around the wild-type level, P
II
*
concentration did not control deadenylylation rate,
although it did when subject to a more sizeable reduc-
tion in its concentration (Fig. 3C).
If one were to interpret the experimental data
(Fig. 3) so as to indicate that, in the P
II
* concentration
range from 0% to 20% below the wild-type level, the
GS–AMP deadenylylation rate per GS-dodecamer var-
ies linearly with P
II
* activity, the corresponding
response coefficient increased from 0.0 to 0.9 (Fig. 3C).
A further increase in the P
II
* concentration from 20%
below the wild-type level to wild-type level, resulted in
an abrupt decrease in the response coefficient from 0.9
to 0. Because of the inaccuracy of the measured rates
and P
II
* concentrations we cannot exclude nonlinear
variation in the deadenylylation rate when the P
II
*
concentration is below the wild-type level, and hence
we cannot be sure about these precise numbers. What-
ever the exact kinetics of this variation, it is evident
that there is a rather abrupt change in the control
of the deadenylylation rate by P
II
* just below the
wild-type P
II
* concentration.
As shown above, the GS–AMP deadenylylation rate
per GS-dodecamer was constant around and above the
wild-type P
II
* concentration. The mean value of this
constant rate (d[)n] ⁄ dt) is 0.29 s
)1
. To determine
the extent to which the amount of P
II
* determines the
W. C. van Heeswijk et al. GlnB: ultrasensitive versus subtle control
FEBS Journal 276 (2009) 3324–3340 ª 2009 The Authors Journal compilation ª 2009 FEBS 3327
cellular GS–AMP deadenylylation rate, the cellular
GS
total
concentration of these cultures was measured
(Fig. 4). At P
II
* > 50 ngÆmg
)1
protein, including the
wild-type level, total GS concentration was virtually
constant (at $ 4 lgÆmg
)1
protein). As a result, the
absolute cellular GS–AMP deadenylylation rate was
virtually constant around and above the wild-type P
II
*
level (data not shown): the concentration of P
II
* exerts
no control on the absolute cellular GS–AMP deadeny-
lylation rate at or above the wild-type P
II
* level.
In cells grown in the absence of ammonia, P
II
*
at wild-type levels does not control the GS–AMP
deadenylylation rate either
We were also interested in the control exerted by GlnB
on the deadenylylation reaction in cells grown in the
absence of ammonia. Again we induced GlnB to vari-
ous levels by growing the GlnB-tuneable strain
WCH15 at various IPTG concentrations overnight in
minimal medium with 22 mm glucose, without ammo-
nia, but with 14 mml-glutamine (N-poor) [41], to
A
600
$ 0.3. At this growth stage, GS was almost com-
pletely in the native form and P
II
* was in the P
II
*–
UMP form (data not shown). After a subsequent
15-min incubation in the presence of 30 mm ammonia,
Time (s)
GS adenylylation (n)
0
2
4
6
8
10
12
A
Molar ratio (P
II
*)
3
/ ATase
GS–AMP deadenylylation rate (–n/s)
0.0
0.1
0.2
0.3
0.4
0123
B
Response coefficient
0.0
[P
II
*
] (ng·mg
–1
protein)
0 25 50 75 100 125 150 175
[P
II
*
] (ng·mg
–1
protein)
0 25 50 75 100 125 150 175
020
40
60 70 80 100 140
0.2
0.4
0.6
0.8
1.0
C
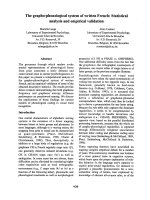
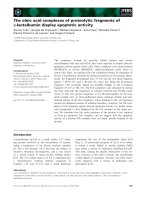
Fig. 3. Control of P
II
* on the GS–AMP deadenylylation rate per
GS-dodecamer in vivo. Cells were grown in the presence of ammo-
nia. (A) Deadenylylation of GS–AMP after removal of ammonia at
time zero. Open circles, YMC10 (wild-type); open squares, RB9060
(DglnB). The closed symbols depict WCH15 grown in the presence
of various concentrations of IPTG (to prevent overcrowding of the
figure only some cultures are shown) as follows: circles, 0 l
M;
squares, 25 l
M; triangles, 100 lM; inverted triangles, 300 lM. The
curves result from the fitting of the data, as described in Materials
and methods. Black lines, YMC10 and RB9060; dotted lines,
WCH15. (B) Dependence of the GS–AMP deadenylylation rate per
GS-dodecamer on the cellular P
II
* concentration. The deadenylyla-
tion rate was calculated as the rate in the inflection point of the fit-
ted curves, shown in (A) (see Materials and methods). The cellular
P
II
* concentration was measured by western blotting. The different
points are the mean of three independent cultures of RB9060
(open squares) or WCH15 containing the same IPTG concentration
(closed circles); for YMC10 (open circles) five independent cultures
were examined. Error bars indicate the SEM. The dotted line is a
result of two linear regression fits of the data points. The extra
abscissa on top of the figure indicates the molar ratio of P
II
*-tri-
mer ⁄ ATase-monomer. The cellular ATase concentration was mea-
sured from YMC10. (C) Response coefficient of the GS–AMP
deadenylylation rate per GS-dodecamer with respect to P
II
*. The
response coefficient (R
m
PIIÃ
) was calculated numerically using the
formula described in Materials and methods with the dotted line of
(B) as the dataset. Open circle, calculated response coefficient at
the P
II
* concentration of wild-type YMC10.
GlnB: ultrasensitive versus subtle control W. C. van Heeswijk et al.
3328 FEBS Journal 276 (2009) 3324–3340 ª 2009 The Authors Journal compilation ª 2009 FEBS
GS had been modified towards GS–AMP because of
the de-uridylylation of P
II
*–UMP forming P
II
*, which
stimulates adenylylation. The nitrogen source was then
removed, as described above, and samples were taken
at the indicated time points to determine the adenyly-
lation state of GS (Fig. 5).
As shown in Fig. 5B, the GS–AMP deadenylylation
rate per GS-dodecamer was now completely indepen-
dent of the cellular P
II
* concentration at an average
d[)n] ⁄ dt = 0.12 s
)1
. Consequently, the response coeffi-
cient of the GS–AMP deadenylylation rate per
GS-dodecamer with respect to P
II
*, as defined above,
was 0 and independent of the P
II
* concentration (data
not shown; see Materials and methods for the calcula-
tion of these response coefficients). This result
indicates that if cells have been pregrown in medium
without ammonia, the P
II
* concentration does not
control the GS–AMP deadenylylation rate per
GS-dodecamer.
At a constant GS–AMP deadenylylation rate per
GS-dodecamer, the cellular GS–AMP deadenylylation
Time (s)
0 20406080100120140
GS adenylylation (n)
0
2
4
6
8
10
12
A
[P
II
*] (ng·mg
–1
protein)
100 150 200 250 300
GS–AMP deadenylylation rate (–n/s)
0.0
0.1
0.2
0.3
0.4
B
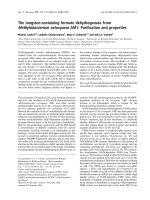
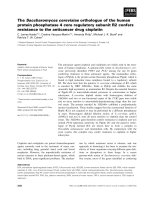
Fig. 5. In vivo GS–AMP deadenylylation per GS-dodecamer at vari-
ous cellular P
II
* concentrations. Cells grown in the absence of
ammonia were incubated with 30 m
M ammonia for 15 min. (A)
Deadenylylation of GS–AMP after removal of ammonia at time
zero. Time is given in s. The adenylylation state of GS is expressed
in terms of the average number AMP moieties per GS dodecamer
(n). Open circles, strain YMC10 (wild-type); open squares, strain
RB9060 (4glnB). Closed symbols depict strain WCH15 grown in
the presence of IPTG at various concentrations (to prevent over-
crowding of the figure only some cultures are represented) as fol-
lows: squares, 25 l
M; triangles, 75 lM. The curves result from
fitting of the data, as described in Materials and methods. Black
lines, YMC10 and RB9060; dotted lines, WCH15. (B) Dependence
of the GS–AMP deadenylylation rate (n ⁄ s) on the cellular P
II
* con-
centration. The deadenylylation rate was calculated as the rate in
the inflection point of the fitted curves shown in (A) (see Materials
and methods). The cellular P
II
* concentration was measured by
western blotting. Each closed circle (WCH15) and open circle
(YMC10) is the mean of two experiments (the error bars indicating
the standard error of the mean). The closed squares (WCH15) and
open square (strain RB9060) are data from single cultures.
[P
II
*] (ng·mg
–1
protein)
0 25 50 75 100 125 150 175
[GS
total
] (µg·mg
–1
protein)
0
2
4
6
8
10
12
Fig. 4. Dependence of the GS
total
concentration on the cellular P
II
*
concentration. Cells were grown in the presence of ammonia. Cul-
tures are the same as in Fig. 3. Cellular concentrations of GS
total
and
P
II
* were measured by western blot analysis, as described in Materi-
als and methods. For the P
II
* dataset and symbols see Fig. 3B.
W. C. van Heeswijk et al. GlnB: ultrasensitive versus subtle control
FEBS Journal 276 (2009) 3324–3340 ª 2009 The Authors Journal compilation ª 2009 FEBS 3329
rate might change if the cellular GS
total
concentration
varied with the P
II
* concentration. The cellular GS
total
concentration was again measured by western blotting
using polyclonal GS antibody. GS
total
was independent
of the P
II
* concentration (24–30 lgÆmg
)1
protein;
except for cultures containing 145 ngÆmg
)1
protein of
P
II
*, in which a mean GS concentration of
$ 8 lgÆmg
)1
protein was measured). Therefore, both
cellular GS–AMP deadenylylation rate and GS–AMP
deadenylylation rate per GS-dodecamer were virtually
independent of the P
II
* concentration (d[GS–
AMP] ⁄ dt = 0.24–0.3 mgÆg protein
)1
Æs
)1
). This rate
was a factor of 2.4 higher than the corresponding rate
in cells grown in the presence of ammonia, which
agrees with the qualitative increase reported earlier
[33].
Cells grown in the absence of ammonia:
GlnB versus GlnK
Above we measured the primary effect of modulating
the expression of glnB in terms of the concentration of
P
II
*, which corresponds to the sum concentration of
GlnB and GlnK. The absence of variation in the
deadenylylation rate with the increase in GlnB, corre-
sponded to an independence of the deadenylylation
rate of IPTG and hence expression of the glnB operon,
and therefore by definition of GlnB. However, because
GlnK might also vary with the induction of more
GlnB, this may not necessarily mean an absence of
direct control by GlnB on the deadenylylation rate;
changes in GlnK might have compensated for the
effects of the changes in GlnB.
We therefore estimated the concentration of GlnK.
[P
II
*] for wild-type YMC10 grown in the absence of
ammonia was 230 ngÆmg
)1
protein (Fig. 5B). Because
expression of glnB is constitutive [42], the GlnB con-
centration in YMC10 in this medium should be
87 ngÆmg
)1
protein, as in medium containing ammo-
nia. Thus, the ratio [GlnK] ⁄ [P
II
] in wild-type cells
grown in medium without ammonia should be close to
(230)87) ⁄ 87 = 1.7. This is a much smaller ratio than
the 500 mentioned as an unpublished observation by
Javelle et al. [43]. Because that observation was not
documented, the reason for the difference is uncertain.
First, the unpublished observation was made in a med-
ium with 10-fold lower glutamine concentrations. Sec-
ond, the minimal medium was phosphate buffered,
whereas in our experiments the medium was buffered
with Mops. The phosphate concentration in minimal
medium may be relevant because Senior [44] observed
a 10-fold increase in GS activity when the phosphate
concentration in the minimal medium used was
increased 12.5-fold. However, it remains to be seen
whether that would be similar for [GlnK]. Third, there
was a different strain background (ET8000 versus
YMC10; difference in DNA gyrase).
Figure 5B proves that the GlnK⁄ GlnB ratio in our
wild-type cells, grown in the absence of ammonia, can-
not have been 500. If [GlnB] were only 0.2% of [P
II
*]
then reduced glnB expression by the IPTG-induction
strategy could never have reduced P
II
* by > 0.2%. In
fact, it was reduced by > 50% in the experiment in
which IPTG was absent.
Because the ratio [GlnK] ⁄ [GlnB] in wild-type cells
grown in the absence of ammonia is only 1.7, if
anything, GlnB should repress glnK, and because the
primary modulation is that of an increase in
the expression of glnB, the increase along the abscissa
in Fig. 5 should correspond to the same or a slightly
larger increase in [GlnB]. Consequently, neither P
II
*
nor GlnB itself control the deadenylylation rate in cells
grown in the absence of ammonia.
In cells grown in the absence of ammonia, GlnK is
present. [P
II
*] for RB9060 (glnB-deletion strain) may
be equated to [GlnK] (100 ngÆmg
)1
protein) (Fig. 5B).
Because in this experiment expression of glnB is depen-
dent only on [IPTG] and glnK expression is negatively
regulated by GlnB, the increase in [P
II
*] from 100 to
almost 300 must imply an increase in [GlnB ] from 0
to 300 or at most 400 ngÆmg
)1
protein (the latter if
GlnK were to decrease to 0 with increasing [GlnB]).
None of this alters the fact that this figure shows that
the GS deadenylylation rate does not vary with [GlnB],
P
II
*orglnB gene expression. Hence neither glnB nor
GlnB control the deadenylylation rate when cells are
pregrown in the absence of ammonia; and nor does
the sum of GlnK and GlnB. Therefore, the conclusion
of a lack of (ultra)sensitivity in the cascade is not
compromised by the fact that the antibody we used to
detect GlnB cross-reacts with GlnK.
The abrupt change in control by P
II
* occurs
at a P
II
*-trimer/ATase-monomer molar ratio of 1
The cellular ATase concentration of wild-type strain
YMC10, as determined from the two independent cul-
tures used in Figs 3 and 5, was 0.18 lgÆmg
)1
protein
(SEM 7 ngÆmg
)1
protein), as measured by western blot
analysis using a polyclonal ATase antibody. Expres-
sion of the glnE gene, which encodes ATase, is not
regulated by the nitrogen status of the cell [42]. This
makes it unlikely that the intracellular ATase concen-
tration depends on the GlnB or P
II
* concentration.
Assuming that the ATase monomer concentration was
0.18 lgÆmg
)1
protein throughout, the molar ratio of
GlnB: ultrasensitive versus subtle control W. C. van Heeswijk et al.
3330 FEBS Journal 276 (2009) 3324–3340 ª 2009 The Authors Journal compilation ª 2009 FEBS
P
II
*-trimer to ATase-monomer was calculated for all
P
II
* concentrations [see the extra abscissa (on top) in
Fig. 3B]. The rate of GS–AMP deadenylylation per
GS-dodecamer changed from being dependent on the
P
II
* concentration to being independent of it around
the point at which the molar ratio of the P
II
*-trimer to
ATase was 1. This suggests that above this ratio the
ATase is fully saturated with P
II
*-trimer. Moreover, it
suggests that ATase cannot be stimulated by binding
more than one P
II
*-trimer. Additional experimentation
should verify this suggestion.
P
II
* uridylylation is competent kinetically
It is the uridylylated form of GlnB that stimulates the
deadenylylation activity of ATase [22]. Therefore, upon
removal of ammonia, the GlnB must be uridylylated
before deadenylylation can be set in motion. An expla-
nation for the lack of control by wild-type levels of
P
II
* on GS–AMP deadenylylation may be that P
II
*
uridylylation might not keep up with the increase in
P
II
* concentration. UTase may attain its V
max
at a
P
II
* concentration far below the wild-type concentra-
tion of the latter (K
m
(½P
II
Ã
WT
). To examine this
possibility, the uridylylated fraction of P
II
*, i.e. P
II
*–
UMP ⁄ P
II
*
total
, was measured in the same samples used
to measure the deadenylylation of WCH15 grown in
the presence of ammonia at various P
II
* induction
levels (see above). The two forms of P
II
* were distin-
guished by western blot analysis using a high-resolu-
tion tricine gel (see Materials and methods) [33]. The
uridylylated fraction (i.e. P
II
*–UMP ⁄ P
II
*
total
) was
determined as described in Materials and methods. As
shown in Fig. 6A, at all P
II
* concentrations, the
uridylylation of P
II
* was almost complete 30 s after
the removal of ammonia. The cellular P
II
* uridylyla-
tion rate (not its fractional P
II
*–UMP ⁄ P
II
*
total
uridyly-
lation rate) appeared to increase proportionally with
P
II
* concentration (Fig. 6B). Consequently, at P
II
*
levels > 50 ngÆmg
)1
protein, the percentage uridylyla-
tion at any time after the removal of ammonia was
independent of the concentration of P
II
*, as suggested
by Fig. 6A. However, uridylylation of P
II
* in WCH15
induced with 25 lm IPTG was slower and incomplete
compared with cultures induced with higher IPTG
concentrations (Fig. 6A). It is possible that at this
induced P
II
* concentration (WCH15 induced with
25 lm IPTG) [P
II
*] is (far) below the K
m
of the
uridylylation reaction and therefore slower than that
in cultures with a (much) higher P
II
* concentration.
This result suggests that the P
II
* uridylylation reac-
tion per se is quick enough for P
II
*–UMP to activate
deadenylylation. The reaction may still progress but
only because of a progressing change in the signals
impinging on uridylyl transferase (such as glutamine or
2-oxoglutarate).
Time (s)
P
II
*-UMP / P
II
*
total
0.0
0.2
0.4
0.6
0.8
1.0
A
[P
II
*] (ng·mg
–1
protein)
0 20406080100
0 25 50 75 100 125 150 175
P
II
* uridylylation rate (ng·mg
–1
protein·s
–1
)
0
1
2
3
4
B
Fig. 6. Uridylylation of P
II
* in vivo. Cells were grown in the pres-
ence of ammonia. Cultures are the same as in Fig. 3. (A) Uridylyla-
tion of P
II
* after removal of ammonia at time zero. Open circles,
YMC10 (wild-type). The closed symbols depict WCH15 grown at var-
ious concentrations of IPTG as follows: circles, 25 l
M; squares,
75 l
M; triangles, 150 lM; inverted triangles, 300 lM. The curves
result from fitting of the data as described in Materials and methods.
Black line, YMC10; dotted lines, WCH15. (B) Dependence of the P
II
*
uridylylation rate on the cellular P
II
* concentration. The uridylylation
rate was calculated as the initial rate of the fitted curves shown in
(A) (see Materials and methods). The cellular P
II
* concentration was
measured by western blotting. The different points are the means of
two or three independent cultures and correspond to those in Fig. 3.
Error bars indicate the standard error of the mean. The line results
from a linear regression calculation of the data points.
W. C. van Heeswijk et al. GlnB: ultrasensitive versus subtle control
FEBS Journal 276 (2009) 3324–3340 ª 2009 The Authors Journal compilation ª 2009 FEBS 3331
As to the initial uridylylation rate, the response
coefficient with respect to the P
II
* concentration was
close to 1 for the P
II
* concentration range examined
(Fig. 6B; detailed analysis not shown). Apparently,
the uridylylation reaction appears to be noncoopera-
tive with respect to P
II
*, in agreement with in vitro
data [45].
Figure 7 directly compares the transient uridyly-
lation of P
II
* (i.e. a decrease in P
II
* ⁄ P
II
*
total
) with the
transient deadenylylation of GS–AMP per GS-dode-
camer (GS–AMP ⁄ GS
total
,adecrease in the adeayly-
lation state of GS) at various engineered P
II
*
concentrations. We conclude that the former (Fig. 7,
open squares) preceded the latter, but with increasing
cellular P
II
* concentration, the rate of uridylylation
approached the rate of deadenylylation.
P
II
* has no control over the steady-state GS
adenylylation state in the presence of ammonia
As described above, to study the deadenylylation rate
as a function of induced GlnB, strain WCH15 was
grown overnight in the presence ammonia and at vari-
ous concentrations of IPTG to A
600
$ 0.3 before the
ammonia was removed. Consequently, the GS adenyly-
lation state (which we denote by n) before the ammo-
nia is removed (at time zero in Fig. 3A), represents the
steady-state adenylylation state of these cells in the
presence of ammonia. As shown in Fig. 8 (left), varia-
tion in the P
II
* concentration around the wild-type
level did not change this steady GS adenylylation state.
Consequently, at wild-type levels of P
II
*, the response
coefficient of the steady-state GS adenylylation state
towards P
II
* concentration was 0 : P
II
* did not control
the steady-state GS adenylylation state.
At cellular P
II
* concentrations < 40 ngÆmg
)1
pro-
tein, the steady-state GS adenylylation states appeared
slightly higher than at higher P
II
* concentrations. The
difference in the adenylylation state of the glnB dele-
tion strain ($ 11) compared with that of the wild-type
strain ($ 9) should correspond to a decrease in active
(unmodified) GS by $ 60%, if the total GS concentra-
tion was the same in both strains. With the total GS
concentration (Fig. 4), one can calculate the cellular
(active) GS concentration as function of the cellular
P
II
*. Perhaps surprisingly, the cellular nonadenylylated
GS concentration was approximately constant over the
range of P
II
* measured, and also at low P
II
* concen-
trations (see dotted line in Fig. 8, right). The slight
increase in adenylylation state and the increase in
GS
total
concentration at low P
II
* concentrations appear
to compensate for one another, perhaps reflecting
homeostatic regulation.
Discussion
In this study, we tested quantitatively in vivo and
under two relevant growth conditions, whether signal
transduction from ammonia depletion to GS–AMP
deadenylylation is highly sensitive to the concentration
of the pivot of the GS cascade, i.e. GlnB. It was not.
In fact it was not sensitive at all to the concentration
of GlnB (P
II
*) around the wild-type level of the latter.
Neither the steady-state extent of adenylylation of GS,
nor the rate at which GS–AMP became deadenylylated
upon ammonia deprivation, depended on glnB gene
expression (as modulated by IPTG) or on the concen-
tration of P
II
* (i.e. GlnB–UMP plus GlnK–UMP).
This most direct in vivo test refutes a signal-amplifica-
tion function proposed for this cascade in vivo under
Time (s)
0 20 40 60 80 100 120 140
GS–AMP/GS
total
0.0
0.2
0.4
0.6
0.8
1.0
P
II
*/P
II
*
total
0.0
0.2
0.4
0.6
0.8
1.0
Fig. 7. Comparison between the transient uridylylation of P
II
* and
the transient deadenylylation of GS–AMP. See also Figs 3 and 6.
Cells had been grown in the presence of ammonia. Uridylylation of
P
II
* and deadenylylation of GS–AMP were measured after removal
of ammonia at time zero. The data points are raw data; the curves
are connections between the data points and do not result from
fitting of the data. Transient deadenylylation reactions at different
P
II
* concentrations: open circles, YMC10. The closed symbols
depict WCH15 at various concentrations of IPTG as follows: cir-
cles, 0 l
M; squares, 25 l M; triangle, 300 lM. Only one transient
uridylylation of the fractional P
II
* ⁄ P
II
*
total
is shown because the
transient uridylylation of the fractional P
II
* ⁄ P
II
*
total
after removal of
ammonia was independent of the P
II
* concentration (Fig. 6). Open
squares, wild-type YMC10. To simplify the comparison, the tran-
sient deadenylylation of GS–AMP is shown as a decrease of the
fractional adenylylation level (left y-abscissa), and the transient
uridylylation of P
II
* as a decrease of the fractional native P
II
* level
(right y-abscissa). Both were calculated from data of Figs 3 and 6,
respectively.
GlnB: ultrasensitive versus subtle control W. C. van Heeswijk et al.
3332 FEBS Journal 276 (2009) 3324–3340 ª 2009 The Authors Journal compilation ª 2009 FEBS
at least two important physiological conditions.
Because this cascade often figures as a model for signal
transduction, this conclusion should be important for
understanding signal transduction more generally.
In view of the possible role of the paralogue of
GlnB, GlnK, we tested for signal amplification in two
times two ways: (a) we determined the sensitivity
towards variation in expression of the glnB gene
around its wild-type level, and (b) we determined how
strongly function varied with the level of GlnB plus
GlnK in the same experiment. We performed this
experiment first under a condition in which we con-
firmed that GlnK was virtually zero, and then under a
condition in which, at the zero level of GlnB, GlnK
was substantial. Because both covariations were zero
in both experiments, this implies that at physiological
levels of GlnB, the dependence of function on GlnB is
zero, independent of whether one takes any possible
variation of GlnK into account. It is important that
we emphasize here that we discuss dependence in terms
of the effect of small variations in GlnB around its
wild-type level. For larger variations, the issue is more
complex, but ultrasensitivity was still not observed
(Fig. 3 and below).
The mechanistic explanation for this outcome may
well be that the models leading to the prediction of
zero-order ultrasensitivity [3,4] do not apply in vivo
[8,9], that the in vivo kinetics and abundances were
such that they did not give rise to zero-order ultrasen-
sitivity, or that gene expression mediated adaptation
involving GlnK or metabolic adaptations prevented
kinetic scenarios from being enacted. As to the first
possibility, the GS adenylylation cascade differs from
the cascades modelled in these studies: the two reac-
tions catalysed by ATase are activated by different
activators, GlnB and GlnB–UMP (Fig. 1), which are
in balance at steady-state growth. The third explana-
tion is unlikely because we determined GS deadenyly-
lation as a function of the sum concentration of GlnB
and GlnK (P
II
*) and of the induction of glnB expres-
sion. With respect to the metabolic adaptations, that
of the concentration of 2-oxoglutarate is also unlikely.
Under nitrogen-limiting conditions, [P
II
*] changes by
$ 5 lm, whereas under nitrogen excess, [P
II
*] varied
from 0 to 3 lm. This variation is much less than the
reported intracellular concentration of 2-oxoglutarate
under those conditions (from $ 0.1 to $ 0.9 mm) [44].
Our observation of a steady-state GS adenylylation
level being independent of [GlnB] around its wild-type
level (Fig. 8) is in agreement with a computer simula-
tion of the GS adenylylation bicyclic cascade by Muta-
lik et al. [46].
Our observations leave us with the puzzle of a func-
tional explanation for the existence of GlnB: why
should control by P
II
* be absent altogether, and what
then is the function of the cascade and of its pivot
GlnB? The problem is reinforced by the observation
that, in cells grown in the absence of ammonia, dele-
tion of GlnB hardly affected the deadenylylation rate
of GS–AMP. The pivotal protein GlnB appeared to be
redundant.
One functional explanation for redundant pheno-
types is that of the conditional phenotype, i.e. some
proteins only function under special conditions [47].
[P
II
*] (ng·mg
–1
protein)
[P
II
*] (ng·mg
–1
protein)
Non-adenylylated GS (µg·mg
–1
protein)
0
1
2
3
0 25 50 75 100 125 150 175
0 25 50 75 100 125 150 175
GS adenylylation state (n)
0
2
4
6
8
10
12
Fig. 8. Dependence of the steady-state adenylylation state and dependence of the concentration of nonadenylylated GS on the P
II
* concen-
tration. Cells were grown in the presence of ammonia. Cultures were the same as in Fig. 3. (Left) Steady-state adenylylation state at various
cellular P
II
* concentrations (see time zero of Fig. 3A). For the P
II
* dataset and symbols see Fig. 3B. The dotted line is not a result of fitting
of the data points. (Right) Calculated concentration of nonadenylylated GS (from Fig. 8, left and Fig. 4) at various cellular P
II
* concentrations.
Symbols are as in Fig. 8 left. The dotted line (see text) has been drawn by hand.
W. C. van Heeswijk et al. GlnB: ultrasensitive versus subtle control
FEBS Journal 276 (2009) 3324–3340 ª 2009 The Authors Journal compilation ª 2009 FEBS 3333
Another explanation relates to the so-called quantita-
tive phenotypes [48], i.e. some proteins may exist only
to improve functions that are already carried out by
other proteins. Both types of explanation seem poten-
tially relevant here. (a) Depending on whether cells
had been pregrown in the presence or absence of
ammonia, the GlnB phenotype differed: in the former
case, large reductions in the expression level of glnB
did affect the GS deadenylylation rate and a complete
knockout of GlnB did do so very strongly [33],
whereas in the latter case there was complete indepen-
dence of P
II
*. (b) The effect of reducing the concentra-
tions of P*
II
in cells grown in the presence of
ammonia depended on the magnitude of the reduction,
being zero for small reductions and significant (though
much less than consistent with ultrasensitivity) for
reductions of > 50%. In the absence of ammonia, i.e.
in the absence of GlnB, there was ample GlnK, which
is known to stimulate deadenylylation [49].
What then is the quantitative and conditional func-
tion of the dual bicyclic cascade around GlnB and
GlnK in the regulation of the activity of GS? As sug-
gested previously [50], one advantage of a cascade-type
regulation, as compared to allosteric regulation, is that
many more effectors may be involved in the regulation
via interactions with the different proteins operating in
the cascade, resulting in an integration of the various
signals. Indeed, UTase appears to monitor the gluta-
mine concentration, whereas GlnB seems to be a
sensor for 2-oxoglutarate [26,29]. Additional experi-
ments have shown that GlnB can bind ADP [51] in
addition to its binding of ATP [29] and thus may sense
the intracellular phosphorylation potential or adenylate
energy charge [51]. Taken together, GlnB may function
as an integrator of three signals: Gibbs energy
(through the ADP ⁄ ATP ratio), carbon limitation
(through 2-oxoglutarate) and nitrogen limitation
(through uridylylation), and may transduce the inte-
grated signal to its receptor proteins. In addition,
GlnB may coordinate the activity of GS with the
expression of glnA, the gene encoding GS [17,52,53].
When the cells had been grown in the absence of
ammonia, the maximum rate of deadenylylation
attained at high P
II
* concentrations was two- to three-
fold lower (Fig. 5) than when the cells had been grown
in the presence of ammonia (Fig. 3). This makes sense
functionally; cells grown in the presence of ammonia
have a low GS concentration. Hence, it is more impor-
tant for them to rapidly activate the enzyme. Cells
grown under nitrogen limitation have much GS and
activation of the enzyme should be done with caution
because inadvertent activation could produce futile
cycling. We conclude that the pivotal protein GlnB
(and its twin GlnK, see below) may have a conditional
and quantitative, rather than just a qualitative, func-
tion (and phenotype).
The question arises as to what could be the mecha-
nism of the subtle regulation by and around GlnB.
Here, a key observation may be the correlation of the
expression of the GlnB paralogue GlnK with the
change of control by GlnB on the deadenylylation
rate. When cells are grown in the absence of ample
ammonia, glnK is expressed [33,36], and heterotrimers
can be formed when both GlnB, and GlnK, homotri-
mers are present [49,54]. In vitro, uridylylated
GlnK ⁄ GlnB heterotrimers can stimulate the deadeny-
lylation of GS–AMP. This may explain the absence of
a GlnB phenotype in cells grown in the absence of
ammonia. The GlnK could already suffice to saturate
ATase, modulation of the GlnB would then have no
further effect, and hence GlnB expression and P*
II
would have no control. In cells grown in the presence
of ammonia, expression of glnK is not activated
[33,36], such that a major reduction in the concentra-
tion of GlnB does affect GS deadenylylation. Indeed,
in both cases, at PII* concentrations > 100 ngÆmg
)1
protein the two paralogues together have no control
over deadenylylation. In vitro the uridylylated
GlnK ⁄ GlnB heterotrimers are less active than the
uridylylated GlnB homotrimers [49], which may
explain the 2.4-fold lower maximum deadenylylation
rate when cells have been grown in the absence of
ammonia.
The abruptness of the change in the control exerted
by P
II
* on the deadenylylation rate, when GlnK is
hardly expressed, is interesting: a jump from almost
complete (0.9) to no (0) control at a P
II
* concentra-
tion some 20% below the wild-type level. At this P
II
*
concentration, the molar ratio ATase-monomer ⁄ P
II
*-
trimer is close to one. Therefore, the jump and the
zero control of P
II
* on the deadenylylation might be
caused by the following mechanism. ATase may be
saturated with P
II
*(–UMP)-trimer above a molar ratio
of 1, the binding constant of the corresponding com-
plex being lower than the concentration of ATase;
note that under this growth condition neither NRII
(NtrB) nor AmtB, which could titrate the GlnB pro-
tein, are abundant [36]. That the deadenylylation
activity of ATase cannot be stimulated by more than
one P
II
*(–UMP)-trimer is consistent with in vitro
observations (see Fig. 6 of Son & Rhee [55]; note that
in that study GlnB was incorrectly assumed to be a
tetramer). Saturation of interconvertible enzymes with
effector molecules may have important consequences
for their function, such as sudden changes in con-
trol. To date, this has largely been overlooked in
GlnB: ultrasensitive versus subtle control W. C. van Heeswijk et al.
3334 FEBS Journal 276 (2009) 3324–3340 ª 2009 The Authors Journal compilation ª 2009 FEBS
quantitative analyses of cascade-type regulation,
although a similar phenomenon may be recognized
for the reported control of the phosphotransferase
activity by IICBGlc [56]. The lack of control by P
II
*
on the deadenylylation reaction for cells grown in the
absence of ammonia, may also be explained by
the model described above: even without induced
GlnB, ATase may be saturated with GlnK homotri-
mers or Glnk–GlnB heterotrimers.
To further substantiate of these mechanistic expla-
nations, more research will be required. Such research
should also clarify the minor uncertainties left in this
study. As described above, the concentration of GlnB
was measured as P
II
*, i.e. as a sum of GlnB and
GlnK, including the uridylylated form of both pro-
teins. Cells grown in the presence of ammonia barely
express glnK [33,36]. Therefore, the measured P
II
*
concentration should be virtually the same as their
GlnB concentration. However, the fraction GlnK in
P
II
* might be higher at P
II
* concentrations (far)
below the wild-type concentrations because unmodi-
fied P
II
* negatively regulates expression of glnK [45],
perhaps similarly to the expression of glnA (Fig. 4),
although the strength of the glnK promoter is lower
than that of glnA [36]. Similarly, the ratio GlnB ⁄ P
II
*
might not be the same for different induced levels of
GlnB for cells grown in the absence of ammonia,
when GlnK is expressed. In either case, the uncer-
tainty in the ratio GlnB ⁄ P
II
* affects our conclusion
that neither GlnB nor GlnB and GlnK combined
(P
II
*) control deadenylylation: the observed response
coefficient to IPTG was 0 and when glnK expression
was not activated by excess ammonia, independent of
the P
II
* concentration. Experiments with a glnK dele-
tion strain or with myc-tagged GlnK should confirm
this. The system is complex and important. Reporting
our data is a useful step towards unravelling the total
complexity of the system in future. In a series of
experiments much like the ones presented here, we
have experienced how working with these complex
systems can lead to discoveries, such as that of GlnK
itself [32,33].
We conclude that, under two important physiologi-
cal conditions in E. coli, the GS cascade (or at least
the part below GlnB) is unlikely to serve the function
of amplifying the nitrogen signal. Rather, dynamic reg-
ulation of GS activity alone involves a subtle interplay
between GlnB, GlnK and ATase. These subtleties may
have functional consequences that enhance the fitness
of the cell without being necessary for its survival.
Contrary to what has previously been proposed, the
GS cascade may derive its evolutionary persistence
from its ability to modulate signal transduction subtly
rather than by strongly amplifying the signal. It may
sense, interpret and integrate signals concerning
energy, carbon and nitrogen status.
GlnB is not alone in being apparently important yet
devoid of a strong phenotype. H
+
-ATPase [14] and
glutamate dehydrogenase [57] share these properties. It
remains to be seen how many proteins have subtle
phenotypes, i.e. serve to improve rather than to realize
function.
Materials and methods
Bacterial strains and media
The bacterial strains used are listed in Table 1. YT agar
plates contained YT medium [33] and 1.5% agar (Difco,
Sparks, MD, USA) supplemented with, when appropriate,
ampicillin (50–100 lgÆmL
)1
), chloramphenicol (25 lgÆmL
)1
)
or kanamycin (25 lgÆmL
)1
) Cells were adapted to nitrogen
sources by overnight growth in 22 mm glucose ⁄ 40 mm
Mops [58], containing 10 lgÆmL
)1
thiamine, without IPTG.
The nitrogen source was 14 mml-glutamine (nitrogen-
poor) or 14 mml-glutamine plus 14 mm NH
4
Cl (nitrogen-
rich). Cultures were diluted in corresponding fresh medium
and inoculated into 50–100 mL nitrogen-poor medium in
300-mL Erlenmeyer flask and incubated in a New Bruns-
wick model G76 water bath shaker (New Brunswick Scien-
tific Co, Inc., Edison, NJ, USA) or inoculated into 300-mL
nitrogen-rich medium in 1-L Erlenmeyer flasks and incu-
bated in a New Brunswick model G25 air shaker, each with
IPTG at the concentration indicated and without antibiot-
ics. These cells were grown overnight at 37 °CtoA
600
$ 0.3. Cells grown in nitrogen-poor medium were exposed
to ammonia with 30 mm NH
4
Cl for 15 min. An l-gluta-
mine (Sigma, St Louis, MO, USA) stock solution was
freshly prepared before use.
Plasmid constructions
To facilitate insertion of the lacI
q1
gene and the IPTG-
inducible P
A1LacO-1
promoter upstream of the glnB gene at
the wild-type chromosomal glnB location, we constructed a
cassette containing these elements. This cassette was con-
structed by inserting the following four DNA fragments (in
Table 1. Escherichia coli K-12 strains used in this study.
Strain Genotype References
YMC10 endA1 thi-1 hsdR17 supE44
DlacU169 hutC
klebs
[71]
RB9060 As YMC10, but DglnB2306 [72]
WCH15 As YMC10, but glnBp::(cam,
trpA-transcription terminator,
LacI
q1
, promoter P
A1LacO-1
)
This study
W. C. van Heeswijk et al. GlnB: ultrasensitive versus subtle control
FEBS Journal 276 (2009) 3324–3340 ª 2009 The Authors Journal compilation ª 2009 FEBS 3335
this order) into the polylinker of pBluescript-II-SK
+
(pBI-
ISK; Stratagene Europe, Amsterdam, the Netherlands),
resulting in pWVH93. (a) The chloramphenicol-resistance
(cam) gene isolated from pACYC184 [59]: pACYC184 was
cut with HaeII and blunted with the Klenow fragment of
DNA polymerase I. The DNA fragment containing the
cam gene was ligated into the BamHI site (blunted with the
Klenow fragment of DNA polymerase I) of pBIISK (see
Fig. 2 for its orientation). (b) NotI linker (5¢-AGC
GGCCGCT-3¢; New England Biolabs, Ipswich, MA, USA)
was ligated into the HincII site of the pBIISK polylinker.
(c) One linker containing a trpA-transcription terminator
(5¢-AGCCCGCCTAATGAGCGGGCTTTTTTTT-3¢; Phar-
macia, GE Healthcare, Uppsala, Sweden) [60] was ligated
into the SmaI site of the pBIISK polylinker. The sequence
and orientation of the trpA-transcription terminator was
checked by sequence analysis (data not shown). (d) A 1.6-
kb DNA fragment isolated from pLBJ59 [61] containing
the lacI
q1
gene [38,39] and the P
A1lacO-1
promoter [37] (with-
out ribosomal binding site) was ligated into the EcoRV site
of the pBIISK polylinker. pLBJ59 was cut with FspI and
EcoRI; the latter blunted with the Klenow fragment of
DNA polymerase I. The sequence and orientation of the
P
A1lacO-1
promoter was checked by sequence analysis (data
not shown). pLBJ59 is similar to pLBJ60 without an
inserted EcoRI–HindIII DNA fragment, containing the
E. coli gef gene [62].
The glnB gene and the upstream 3¢-coding region of the
orfXB gene, isolated as a 1.5-kb EcoRI–SalI fragment from
pDK601[42], was ligated into a similarly digested pUC18Sfi
[63], resulting in pWVH90. pWVH102 was constructed by
cloning the NotI fragment of pWVH93, containing the pro-
moter cassette, into the EcoNI site of pWVH90, after both
sites had been blunted with the Klenow fragment of DNA
polymerase I. The endogenous ribosomal binding site of
the glnB gene resides downstream the EcoNI site. The
endogenous promoters of glnB [42,64,65] are still present
on the chromosome after homologous recombination of the
DNA between the SfiI sites of pWVH102, containing the
promoter cassette upstream glnB, with the wild-type
chromosome. However, transcription originating in these
promoters should terminate in the cam gene or at the
trpA-terminator.
Vector pFC13 [66], temperature sensitive for DNA repli-
cation, was modified by: (a) substituting its cam gene for
the kanamycin-resistance gene. The latter was isolated as a
BamHI–XmnI fragment from pACYC177 [59] and ligated
into pFC13 digested with BamHI and SspI, resulting in
pWVH112; and (b) inserting a linker containing the restric-
tion sites SfiI, NotI and BssHII with on both ends sticky
BamHI sites (5¢-GATCCGCGCGCGGCCGCCTAGGCC
G-3¢) into the BamHI site of pWVH112, resulting in
pWVH116.
The glnB gene with the promoter cassette upstream, was
isolated as a SfiI fragment of pWVH102 and ligated into
the temperature-sensitive vector pWVH116, digested with
SfiI, resulting in pWVH117.
Construction of strain WCH15
pWVH117 was transformed into wild-type strain YMC10.
Allelic exchange was selected as described previously
[67,68], resulting in strain WCH15. The correct insertion
of the promoter cassette upstream of the glnB gene at
the wild-type chromosomal location in strain WCH15
was confirmed by Southern blot analysis (data not
shown).
Glutamine synthetase adenylylation assay
The growth of cells is described above. Harvesting and
preparation of hexadecyltrimethylammonium-ion treated
cells was carried out as described previously [32,33]. The
level of adenylylation state (n) of glutamine synthetase was
determined using the c-glutamyl transferase assay [69], per-
formed in microtitre plates, as described previously [33].
Quantification of the cellular P
II
*, GS and ATase
concentration
To measure the cellular P
II
*, GS and ATase concentrations,
10 mL of cell suspension was taken from the cultures after
the removal of ammonia. Cell suspensions were chilled on
ice and centrifuged. The cell pellet was stored at )80 °C.
Cell pellets were resuspended in 0.5 or 1 mL of H
2
O.
The protein concentration was measured according to the
modified Lowry method [70].
Quantification of P
II
*, GS and ATase was performed by
western blot analysis using a polyclonal GlnB antibody,
polyclonal GS antibody or polyclonal ATase antibody,
respectively. Cell suspensions were loaded onto a 15% (for
GlnB), 10% (GS) or 7.5% (ATase) acrylamide
SDS ⁄ PAGE mini gel (Bio-Rad, Hercules, CA, USA). Onto
each gel, six or seven different amounts, in the range 0 to
3 or 6 ng of protein, of purified GlnB, GS or ATase were
loaded together with the samples mentioned above. Cali-
bration solutions were made by diluting the GlnB, GS or
ATase stock solutions in 1 mgÆmL
)1
BSA. After electro-
phoresis, the gel was blotted using BioRad’s Trans Blot
Semidry Transfer Cell onto nitrocellulose and probed with
antibody. Bands were visualized using the ECL system
(Amersham Biosciences, Uppsala, Sweden) and MIN-R ⁄ H
or X-OMAT ⁄ AR films (Kodak, Bunschoten, the Nether-
lands), or Hyperfilm-MP (Amersham Biosciences). The
autoradiograms were scanned with the Scanjet IIcx (Hew-
lett Packard, Amstelveen, the Netherlands) with the aid of
the computer program deskscan ii. The intensity of the
P
II
*, GS or ATase bands on the scanned autoradiograms
were determined on a Macintosh computer using the
GlnB: ultrasensitive versus subtle control W. C. van Heeswijk et al.
3336 FEBS Journal 276 (2009) 3324–3340 ª 2009 The Authors Journal compilation ª 2009 FEBS
public domain NIH image program (developed at the US
National Institutes of Health and available at http://rsb.
info.nih.gov/nih-image/). A calibration curve for P
II
*, GS
and ATase, calculated with the computer program
sigmaplot (Jandel Scientific, San Rafael, CA, USA), was
normally fitted using the equation
y ¼
mx
n
ðx
n
þ k
n
Þ
ð1Þ
where y is the integrated intensity, x the amount of P
II
*,
GS or ATase and m, n and k are the fitting parameters.
Calibration curves for P
II
* or GS from different gels were
not averaged.
The cellular P
II
* concentration was taken as the mean of
measured P
II
* concentration from each culture induced
with the same IPTG concentration. We calculated the con-
centration of P
II
* as described because we assume that the
error in the quantification of P
II
* by western blot analysis
is probably larger than the real difference in P
II
* induced
by the same IPTG concentration in independent cultures
after steady-state growth. Therefore, we correlated the
mean of P
II
* with the average of the corresponding variable
(of cultures containing the same IPTG concentration),
rather than making a correlation of a measured variable
and P
II
* of individual cultures.
Quantification of the uridylylation state of P
II
*
The cell extracts used to measure the percentage of P
II
*–
UMP ⁄ P
II
*
total
were the same as those used to measure the
GS adenylylation state, as described above. Aliquots of cell
extracts were loaded onto a SDS ⁄ Tricine gel as described
previously [33]. Semidry blotting, probing and visualization
of (uridylylated) P
II
* was performed as described previ-
ously [33]. Scanning of the autoradiograms and the deter-
mination of intensity of the P
II
* and P
II
*–UMP bands
were as described above. Some gels did not result in
a complete separation of the uridylylated and native P
II
*
forms. In that case, the integrated density of the two bands
was fitted with an equation containing two Gaussian
functions using the computer program sigmaplot (Jandel
Scientific).
Calculations
The measured values of the GS adenylylation state (n)as
function of time (t) were fitted with the equation
n ¼ðma À miÞ 1 À
t
a
ðt
a
þ k
a
Þ
ð2Þ
using the computer program mathcad (MathSoft Inc.,
Cambridge, MA, USA). The fitted parameters were
mi (minimal n value), ma (maximal n value), k and a. The
time in the inflection point
d
2
n
dt
2
¼ 0 ð3Þ
was calculated as
t ¼
ða À 1Þk
a
ða þ 1Þ
1
a
ðÞ
ð4Þ
This equation incorporated in the solution of dn ⁄ dt resulted
in the GS–AMP deadenylylation rate per GS-dodecamer
(v
n
) in the inflection point:
m
n
¼
1
4ka
ðma À miÞða À 1Þ
1À
1
a
ðÞ
ða þ 1Þ
1þ
1
a
ðÞ
ð5Þ
The response coefficient of the GS–AMP deadenylylation
rate per GS-dodecamer with respect to P
II
* was calculated
as
R
m
n
PII
Ã
¼
dm
n
dPII
Ã
PII
Ã
m
n
ð6Þ
The cellular GS–AMP deadenylylation rate was calculated
as
m
GS
total
¼
m
n
½GS
total
12
ð7Þ
with [GS
total
] the measured total GS concentration.
The measured values of the fractional uridylylation state
pu ¼
PII
Ã
À UMP
PII
Ã
total
ð8Þ
as function of time (t) were fitted with the equation
pu ¼ A þ Be
Àkt
ð9Þ
using the computer program sigmaplot (Jandel Scientific).
A, B and k are fitting parameters. The initial uridylylation
rate was calculated as
d½ PII
Ã
UMP
dt
¼ x ¼ÀkB½PII
Ã
total
ð10Þ
Response coefficient of the initial uridylylation rate with
respect to P
II
* was calculated as
R
x
PII
Ã
¼
dx
dPII
Ã
PII
Ã
x
ð11Þ
The transient deadenylylation reaction, as shown in
Fig. 3A, is a result of two reactions operating at the same
time: the activator GlnB–UMP necessary for the deadenyly-
lation activity of ATase is produced during the deadenyly-
lation reaction. Consequently, the cellular GlnB–UMP
concentration is not constant during the deadenylylation
reaction. Therefore, it was not possible to fit the data
points using a mechanism-based equation, and a simple sig-
moid function was used. A disadvantage of using the latter
is that the parameters obtained with the fitting procedure
W. C. van Heeswijk et al. GlnB: ultrasensitive versus subtle control
FEBS Journal 276 (2009) 3324–3340 ª 2009 The Authors Journal compilation ª 2009 FEBS 3337
do not have a physical meaning. The advantage is that the
conclusions of these experiments did not depend on the
fitting procedure. The rates were also calculated using other
fitting functions and by using the described fitting function
20 or 30 s after the removal of ammonia rather than
for the inflection point of the curve. This did not change
Figs 3B and 5B qualitatively. Another consequence of
GlnB–UMP production during the deadenylylation reaction
is that the variable at the abscissa of Figs 3B and 5B
cannot quite be taken to represent P
II
*–UMP (instead of
induced P
II
*), even though the rates were calculated for
the inflection point of the different curves at which the
uridylylation of P
II
* was almost complete (Figs 6 and 7).
Additional kinetic experiments should remove this lack
of clarity.
Acknowledgements
We thank Drs Peter R. Jensen, F. Cornet and Daniel
Kahn for plasmids and discussions. This work was
supported, in part, by the Netherlands Organization
for Scientific Research (NWO), European Union FP6
and FP7 programs (BioSim, EC-MOAN, YSBN, UNI-
CELLSYS), the transnational SYSMO programme
and the BBSRC.
References
1 Chock PB & Stadtman ER (1977) Superiority of inter-
convertible enzyme cascades in metabolite regulation:
analysis of multicyclic systems. Proc Natl Acad Sci
USA 74, 2766–2770.
2 Stadtman ER & Chock PB (1977) Superiority of inter-
convertible enzyme cascades in metabolic regulation:
analysis of monocyclic systems. Proc Natl Acad Sci
USA 74, 2761–2765.
3 Goldbeter A & Koshland DE Jr (1981) An amplified
sensitivity arising from covalent modification in biologi-
cal systems. Proc Natl Acad Sci USA 78, 6840–6844.
4 Goldbeter A & Koshland DE Jr (1984) Ultrasensitivity
in biochemical systems controlled by covalent modifica-
tion. Interplay between zero-order and multistep effects.
J Biol Chem 259, 14441–14447.
5Ca
´
rdenas ML & Cornish-Bowden A (1989) Characteris-
tics necessary for an interconvertible enzyme cascade to
generate a highly sensitive response to an effector.
Biochem J 257, 339–345.
6 Small JR & Fell DA (1990) Covalent modification and
metabolic control analysis. Modification to the theo-
rems and their application to metabolic systems con-
taining covalently modifiable enzymes. Eur J Biochem
191, 405–411.
7 Szedlacsek SE, Ca
´
rdenas ML & Cornish-Bowden A
(1992) Response coefficients of interconvertible enzyme
cascades towards effectors that act on one or both mod-
ifier enzymes. Eur J Biochem 204, 807–813.
8 Ortega F, Ehrenberg M, Acerenza L, Westerhoff HV,
Mas F & Cascante M (2002) Sensitivity analysis of met-
abolic cascades catalyzed by bifunctional enzymes. Mol
Biol Rep 29, 211–215.
9 Ortega F, Acerenza L, Westerhoff HV, Mas F & Casc-
ante M (2002) Product dependence and bifunctionality
compromise the ultrasensitivity of signal transduction
cascades. Proc Natl Acad Sci USA 99, 1170–1175.
10 Kacser H & Burns JA (1973) The control of flux. Symp
Soc Exp Biol 27, 65–104.
11 Heinrich R & Rapoport TA (1974) A linear steady-state
treatment of enzymatic chains. General properties, con-
trol and effector strength. Eur J Biochem 42, 89–95.
12 Fell DA (1992) Metabolic control analysis: a survey of
its theoretical and experimental development. Biochem J
286, 313–330.
13 Groen AK, Wanders RJ, Westerhoff HV, van der Meer
R & Tager JM (1982) Quantification of the contribution
of various steps to the control of mitochondrial respira-
tion. J Biol Chem 257, 2754–2757.
14 Jensen PR, Michelsen O & Westerhoff HV (1993) Con-
trol analysis of the dependence of Escherichia coli physi-
ology on the H
+
-ATPase. Proc Natl Acad Sci USA 90,
8068–8072.
15 Jensen PR, Westerhoff HV & Michelsen O (1993)
Excess capacity of H
+
-ATPase and inverse respiratory
control in Escherichia coli. EMBO J 12, 1277–1282.
16 Kahn D & Westerhoff HV (1991) Control theory of
regulatory cascades. J Theor Biol 153, 255–285.
17 Ninfa AJ, Jiang P, Atkinson MR & Peliska JA (2000)
Integration of antagonistic signals in the regulation of
nitrogen assimilation in Escherichia coli. Curr Top Cell
Regul 36, 31–75.
18 Ninfa AJ & Jiang P (2005) PII signal transduction pro-
teins: sensors of alpha-ketoglutarate that regulate nitro-
gen metabolism. Curr Opin Microbiol 8, 168–173.
19 Reitzer LJ (1996) Ammonia assimilation and the bio-
synthesis of glutamine, glutamate, aspartate, asparagine,
l-alanine, and d-alanine. In Escherichia coli and Salmo-
nella. Cellular and Molecular Biology (Neidhardt FC,
Curtiss R III, Ingraham JL, Lin ECC, Low KB, Maga-
sanik B, Reznikoff WS, Riley M, Schaechter M &
Umbarger HE, eds), pp. 391–407. American Society for
Microbiology, Washington, DC.
20 Prusiner S & Stadtman ER (eds) (1973) The Enzymes of
Glutamine Metabolism. Academic Press, New York, NY.
21 Almassy RJ, Janson CA, Hamlin R, Xuong NH &
Eisenberg D (1986) Novel subunit–subunit interactions
in the structure of glutamine synthetase. Nature 323,
304–309.
22 Jiang P, Mayo AE & Ninfa AJ (2007) Escherichia coli
glutamine synthetase adenylyltransferase (ATase, EC
2.7.7.49): kinetic characterization of regulation by PII,
GlnB: ultrasensitive versus subtle control W. C. van Heeswijk et al.
3338 FEBS Journal 276 (2009) 3324–3340 ª 2009 The Authors Journal compilation ª 2009 FEBS
PII-UMP, glutamine, and a-ketoglutarate. Biochemistry
46, 4133–4146.
23 Jaggi R, van Heeswijk WC, Westerhoff HV, Ollis DL &
Vasudevan SG (1997) The two opposing activities of
adenylyl transferase reside in distinct homologous
domains, with intramolecular signal transduction.
EMBO J 16, 5562–5571.
24 Jiang P, Pioszak AA & Ninfa AJ (2007) Structure–func-
tion analysis of glutamine synthetase adenylyltransferase
(ATase, EC 2.7.7.49) of Escherichia coli. Biochemistry
46, 4117–4132.
25 Clancy P, Xu Y, van Heeswijk WC, Vasudevan SG &
Ollis DL (2007) The domains carrying the opposing
activities in adenylyltransferase are separated by a cen-
tral regulatory domain. FEBS J 274, 2865–2877.
26 Jiang P, Peliska JA & Ninfa AJ (1998) Enzymological
characterization of the signal-transducing uridylyltrans-
ferase ⁄ uridylyl-removing enzyme (EC 2.7.7.59) of
Escherichia coli and its interaction with the PII protein.
Biochemistry 37, 12782–12794.
27 Vasudevan SG, Gedye C, Dixon NE, Cheah E, Carr
PO, Suffolk PM, Jeffrey PD & Ollis DL (1994) Escheri-
chia coli P
II
protein: purification, crystallization and
oligomeric structure. FEBS Lett 337, 255–258.
28 Cheah E, Carr PD, Suffolk PM, Vasudevan SG, Dixon
NE & Ollis DL (1994) Structure of the Escherichia coli
signal transducing protein P
II
. Structure 2, 981–990.
29 Kamberov ES, Atkinson MR & Ninfa AJ (1995) The
Escherichia coli PII signal transduction protein is acti-
vated upon binding 2-ketoglutarate and ATP. J Biol
Chem 270, 17797–17807.
30 Keener J & Kustu S (1988) Protein kinase and phos-
phoprotein phosphatase activities of nitrogen regulatory
proteins NTRB and NTRC of enteric bacteria: roles of
the conserved amino-terminal domain of NTRC. Proc
Natl Acad Sci USA 85, 4976–4980.
31 Jiang P, Peliska JA & Ninfa AJ (1998) Reconstitution
of the signal-transduction bicyclic cascade responsible
for the regulation of Ntr gene transcription in Escheri-
chia coli. Biochemistry 37, 12795–12801.
32 van Heeswijk WC, Stegeman B, Hoving S, Molenaar
D, Kahn D & Westerhoff HV (1995) An additional P
II
in Escherichia coli: a new regulatory protein in the glu-
tamine synthetase cascade. FEMS Microbiol Lett 132,
153–157.
33 van Heeswijk WC, Hoving S, Molenaar D, Stegeman
B, Kahn D & Westerhoff HV (1996) An alternative P
II
protein in the regulation of glutamine synthetase in
Escherichia coli. Mol Microbiol 21, 133–146.
34 Atkinson MR & Ninfa AJ (1999) Characterization of
the GlnK protein of Escherichia coli. Mol Microbiol 32,
301–313.
35 Xu Y, Cheah E, Carr PD, van Heeswijk WC, Wester-
hoff HV, Vasudevan SG & Ollis DL (1998) GlnK, a
PII-homologue: structure reveals ATP binding site and
indicates how the T-loops may be involved in molecular
recognition. J Mol Biol 282, 149–165.
36 Atkinson MR, Blauwkamp TA, Bondarenko V, Studit-
sky V & Ninfa AJ (2002) Activation of the glnA, glnK,
and nac promoters as Escherichia coli undergoes the
transition from nitrogen excess growth to nitrogen star-
vation. J Bacteriol 184, 5358–5363.
37 Lutz R & Bujard H (1997) Independent and tight regu-
lation of transcriptional units in Escherichia coli via the
LacR ⁄ O, the TetR ⁄ O and AraC ⁄ I
1
–I
2
regulatory ele-
ments. Nucleic Acids Res 25, 1203–1210.
38 Mu
¨
ller-Hill B (1975) Lac repressor and lac operator.
Prog Biophys Mol Biol 30, 227–252.
39 Calos MP & Miller JH (1981) The DNA sequence
change resulting from the IQ1 mutation, which greatly
increases promoter strength. Mol Gen Genet 183, 559–
560.
40 Jensen PR, Westerhoff HV & Michelsen O (1993) The
use of lac-type promoters in control analysis. Eur J Bio-
chem 211, 181–191.
41 Maheswaran M & Forchhammer K (2003) Carbon-
source-dependent nitrogen regulation in Escherichia coli
is mediated through glutamine-dependent GlnB signal-
ling. Microbiology 149, 2163–2172.
42 van Heeswijk WC, Rabenberg M, Westerhoff HV &
Kahn D (1993) The genes of the glutamine synthetase
adenylylation cascade are not regulated by nitrogen in
Escherichia coli. Mol Microbiol 9, 443–457.
43 Javelle A, Severi E, Thornton J & Merrick M (2004)
Ammonium sensing in Escherichia coli. Role of the
ammonium transporter AmtB and AmtB–GlnK com-
plex formation. J Biol Chem 279, 8530–8538.
44 Senior PJ (1975) Regulation of nitrogen metabolism in
Escherichia coli and Klebsiella aerogenes: studies with the
continuous-culture technique. J Bacteriol 123, 407–418.
45 Atkinson MR, Kamberov ES, Weiss RL & Ninfa AJ
(1994) Reversible uridylylation of the Escherichia coli
PII signal transduction protein regulates its ability to
stimulate the dephosphorylation of the transcription
factor nitrogen regulator I (NRI or NtrC). J Biol Chem
269, 28288–28293.
46 Mutalik VK, Shah P & Venkatesh KV (2003) Allosteric
interactions and bifunctionality make the response of
glutamine synthetase cascade system of Escherichi-
a coli robust and ultrasensitive. J Biol Chem 278,
26327–26332.
47 Oliver SG (1996) From DNA sequence to biological
function. Nature 379, 597–600.
48 Teusink B, Baganz F, Westerhoff HV & Oliver S (1998)
Metabolic control analysis as a tool in the elucidation
of the function of novel genes. In Yeast Genome
Analysis. Methods in Microbiology, Vol. 26 (Tuite M &
Brown C, eds), Academic Press, New York, NY.
49 van Heeswijk WC, Wen D, Clancy P, Jaggi R, Ollis
DL, Westerhoff HV & Vasudevan SG (2000) The
W. C. van Heeswijk et al. GlnB: ultrasensitive versus subtle control
FEBS Journal 276 (2009) 3324–3340 ª 2009 The Authors Journal compilation ª 2009 FEBS 3339
Escherichia coli signal transducers PII (GlnB) and GlnK
form heterotrimers in vivo: fine tuning the nitrogen sig-
nal cascade. Proc Natl Acad Sci USA 97, 3942–3947.
50 Rhee SG, Chock PB & Stadtman ER (1989) Regulation
of Escherichia coli glutamine synthetase. Adv Enzymol
Relat Areas Mol Biol 62, 37–92.
51 Jiang P & Ninfa AJ (2007) Escherichia coli PII signal
transduction protein controlling nitrogen assimilation
acts as a sensor of adenylate energy charge in vitro.
Biochemistry 46, 12979–12996.
52 Ninfa AJ & Atkinson MR (2000) PII signal transduc-
tion proteins. Trends Microbiol 8, 172–179.
53 Commichau FM, Forchhammer K & Stu
¨
lke J (2006)
Regulatory links between carbon and nitrogen meta-
bolism. Curr Opin Microbiol 9, 167–172.
54 Forchhammer K, Hedler A, Strobel H & Weiss V
(1999) Heterotrimerization of PII-like signalling pro-
teins: implications for PII-mediated signal transduction
systems. Mol Microbiol 33, 338–349.
55 Son HS & Rhee SG (1987) Cascade control of Escheri-
chia coli glutamine synthetase. Purification and proper-
ties of PII protein and nucleotide sequence of its
structural gene. J Biol Chem 262, 8690–8695.
56 van der Vlag J, van’t Hof R, van Dam K & Postma
PW (1995) Control of glucose metabolism by the
enzymes of the glucose phosphotransferase system in
Salmonella typhimurium. Eur J Biochem 230, 170–182.
57 Brenchley JE & Magasanik B (1974) Mutants of Klebsi-
ella aerogenes lacking glutamate dehydrogenase. J Bac-
teriol 117, 544–550.
58 Neidhardt FC, Bloch PL & Smith DF (1974) Culture
medium for enterobacteria. J Bacteriol 119, 736–747.
59 Chang AC & Cohen SN (1978) Construction and char-
acterization of amplifiable multicopy DNA cloning
vehicles derived from the P15A cryptic miniplasmid.
J Bacteriol 134, 1141–1156.
60 Christie GE, Farnham PJ & Platt T (1981) Synthetic
sites for transcription termination and a functional
comparison with tryptophan operon termination sites
in vitro. Proc Natl Acad Sci USA 78, 4180–4184.
61 Jensen LB (1992) Biological containment of bacteria
designed for deliberate release. PhD Thesis, Technical
University of Denmark, Lyngby, Denmark.
62 Jensen LB, Ramos JL, Kaneva Z & Molin S (1993) A
substrate-dependent biological containment system for
Pseudomonas putida based on the Escherichia coli gef
gene. Appl Environ Microbiol 59, 3713–3717.
63 Herrero M, De Lorenzo V & Timmis KN (1990) Trans-
poson vectors containing non-antibiotic resistance selec-
tion markers for cloning and stable chromosomal
insertion of foreign genes in Gram-negative bacteria.
J Bacteriol 172, 6557–6567.
64 Liu J & Magasanik B (1993) The
glnB region of the
Escherichia coli chromosome. J Bacteriol 175, 7441–
7449.
65 He B, Choi KY & Zalkin H (1993) Regulation of Esc-
herichia coli glnB, prsA, and speA by the purine repres-
sor. J Bacteriol 175, 3598–3606.
66 Cornet F, Mortier I, Patte J & Louarn JM (1994) Plas-
mid pSC101 harbors a recombination site, psi, which is
able to resolve plasmid multimers and to substitute for
the analogous chromosomal Escherichia coli site dif.
J Bacteriol 176, 3188–3195.
67 Hamilton CM, Aldea M, Washburn BK, Babitzke P &
Kushner SR (1989) New method for generating dele-
tions and gene replacements in Escherichia coli. J Bacte-
riol 171, 4617–4622.
68 Blomfield IC, Vaughn V, Rest RF & Eisenstein BI
(1991) Allelic exchange in Escherichia coli using the
Bacillus subtilis sacB gene and a temperature-sensitive
pSC101 replicon. Mol Microbiol 5, 1447–1457.
69 Stadtman ER, Smyrniotis PZ, Davis JN & Wittenberger
ME (1979) Enzymic procedures for determining the
average state of adenylylation of Escherichia coli gluta-
mine synthetase. Anal Biochem 95, 275–285.
70 Markwell MA, Haas SM, Bieber LL & Tolbert NE
(1978) A modification of the Lowry procedure to sim-
plify protein determination in membrane and lipopro-
tein samples. Anal Biochem 87, 206–210.
71 Chen YM, Backman K & Magasanik B (1982) Charac-
terization of a gene, glnL, the product of which is
involved in the regulation of nitrogen utilization in Esc-
herichia coli. J Bacteriol 150, 214–220.
72 Bueno R, Pahel G & Magasanik B (1985) Role of glnB
and glnD gene products in regulation of the glnALG
operon of Escherichia coli. J Bacteriol 164, 816–822.
GlnB: ultrasensitive versus subtle control W. C. van Heeswijk et al.
3340 FEBS Journal 276 (2009) 3324–3340 ª 2009 The Authors Journal compilation ª 2009 FEBS