Báo cáo khoa học: Microarray analyses of hypoxia-regulated genes in an aryl hydrocarbon receptor nuclear translocator (Arnt)-dependent manner ppt
Bạn đang xem bản rút gọn của tài liệu. Xem và tải ngay bản đầy đủ của tài liệu tại đây (370.34 KB, 17 trang )
Microarray analyses of hypoxia-regulated genes
in an aryl hydrocarbon receptor nuclear translocator
(Arnt)-dependent manner
Su Mi Choi*, Hookeun Oh* and Hyunsung Park
Department of Life Science, University of Seoul, South Korea
Keywords
Arnt; gene expression; HIF; hypoxia;
microarray
Correspondence
H. Park, Department of Life Science,
University of Seoul, 90 Jeonnong-dong,
Dongdaemun-gu, Seoul 130-743, South
Korea
Fax: +82 2 2210 2888
Tel: +82 2 2210 2622
E-mail:
*These authors made equal contributions to
this study
(Received 17 July 2008, revised
12 September 2008, accepted 17
September 2008)
doi:10.1111/j.1742-4658.2008.06686.x
We investigated hypoxia-inducible factor (HIF)-dependent changes in the
expression of 5592 genes in response to hypoxia (0.1% O
2
, 16 h) by per-
forming cDNA microarray analyses of mouse hepa1c1c7 and BpRc1 cells.
BpRc1 cells are a hepa1c1c7 variant defective in HIF-b ⁄ aryl hydrocarbon
receptor nuclear translocator (Arnt), and are therefore unable to induce
HIF target genes in response to hypoxia. By comparing hepa1c1c7 cells
with BpRc1 cells, we were able to investigate hypoxia-regulated gene
expression as well as the role played by HIF in regulating the hypoxic-
dependent response of gene expression. This study identified 50 hypoxia-
induced genes and 36 hypoxia-repressed genes. Quantitative PCR analysis
of nine genes confirmed our ability to accurately analyze changes in
hypoxia-induced gene expression by microarray analysis. By comparing
quantitative PCR analyses of these nine genes in BpRc1 and hepa1c1c7
cells, we determined that eight of the nine hypoxia-induced genes are Arnt
dependent. Additional quantitative PCR analyses of eight hypoxia-
repressed genes confirmed, with a 50% probability, that microarray analy-
sis was able to predict hypoxia-repressed gene expression. Only two of the
four confirmed genes were found to be repressed in an Arnt-dependent
manner. Collectively, six of these 13 genes (46.2% probability) showed a
pattern of expression consistent with the microarray analysis with regard to
Arnt dependence. Finally, we investigated the HIF-1a dependence of these
13 genes by quantitative PCR analysis in HIF-1a knockdown 3T3-L1 cells.
These analyses identified novel hypoxia-regulated genes and confirmed
the role of Arnt and HIF-1a in regulating their expression. These results
identify additional HIF target genes and provide a more complete
understanding of hypoxia signaling.
Abbreviations
ABCC3, ATP-binding cassette, subfamily C (CFTR ⁄ MRP), member 3; Arnt, aryl hydrocarbon receptor (AhR) nuclear translocator; ATF-4,
activating transcription factor-4; bHLH, basic helix–loop–helix; BNIP3, BCL-2 ⁄ adenovirus E1B 19 kDa-interacting protein 3; BSG, basigin;
CCGN2, cyclin G2; DUSP12, dual specificity phosphatase 12; eIF1, eukaryotic translation initiation factor 1; ER, endoplasmic reticulum; FDR,
false discovery rate; FKBP4, FK506 binding protein 4 (59 kDa); GNA11, guanine nucleotide binding protein, a 11; HIF, hypoxia-inducible
factor; HSP60, heat shock protein, 60 kDa; IER3, immediate early response 3; MAD2L1, MAD2 (mitotic arrest deficient, homolog)-like 1
(yeast); MAPK, mitogen-activated protein kinase; MKP-1, mitogen-activated protein kinase phosphatase-1; MMP, matrix metalloproteinase;
NDR1, N-myc downstream regulated 1; P4HA1, procollagen-proline, 2-oxoglutarate 4-dioxygenase (proline 4-hydroxylase), a1 polypeptide;
PAS, Per-Arnt-Sim; PERK, PKR-like ER kinase; PPAR, peroxisome proliferators-activated receptor; PSMA3, proteasome (prosome,
macropain) subunit, a type 3; PTPN16, protein tyrosine phosphatase, non-receptor type 16; SFRS3, splicing factor, arginine ⁄ serine-rich 3
(SRp20); shRNA, short hairpin RNA; SUI1-RS1, suppressor of initiator codon mutations, related sequence 1; VEGF, vascular endothelial
growth factor.
5618 FEBS Journal 275 (2008) 5618–5634 ª 2008 The Authors Journal compilation ª 2008 FEBS
Cellular oxygen is an important regulatory stimulus
for many physiological and pathological processes.
Mammalian cells adapt to hypoxia by inducing the
expression of genes involved in anaerobic metabolism,
oxygen delivery and cell survival. These diverse target
genes are induced by a common heterodimeric
transcription factor: hypoxia-inducible factor-a ⁄ b
(HIF-a ⁄ b) [1–4]. The HIF-a and HIF-b subunits belong
to the basic helix–loop–helix (bHLH)-Per-Arnt-Sim
(PAS) protein family. HIF-a is rapidly degraded in
normoxic cells, whereas HIF-b, also known as Arnt
(aryl hydrocarbon receptor nuclear translocator), is con-
stitutively expressed. Under hypoxic conditions, HIF-a
is stabilized and translocates into the nucleus, where it
forms a heterodimer with the nuclear protein Arnt.
Structural analyses of bHLH-PAS proteins have deter-
mined that interaction between the HLH-PAS domains
of each subunit mediates dimerization between HIF-a
and HIF-b, and that individual basic regions from
each protein interact with their corresponding DNA
elements. Therefore, dimerization of bHLH-PAS
proteins is required for DNA binding [5].
The stability and activity of the a subunit are inhib-
ited by post-translational modification, specifically by
hydroxylation. HIF-a hydroxylation is catalyzed by
HIF-a-specific proly-4-hydroxylase 2 and HIF-a-spe-
cific asparaginyl-hydroxylase, which utilize molecular
oxygen and a-ketoglutarate as cosubstrates. The
hydroxylated proline residues (human HIF-1a Pro402
and Pro564) are recognized by the E3 ubiquitin ligase,
a von Hippel–Lindau protein which mediates HIF-1a
polyubiquitination and degradation by the 26S protea-
some [6,7]. The hydroxylation of the human HIF-1a
asparagine residue 803 prevents HIF-a from recruiting
the CBP ⁄ p300 coactivator. A lack of oxygen has been
shown to reduce the activities of these two oxygen-
dependent hydroxylases, resulting in the stabilization
of the transactive form of HIF-1a [8,9].
HIF-1a was the first HIF-a isoform identified by
affinity purification, and HIF-2a (endothelial PAS
domain-containing protein 1) was later identified
through an homology search [10]. Both HIF-1a and
HIF-2a form functional heterodimers with Arnt.
Although knockout mice experiments have shown that
HIF-1a and HIF-2a have unique functions and are non-
redundant [11], no HIF-2a-specific target genes have
been identified. HIF-1a and HIF-2a share a number of
target genes, but HIF-1a appears to be the predominant
form responsible for the induction of target genes [12].
Arnt was originally identified as a partner protein of
aryl hydrocarbon receptor (AhR). Similar to Arnt,
AhR also contains a bHLH-PAS domain at its N-ter-
minal domain. Dioxin, an environmental pollutant, is
the most potent ligand for AhR. Once bound to
ligand, cytosolic AhR translocates into the nucleus and
forms a heterodimer with Arnt. Therefore, Arnt is a
binding partner for both HIF-a and AhR [13,14]. Pre-
vious studies by Miller and Whitlock [15] led to the
isolation of variant mouse hepa1c1c7 cell lines that
lose responsiveness to dioxin using benzo(a)pyrene
selection and fluorescence-activated cell sorting. One of
the variant cell lines, BpRc1, has normal AhR, but is
defective in the nuclear localization of AhR. Arnt
transfection can complement this defect in BpRc1 cells,
indicating that these variant cells are defective in Arnt
[16,17]. As Arnt is also required for the hypoxic induc-
tion of HIF target genes, BpRc1 cells are also unre-
sponsive to hypoxia, even in the presence of HIF-a.
Several studies have shown the role of Arnt in the
basal expression of genes [18–20]. Here, we emphasize
the role of Arnt, especially in the hypoxic responses of
gene expression. By performing cDNA microarray
analyses of hypoxic hepa1c1c7 cells and BpRc1 cells,
we identified both hypoxia-regulated genes and their
Arnt dependence. In addition, using HIF-1a knock-
down cells, we investigated whether HIF-1a is required
for the hypoxic responses of the identified genes.
Results
Microarray analyses of hypoxia-regulated gene
expression
We analyzed the changes in the expression of 5592
genes in response to hypoxic exposure (0.1% O
2
,16h)
using Mouse 6K cDNA chips (TwinChipÔ Mouse-6K)
from Digital Genomics Inc. (Seoul, South Korea).
Mouse hepa1c1c7 and BpRc1 cells were exposed to
hypoxia or normoxia (20% O
2
) for 16 h prior to RNA
isolation and subsequent cDNA microarray analysis.
Four replicates were performed for each cell type using
twin chips that incorporated dye-reversed hybridiza-
tion. Comparison of hepa1c1c7 and BpRc1 cells
enabled us to investigate hypoxia-regulated gene
expression, as well as the role played by HIF in the
regulation of the hypoxic response. Based on our anal-
yses of 5592 genes, we selected statistically relevant
genes with q values less than 0.1 for further analysis;
420 and 565 genes were selected from the analyses of
hepa1c1c7 and BpRc1 cells, respectively. Of these
genes, 259 demonstrated q values of less than 0.1 in
both analyses. From the 259 genes, we selected
hypoxia-induced genes that demonstrated a greater
than 1.5-fold induction; 50 and 40 genes were selected
from the analyses of hepa1c1c7 and BpRc1 cells,
respectively (Tables 1 and S1). In addition, we selected
S. M. Choi et al. Arnt-dependent gene expression in hypoxia
FEBS Journal 275 (2008) 5618–5634 ª 2008 The Authors Journal compilation ª 2008 FEBS 5619
Table 1. Hypoxia-induced genes identified by microarray analyses.
GenBank
accession
number
Gene
symbol Gene name
WT cells BpRc1 cells
Fold
a
q value
b
Fold
a
q value
b
Genes induced by hypoxia in both wild-type and BpRc1 cells
AI956848 BNIP3
c
BCL2 ⁄ adenovirus E1B 19 kDa-interacting protein 3, NIP3 8.523 0.005 8.956 0.003
AI325917 PTPN16
c
Protein tyrosine phosphatase, non-receptor type 16 6.409 0.005 2.264 0.003
AI852322 MRPS22 Mitochondrial ribosomal protein S22 6.138 0.005 3.364 0.003
AI852317 NDR1
c
N-myc downstream regulated 1 4.684 0.005 2.534 0.003
AI323719 SUI1-RS1
c
Suppressor of initiator codon mutations, related sequence 1
(Saccharomyces cerevisiae)
3.628 0.005 1.695 0.003
AI853078 H2AFY H2A histone family, member Y 3.624 0.005 3.311 0.003
AI451894 CCNG2
c
Cyclin G2 3.094 0.005 1.934 0.003
AI450411 VEGF
c
Vascular endothelial growth factor 2.933 0.005 1.573 0.003
AI415663 – RIKEN cDNA 2700038M07 gene 2.592 0.005 1.542 0.003
AI415726 – DNA segment, Chr 7, ERATO Doi 458, expressed 2.425 0.005 1.888 0.003
AI413228 – Mus musculus, clone MGC:18904 IMAGE:4240711, mRNA,
complete cds
2.168 0.005 1.637 0.003
AI839114 SQSTM1 Sequestosome 1 2.076 0.005 2.691 0.003
AI853170 ANP32 Acidic nuclear phosphoprotein 32 2.052 0.005 1.654 0.007
AI504706 – ESTs, weakly similar to hair mouse hairless protein
(M. musculus)
2.022 0.005 1.845 0.003
AI528680 TIEG TGFB inducible early growth response 2.018 0.005 1.706 0.003
AI843944 IGH-4 Immunoglobulin heavy chain 4 (serum IgG1) 1.982 0.005 1.697 0.003
AI843941 – RIKEN cDNA 0610012D09 gene 1.891 0.005 1.599 0.003
AI415729 – ESTs, moderately similar to sylm_human probable leucyl-tRNA
synthetase, mitochondrial precursor (Homo sapiens)
1.846 0.007 1.608 0.003
AW321053 AIRAP Arsenite inducible RNA-associated protein (Airap) 1.682 0.013 2.602 0.003
AI326954 XTRP2 X transporter protein 2 1.648 0.014 1.789 0.067
AW411617 – RIKEN cDNA 1810015C04 gene 1.566 0.010 2.051 0.003
AI838844 LYNX1 Ly6 ⁄ neurotoxin 1 1.540 0.005 1.761 0.003
AI839365 PLD3 Phospholipase D3 1.520 0.005 1.729 0.003
Genes induced by hypoxia in wild-type cells
AI842086 BSG
c
Basigin 4.311 0.005 1.232 0.091
AI323613 INPP5D Inositol polyphosphate-5-phosphatase, 145 kDa 3.271 0.005 1.357 0.072
AI842506 P4HB Prolyl 4-hydroxylase, beta polypeptide 2.641 0.005 1.318 0.067
AI448103 MDM2 Transformed mouse 3T3 cell double minute 2 2.355 0.005 1.431 0.005
AI841020 PGK1 Phosphoglycerate kinase 1 2.306 0.005 1.460 0.003
AI853802 PFKP Phosphofructokinase, platelet 2.196 0.005 1.282 0.072
AI323680 IER3
c
Immediate early response 3 2.146 0.005 1.305 0.072
AI323453 P4HA1
c
Procollagen-proline, 2-oxoglutarate 4-dioxygenase
(proline 4-hydroxylase), a1 polypeptide
2.143 0.005 1.373 0.005
AI848411 BTG1 B-cell translocation gene 1, anti-proliferative 2.056 0.005 1.216 0.072
AI451895 RPGRIP1 Retinitis pigmentosa GTPase regulator interacting protein 1 1.838 0.005 1.269 0.051
AI452157 – ESTs, weakly similar to the KIAA0146 gene product is novel
(H. sapiens)
1.837 0.005 1.427 0.005
AI448042 – Expressed sequence AI448042 1.699 0.007 1.430 0.003
AI835435 GPI1 Glucose phosphate isomerase 1 complex 1.687 0.005 1.375 0.005
AI842276 B3GALT2 UDP-Gal:betaGlcNAc beta 1,3-galactosyltransferase, polypeptide 2 1.666 0.005 1.323 0.016
AI842546 NBR1 Next to the Brca1 1.648 0.005 1.450 0.007
AI528519 C3 Complement component 3 1.647 0.007 1.277 0.040
AI428079 – DNA segment, Chr 1, ERATO Doi 101, expressed 1.626 0.005 1.389 0.005
AI452183 – RIKEN cDNA 4930423K06 gene 1.607 0.005 1.332 0.017
AI452214 – Expressed sequence AI452214 1.591 0.005 1.330 0.014
AI415675 – Expressed sequence AI415675 1.587 0.010 1.411 0.007
AI850555 JUNB Jun-B oncogene 1.584 0.013 1.381 0.029
AI452202 – DNA segment, Chr 12, Wayne State University 95, expressed 1.577 0.005 1.273 0.012
AI448149 PARVA Parvin a 1.559 0.013 1.225 0.080
Arnt-dependent gene expression in hypoxia S. M. Choi et al.
5620 FEBS Journal 275 (2008) 5618–5634 ª 2008 The Authors Journal compilation ª 2008 FEBS
genes that were repressed in response to hypoxia and
that demonstrated a less than 0.6-fold induction; 36
and 40 genes were selected from the analysis of
hepa1c1c7 and BpRc1 cells, respectively (Tables S1
and 3). Compared with northern analyses or quantita-
tive real-time reverse transcription-polymerase chain
reaction (Q-PCR), we found that the cDNA micro-
array analyses underestimated the fold change of gene
expression. In order to take more genes into consider-
ation, we arbitrarily chose the values of 1.5- and
0.6-fold induction.
Genes that are induced by hypoxia
The 50 genes that demonstrated a greater than 1.5-
fold induction in hepa1c1c7 cells were considered to
be induced by hypoxia (Table 1). Of these 50 genes,
26 demonstrated a less than 1.5-fold induction in
BpRc1 cells, suggesting that these genes were induced
by hypoxia in an Arnt-dependent manner. The
remaining 24 genes demonstrated a greater than 1.5-
fold induction in both cell lines, suggesting that their
expression was regulated independent of Arnt. To
confirm these findings, nine of the 50 up-regulated
genes were selected for Q-PCR analysis. The fold
induction of each gene in both hepa1c1c7 and BpRc1
cells was analyzed by one-way analysis of variance
(ANOVA) (Table 2). Q-PCR analysis confirmed that
each of the nine genes [suppressor of initiator codon
mutations, related sequence 1 (SUI1-RS1), protein
tyrosine phosphatase, non-receptor type 16 (PTPN16),
N-myc downstream regulated 1 (NDR1), cyclin
G2 (CCNG2), vascular endothelial growth factor
(VEGF), BCL-2 ⁄ adenovirus E1B 19 kDa-interacting
protein 3 (BNIP3), basigin (BSG), immediate early
response 3 (IER3) and procollagen-proline, 2-oxoglut-
arate 4-dioxygenase (proline 4-hydroxylase), a1 poly-
peptide (P4HA1)] was induced by hypoxia with the
indicated fold and P value (P < 0.05) in hepa1c1c7
cells (Fig. 1 and Table 2). In contrast, Q-PCR analy-
ses demonstrated that, in BpRc1 cells, the induction
folds of eight genes (PTPN16, NDR1, CCNG2,
VEGF, BNIP3, BSG, IER3 and P4HA1) were signifi-
cantly lower, and their P values were greater than
Table 2. Hypoxia-induced gene expression analyzed by both microarray and Q-PCR. up, hypoxia-induced expression pattern, fold ‡ 1.5;
down, hypoxia-repressed expression pattern, fold < 0.6; nc, no change, 0.6 £ fold < 1.5; ns, not statistically significant, P value > 0.05;
), Arnt independent; +, Arnt dependent.
Gene
symbol
Microarray Q-PCR
WT cells BpRc1 cells
Arnt
dependence
WT cells BpRc1 cells
Arnt
dependence
Fold
a
q value
b
Fold
a
q value
b
Fold
a
P value Fold
a
P value
SUI1-RS1 3.63 up 0.005 1.70 up 0.003 ) 4.87 up 0.00024 2.65 up 0.00038 )
PTPN16 6.41 up 0.005 2.26 up 0.003 ) 107.10 up 0.00023 1.41 ns 0.91962 +
NDR1 4.68 up 0.005 2.53 up 0.003 ) 66.79 up 0.00023 2.18 ns 0.95664 +
CCNG2 3.09 up 0.005 1.93 up 0.003 ) 18.95 up 0.00023 1.18 ns 0.97169 +
VEGF 2.93 up 0.005 1.57 up 0.003 ) 20.33 up 0.00023 1.78 ns 0.67472 +
BNIP3 8.52 up 0.005 8.96 up 0.003 ) 16.34 up 0.00023 0.63 ns 0.99743 +
BSG 4.31 up 0.005 1.23 nc 0.091 + 4.36 up 0.00023 1.03 ns 0.98929 +
IER3 2.15 up 0.005 1.31 nc 0.072 + 14.68 up 0.00023 0.47 ns 0.80513 +
P4HA1 2.14 up 0.005 1.37 nc 0.005 + 16.83 up 0.00024 0.54 ns 0.64244 +
a
Fold: a ratio of expression in hypoxia ⁄ expression in normoxia.
b
q value: significant difference, false discovery rate (FDR), selected q
value < 0.1.
Table 1. Continued.
GenBank
accession
number
Gene
symbol Gene name
WT cells BpRc1 cells
Fold
a
q value
b
Fold
a
q value
b
AI642394 HK2 Hexokinase 2 1.523 0.005 1.333 0.014
AI324697 SNRPA Small nuclear ribonucleoprotein polypeptide A 1.519 0.025 1.449 0.005
a
Fold: a ratio of expression in hypoxia ⁄ expression in normoxia.
b
q value: significant difference, false discovery rate (FDR), selected q
value < 0.1.
c
Bold characters indicate genes that were further investigated by Q-PCR as reported in Fig. 1.
S. M. Choi et al. Arnt-dependent gene expression in hypoxia
FEBS Journal 275 (2008) 5618–5634 ª 2008 The Authors Journal compilation ª 2008 FEBS 5621
0.05, suggesting that hypoxia induced these eight
genes in an Arnt-dependent manner (Table 2). Fur-
thermore, Q-PCR analysis confirmed that SUI1-RS1
expression was significantly induced in both
hepa1c1c7 and BpRc1 cells, suggesting that expression
of SUI1-RS1 was regulated in an Arnt-independent
manner in response to hypoxia.
Based on these Q-PCR results, we were able to con-
firm the validity of our microarray analysis of
hypoxia-induced gene expression. Microarray analysis
demonstrated that six genes (SUI1-RS1, PTPN16,
NDR1, CCNG2, VEGF and BNIP3) were induced by
hypoxia in both wild-type and Arnt-defective cells, and
that an additional three genes (BSG, IER3 and
A
B
Hypoxia – + – +
Cell WT BpRc1
5
4
3
2
1
0
l
e
v e
l
A N R m e v i t a l e R
) S
8
1
/
G S B (
BSG mRNA
Hypoxia – + – +
Cell WT BpRc1
120
100
80
60
40
20
0
l e v
e l
A N R m e v i t a l e R
) S 8 1 / 6 1 N P T P (
PTPN16 mRNA
Hypoxia – + – +
Cell WT BpRc1
25
20
15
10
5
0
l e
v e l
A
N
R
m
e
v i
t
a
l e R
) S 8 1 / F G E V (
VEGF mRNA
+ Hypoxia – + – Hypoxia – + –
Cell WT BpRc1
25
20
15
10
5
0
l
e v
e
l
A
N R
m
e v i t
a l
e R
)
S
8 1 / 1
A H
4 P (
P4HA1 mRNA
Cell
Hypoxia – + – +
Cell WT BpRc1
6
5
4
3
2
1
0
l
e v e l
A
N R m e v i t a l e R
1 I U S ( - ) S 8 1 / 1 S R
SUI1 -RS1 mRNA
Hypoxia – + – +
Cell WT BpRc1
80
60
40
20
0
l e v e l A N R m e v i t a l e R
) S 8 1 / 1 R D N (
NDR1 mRNA
20
15
10
5
0
l e v e l A N R m e v i t a l e R
) S 8 1 / 2 G N C C (
CCNG2 mRNA
Hypoxia – + – +
Cell WT BpRc1
Hypoxia – + – +
Cell WT BpRc1
20
15
10
5
0
l e v
e l A N
R m e v i t a l e
R
)
S
8 1 / 3
P I
N B
(
BNIP3 mRNA
Hypoxia
Cell
– + – +
WT BpRc1
18
15
12
9
6
3
0
l
e
v e
l
A N
R
m
e
v i
t
a l
e R
) S 8 1 / 3
R
E I (
IER3 mRNA
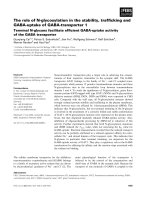
Fig. 1. mRNA levels of hypoxia-induced genes analyzed by Q-PCR. (A, B) Wild-type (WT) hepa1c1c7 cells and BpRc1 cells were incubated
in hypoxic conditions for 16 h. Total RNA was isolated and quantified by Q-PCR. 18S rRNA expression levels were used for normalization.
Values are presented as the average ± standard deviation of three independent experiments. Statistical analysis of the Q-PCR data was
evaluated using one-way ANOVA.
Arnt-dependent gene expression in hypoxia S. M. Choi et al.
5622 FEBS Journal 275 (2008) 5618–5634 ª 2008 The Authors Journal compilation ª 2008 FEBS
P4HA1) were not induced in Arnt-deficient cells. How-
ever, Q-PCR analysis indicated that, with the excep-
tion of SUI1-RS1, eight of the nine genes were found
to be induced by hypoxia in an Arnt-dependent man-
ner. Therefore, only four of these genes (SUI1-RS1,
BSG, IER3 and P4HA1) showed a consistent expres-
sion pattern in both Q-PCR and microarray analyses,
indicating that our microarray analysis was able to
predict Arnt-dependent expression of each gene in
response to hypoxia with a 44.5% (4 ⁄ 9) probability.
Genes that are repressed by hypoxia
The 36 genes that demonstrated a fold induction of
less than 0.6 were considered to be repressed by
hypoxia (Table 3). Of these, nine demonstrated a fold
induction between 0.6 and 1.5 in BpRc1 cells, suggest-
ing that they were repressed in an Arnt-dependent
manner. An additional 27 genes that demonstrated a
fold induction of less than 0.6 in both cell lines were
believed to be repressed in an Arnt-independent
Table 3. Hypoxia-repressed genes identified by microarray analyses.
GenBank
accession
number
Gene
symbol Gene name
WT cells BpRc1 cells
Fold
a
q value
b
Fold
a
q value
b
Genes repressed by hypoxia in wild-type cells
AI852475 HNRPD Heterogeneous nuclear ribonucleoprotein D 0.597 0.066 0.777 0.051
AI324252 MAD2L1
c
MAD2 (mitotic arrest deficient, homolog)-like 1 (yeast) 0.593 0.010 0.710 0.003
AI528620 GNA11
c
Guanine nucleotide binding protein, a 11 0.585 0.066 0.630 0.003
AI837705 FKBP4
c
FK506 binding protein 4 (59 kDa) 0.564 0.005 0.717 0.003
AI838039 HSP60
c
Heat shock protein, 60 kDa 0.545 0.005 0.757 0.007
AI843948 PSMA3
c
Proteasome (prosome, macropain) subunit, a type 3 0.537 0.014 0.744 0.012
AI528616 SFRS3
c
Splicing factor, arginine ⁄ serine-rich 3 (SRp20) 0.532 0.058 0.670 0.003
AI326810 – Expressed sequence AI326810 0.440 0.005 0.706 0.003
AI838959 ACTA2 Actin, a 2, smooth muscle, aorta 0.435 0.005 0.777 0.029
Genes repressed by hypoxia in both wild-type and BpRc1 cells
AI504950 ABCC3
c
ATP-binding cassette, sub-family C (CFTR ⁄ MRP), member 3 0.599 0.029 0.426 0.003
AW322036 KPNA2 Karyopherin (importin) a 2 0.595 0.013 0.418 0.003
AI325518 GSR Glutathione reductase 1 0.586 0.029 0.492 0.003
AI853888 HIRIP5 Histone cell cycle regulation defective interacting protein 5 0.577 0.005 0.590 0.003
AI482035 – RIKEN cDNA 2310044F10 gene 0.570 0.005 0.578 0.003
AI506703 – DNA segment, Chr 3, ERATO Doi 176, expressed 0.566 0.005 0.444 0.003
AI850361 BRAL1 Brain link protein 1 0.559 0.005 0.550 0.003
AI481173 – RIKEN cDNA 2700033I16 gene 0.557 0.005 0.334 0.003
AI481688 – RIKEN cDNA 2310014B11 gene 0.546 0.005 0.365 0.003
AI326238 CRMP1 Collapsin response mediator protein 1 0.540 0.013 0.565 0.003
AI850889 CLDN11 Claudin 11 0.539 0.005 0.534 0.003
AI481596 DUSP12
c
Dual specificity phosphatase 12 0.529 0.005 0.372 0.003
AI837206 PTMA Prothymosin a 0.526 0.010 0.451 0.003
AI447856 – RIKEN cDNA 2610019N19 gene 0.505 0.005 0.485 0.003
AI447735 SH3YL1 Sh3 domain YSC-like 1 0.503 0.005 0.509 0.003
AI507479 – ESTs, moderately similar to Z277_human zinc finger
protein 277 (Homo sapiens)
0.489 0.005 0.439 0.003
AI853883 SHD src homology 2 domain-containing transforming protein D 0.484 0.005 0.471 0.003
AI482173 – RIKEN cDNA 1810013P09 gene 0.473 0.005 0.432 0.003
AI504862 – RIKEN cDNA 2610001M19 gene 0.470 0.005 0.336 0.003
AI504558 – Mus musculus, similar to hypothetical protein FLJ20174,
clone IMAGE:3595651, mRNA, partial cds
0.465 0.007 0.464 0.003
AI505978 – RIKEN cDNA 1200014N16 gene 0.463 0.005 0.502 0.003
AI447741 – RIKEN cDNA 1300018J18 gene 0.459 0.005 0.408 0.003
AI449639 – RIKEN cDNA 1300017J02 gene 0.445 0.007 0.414 0.003
AI481136 – Expressed sequence AI482555 0.405 0.005 0.321 0.003
AI448873 FLIZ1 Fetal liver zinc finger 1 0.290 0.005 0.220 0.003
AI447724 – Expressed sequence AI447724 0.235 0.005 0.284 0.003
a
Fold: a ratio of expression in hypoxia ⁄ expression in normoxia.
b
q value: significant difference, false discovery rate (FDR), selected q
value < 0.1.
c
Bold characters indicate genes that were further investigated by Q-PCR as reported in Fig. 2.
S. M. Choi et al. Arnt-dependent gene expression in hypoxia
FEBS Journal 275 (2008) 5618–5634 ª 2008 The Authors Journal compilation ª 2008 FEBS 5623
manner in response to hypoxia. To validate these
results, eight of the 36 genes [MAD2 (mitotic arrest
deficient, homolog)-like 1 (yeast) (MAD2L1), heat
shock protein, 60 kDa (HSP60), FK506 binding pro-
tein 4 (59 kDa) (FKBP4), proteasome (prosome,
macropain) subunit, a type 3 (PSMA3), guanine nucle-
otide binding protein, a 11 (GNA11), splicing factor,
arginine ⁄ serine-rich 3 (SRp20) (SFRS3), dual specific-
ity phosphatase 12 (DUSP12) and ATP-binding cas-
sette, subfamily C (CFTR ⁄ MRP), member 3 (ABCC3)]
were selected for Q-PCR (Fig. 2). Our analysis deter-
mined that four of the eight genes (MAD2L1, HSP60,
FKBP4 and PSMA3) were significantly repressed in
response to hypoxia as measured by Q-PCR analysis
(P < 0.05) in hepa1c1c7 cells (Fig. 2 and Table 4).
Based on these results, we were able to demonstrate
that our microarray analysis was able to predict
hypoxia-repressed gene expression with a 50% proba-
A
B
Hypoxia – + – +
Cell WT BpRc1
2.0
1.5
1.0
0.5
0
lev
el
A
N
RmevitaleR
)S81/2
1
PSUD(
DUSP12 mRNA
Hypoxia – + – +
Cell WT BpRc1
4
3
2
1
0
l
e
velAN
R
m
e
vi
t
al
eR
)
S
81/3CCBA
(
ABCC3 mRNA
Hypoxia – + – +
Cell WT BpRc1
2.5
2.0
1.5
1.0
0.5
0
levelANRmevitaleR
)S81/1L2DAM(
MAD2L1 mRNA
Hypoxia – + – +
Cell WT BpRc1
1.6
1.4
1.2
1.0
0.8
0.6
0.4
0.2
0
levelANRmev
i
taleR
)S81/3AMSP(
PSMA3 mRNA
Hypoxia
Cell
–+ –+
WT BpRc1
1.4
1.2
1.0
0.8
0.6
0.4
0.2
0
level
A
NRmevitaleR
)
S81/
1
1AN
G
(
GNA11 mRNA
Hypoxia – + – +
Cell WT BpRc1
1.2
1.0
0.8
0.6
0.4
0.2
0
levelAN
Rm
evit
ale
R
)S81/06PSH(
HSP60 mRNA
Hypoxia – + – +
Cell WT BpRc1
1.2
1.0
0.8
0.6
0.4
0.2
0
levelANRmevitaleR
)S8
1
/
4
P
BKF
(
FKBP4 mRNA
2.5
2.0
1.5
1.0
0.5
0
levelANRmevitaleR
)S81/3SRFS(
SFRS3 mRNA
Hypoxia – + – +
Cell WT BpRc1
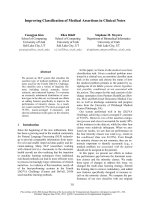
Fig. 2. mRNA levels of hypoxia-repressed genes analyzed by Q-PCR. (A,B) Wild-type (WT) hepa1c1c7 cells and BpRc1 cells were incubated
in hypoxic conditions for 16 h. The expression level of each gene was quantified by Q-PCR. Values are presented as the average ± standard
deviation of three independent experiments. Statistical analysis of the Q-PCR data was evaluated using one-way ANOVA.
Arnt-dependent gene expression in hypoxia S. M. Choi et al.
5624 FEBS Journal 275 (2008) 5618–5634 ª 2008 The Authors Journal compilation ª 2008 FEBS
bility (4 ⁄ 8) in hepa1c1c7 cells. We next compared the
fold induction of these eight genes in Arnt-defective
BpRc1 cells. Microarray analyses showed that two
genes (DUSP12 and ABCC3) were repressed by
hypoxia in both hepa1c1c7 and BpRc1 cells, whereas
the remaining six genes (MAD2L1, HSP60, FKBP4,
PSMA3, GNA11 and SFRS3) were only repressed in
wild-type cells. However, Q-PCR analyses indicated
that only two (MAD2L1 and HSP60) of the
four (MAD2L1, HSP60, FKBP4, and PSMA3)
confirmed genes were believed to be repressed in an
Arnt-dependent manner. These results suggested that
our microarray analysis was able to predict
Arnt-dependent repression of each gene with a 50%
probability.
Genes that are regulated by hypoxia in
a HIF-1a ⁄ b-dependent manner
Q-PCR analyses confirmed that nine genes were
induced and four were repressed in response to
hypoxia (Tables 2 and 4), and that 10 of the 13 con-
firmed genes were regulated by hypoxia in an
Arnt-dependent manner. The remaining three genes
(SUI1-RS1, FKBP4 and PSMA3) were found to be
regulated in an Arnt-independent manner. To substan-
tiate the specific role of Arnt, we used BpRc1 cells
infected with retrovirus expression full-length Arnt
[17]. BpRc1 cells reconstituted with full-length Arnt
restored the hypoxia-induced (IER3, BSG, BNIP3,
VEGF, CCNG2, NDR1, P4HA1 , PTPN16) or hypoxia-
repressed (HSP60, MAD2L1) gene expression
(Table 5), confirming that these 10 genes are regulated
by hypoxia in an Arnt-dependent manner. The fold
induction of the genes was often greater in BpRc1 cells
reconstituted with Arnt, reflecting that overexpression
of Arnt endowed the cells with increased responsibili-
ties to hypoxia. In addition, the Arnt-dependent induc-
tion of five genes (IER3, BSG, BNIP3, VEGF and
NDR1) and Arnt-dependent repression of two genes
(MAD2L1 and HSP60) were validated by northern
blot analysis (Fig. 3).
Finally, we investigated the role of HIF-1a in regu-
lating the expression of these genes in response to
hypoxia by analyzing murine preadipoctyes 3T3-L1,
in which HIF-1a
was knocked down by infection of
retrovirus encoding a short hairpin RNA (shRNA)
against HIF-1a. Western blot analyses confirmed a
specific reduction of HIF-1a protein by the cognate
shRNA in 3T3-L1 cells (Fig. 4A). Q-PCR analysis
determined that IER3, BSG, BNIP3, VEGF, CCNG2
and NDR1 were induced in response to hypoxia in
both an Arnt- and HIF-1a-dependent manner, indicat-
ing that they are the target genes for HIF-1a ⁄ b
(Table 5 and Fig. 4B,C).
Interestingly, it was determined that hypoxia
induced both P4HA1 and PTPN16 in an Arnt-depen-
dent, but HIF-1a-independent manner. shRNA
knockdown of HIF-1a failed to completely abolish
hypoxia-induced expression of both P4HA1 and
PTPN16, but instead reduced the fold induction of
these genes by approximately one-half, thereby sug-
gesting that HIF-1a plays a role in regulating hypoxia-
mediated induction of these genes, at least in part
(Table 5). As Arnt is a common binding partner for
both HIF-1a and HIF-2a, HIF-2a may also play a
partial role in regulating the hypoxia-dependent induc-
tion of these genes.
Table 4. Hypoxia-repressed gene expression analyzed by both microarray and Q-PCR. up, hypoxia-induced expression pattern, fold ‡ 1.5;
down, hypoxia-repressed expression pattern, fold < 0.6; nc, no change, 0.6 £ fold < 1.5; ns, not statistically significant, P value > 0.05; ),
Arnt independent; +, Arnt dependent.
Gene
symbol
Microarray Q-PCR
WT cells BpRc1 cells
Arnt
dependence
WT cells BpRc1 cells
Arnt
dependence
Fold
a
q value
b
Fold
a
q value
b
fold
a
P value Fold
a
P value
MAD2L1 0.59 down 0.010 0.71 nc 0.003 + 0.52 down 0.00039 1.09 ns 0.10562 +
HSP60 0.55 down 0.005 0.76 nc 0.007 + 0.16 down 0.00023 0.65 nc 0.00089 +
FKBP4 0.56 down 0.005 0.72 nc 0.003 + 0.06 down 0.00023 0.26 down 0.00041 )
PSMA3 0.54 down 0.014 0.74 nc 0.012 + 0.46 down 0.00396 0.36 down 0.00037 )
GNA11 0.59 down 0.070 0.63 nc 0.003 + 0.64 ns 0.05276 0.56 down 0.00717 na
c
SFRS3 0.53 down 0.060 0.67 nc 0.003 + 1.86 up 0.02817 0.30 down 0.00675 na
c
DUSP12 0.53 down 0.005 0.37 down 0.003 ) 1.68 up 0.00044 1.11 ns 0.21254 na
c
ABCC3 0.60 down 0.029 0.43 down 0.003 ) 1.02 ns 0.99976 0.43 down 0.00037 na
c
a
Fold: a ratio of expression in hypoxia ⁄ expression in normoxia.
b
q value: significant difference, false discovery rate (FDR), selected q
value < 0.1.
c
na, not applied; Arnt dependence was not applied when gene expression pattern of Q-PCR was different from microarray in
hepa1c1c7 cells.
S. M. Choi et al. Arnt-dependent gene expression in hypoxia
FEBS Journal 275 (2008) 5618–5634 ª 2008 The Authors Journal compilation ª 2008 FEBS 5625
Table 5. mRNA levels of hypoxia-regulated genes in both hepa1c1c7 cells and 3T3-L1 cells analyzed by Q-PCR. up, hypoxia-induced expression pattern, fold ‡ 1.5; down: hypoxia-
repressed expression pattern, fold < 0.6; nc, no change, 0.6 £ fold < 1.5; ns, not statistically significant, P value > 0.05; ) , Arnt or HIF-1a independent; +, Arnt or HIF-1a dependent.
Gene
symbol
Q-PCR in hepa1c1c7 cells Q-PCR in 3T3-L1 cells
Reference
WT cells BpRc1 cells Arnt + BpRc1 cells
Arnt
dependence
WT Control sh HIF-1a
HIF-1a
dependence
Fold
a
P value Fold
a
P value Fold
a
P value Fold
a
P value Fold
a
P value Fold
a
P value
IER3 14.68 up 0.00023 0.47 ns 0.80513 14.84 up 0.00059 + 31.83 up 0.00016 25.19 up 0.00016 3.88 ns 0.66843 + [19]
BSG 4.36 up 0.00023 1.03 ns 0.98929 5.06 up 0.00088 + 10.97 up 0.00016 8.25 up 0.00016 1.26 ns 0.99925 + [20]
BNIP3 16.34 up 0.00023 0.63 ns 0.99743 91.91 up 0.00035 + 57.94 up 0.00016 30.73 up 0.00016 8.57 ns 0.55686 + [18,19]
VEGF 20.33 up 0.00023 1.78 ns 0.67472 21.29 up 0.00001 + 5.42 up 0.00016 4.29 up 0.00022 1.12 ns 0.99131 + [18,26]
CCNG2 18.95 up 0.00023 1.18 ns 0.97169 11.66 up 0.00055 + 6.95 up 0.00016 6.55 up 0.00016 2.06 ns 0.66843 + [19,26]
NDR1 66.79 up 0.00023 2.18 ns 0.95664 544.44 up 0.00037 + 13.59 up 0.00016 14.55 up 0.00453 6.16 ns 0.48301 + [18,19,26]
P4HA1 16.83 up 0.00024 0.54 ns 0.94244 3.16 up 0.00207 + 10.50 up 0.00016 10.58 up 0.00016 5.59 up 0.00353 ) ⁄ + [18,19,26]
PTPN16 107.10 up 0.00023 1.41 ns 0.91962 20.72 up 0.00003 + 3.59 up 0.00644 2.42 up 0.00016 1.94 up 0.00096 ) ⁄ + [18]
SUI1-RS1 4.87 up 0.00024 2.65 up 0.00038 317.10 up 0.01303 ) 1.51 up 0.00421 2.87 up 0.00016 1.64 up 0.00039 ) –
PSMA3 0.46 down 0.00396 0.36 down 0.00037 0.46 down 0.00254 ) 0.53 down 0.00017 0.36 down 0.00016 0.58 down 0.00016 ) –
HSP60 0.16 down 0.00023 0.65 nc 0.00089 0.09 down 0.00028 + 0.10 down 0.00392 0.19 down 0.00392 0.99 ns 0.99998 + –
MAD2L1 0.52 down 0.00039 1.09 ns 0.38923 0.56 down 0.01628 + 0.53 ns 0.28610 0.72 ns 0.73432 0.94 ns 0.99868 na
b
–
FKBP4 0.06 down 0.00023 0.26 down 0.00041 0.08 down 0.00137 ) 0.33 ns 0.53301 0.18 down 0.00779 0.72 nc 0.00227 na
b
–
a
Fold: a ratio of expression in hypoxia ⁄ expression in normoxia.
b
na, not applied; Arnt or HIF-1a dependence was not applied when gene expression pattern of Q-PCR was different from
microarray in hepa1c1c7 cells.
Arnt-dependent gene expression in hypoxia S. M. Choi et al.
5626 FEBS Journal 275 (2008) 5618–5634 ª 2008 The Authors Journal compilation ª 2008 FEBS
In contrast, our results demonstrated that SUI1-RS1
expression was induced in response to hypoxia, even in
the absence of both Arnt and HIF-1a, suggesting that
neither HIF-1a nor HIF-2a was required for hypoxia-
induced expression of this gene. Therefore, our results
demonstrated that HIF was not required for the induc-
tion of SUI1-RS1 in response to hypoxia. In addition,
our results demonstrated that PSMA3 was repressed
by hypoxia in the absence of both Arnt and HIF-1a,
and that HSP60 was repressed by hypoxia in an Arnt-
and HIF-1a-dependent manner. Finally, we determined
that MAD2L1 and FKBP4 were repressed in
hepa1c1c7 cells, but not in 3T3-L1 cells, suggesting
that these genes were repressed in response to hypoxia
in a cell type-specific manner.
Discussion
In this study, we identified 259 hypoxia-regulated genes
by microarray analysis and confirmed the expression
profiles of 17 of these genes by Q-PCR analysis. Col-
lectively, we determined that 13 of the 17 genes
(76.5%) were regulated, as predicted, by microarray
analysis. By comparing the results of our microarray
analysis between wild-type cells and BpRc1 cells, we
predicted the Arnt dependence of the confirmed 13
genes (Tables 2 and 4). Q-PCR analyses determined
that only six of the 13 genes (46.2%) showed a consis-
tent pattern of expression when compared with our
microarray analysis for Arnt-dependent regulation in
response to hypoxia.
BNIP3, VEGF, CCNG2 and NDR1 have been iden-
tified as HIF-1 target genes [21,22]. However, the
results of microarray analyses indicated that they were
also induced in BpRc1 cells in response to hypoxia.
Compared with microarray analysis, it was determined
that Q-PCR analysis of wild-type hepa1c1c7 cells
resulted in a greater fold induction of these genes, sug-
gesting that our microarray analysis quantitatively
underestimated the changes in gene expression in wild-
type cells. In contrast, both microarray and Q-PCR
analyses resulted in comparable levels of fold induction
in BpRc1 cells (Table 2) [19]. However, the P value of
fold induction measured by Q-PCR was determined to
be too large to accept the difference between the norm-
oxic and hypoxic mRNA level of the gene in BpRc1
cells (P > 0.05). Therefore, Q-PCR analysis demon-
strates that Arnt is important for the induction, but
less necessary for the repression, of hypoxia-mediated
gene expression when compared with predictions gen-
erated by microarray analysis. We next investigated
whether the expression of these 13 genes was also regu-
lated by HIF-1a (Table 5). It was determined that
seven of the 13 genes (IER3, BSG, BNIP3, VEGF,
CCNG2, NDR1 and HSP60) were regulated by
hypoxia in both an Arnt- and HIF-1a-dependent
manner. Two genes (P4HA1 and PTPN16) were found
to be induced in response to hypoxia in an Arnt-
dependent manner, but only partially regulated in a
HIF-1a-dependent manner. An additional two genes
(SUI1-RS1 and PSMA3) were determined to be regu-
lated under hypoxic conditions in both an Arnt- and
HIF-1a-independent manner. For the final two genes
(MAD2L1 and FKBP4), it was determined that they
were not repressed in 3T3-L1 cells, indicating that
these genes are regulated in a cell type-specific manner.
In addition to identifying previously known HIF-1
target genes, including BNIP3, VEGF, CCNG2 , NDR1
and P4HA1 [21,22], and other known hypoxia-induc-
ible genes, including IER3, BSG and PTPN16 [21–23],
this report is the first to identify a number of novel
hypoxia-regulated genes, including SUI1-RS1, HSP60
and PSMA3 (Table 5).
WT Arnt
–/–
Arnt – – +
Hypoxia – + – + – +
BNIP3
NDR1
BSG
IER3
VEGF
28S/18S
NB
α
-Arnt
WB
MAD2L1
HSP60
28S/18S
WT Arnt
–/–
Arnt – – +
Hypoxia – + – + – +
NB
A
B
Fig. 3. Northern analyses of hypoxia-regulated genes. (A,B) Wild-
type (WT) mouse hepa1c1c7 cells, the variant BpRc1 cells and
BpRc1 cells reconstituted with Arnt were exposed to hypoxic condi-
tions (0.1% O
2
) for 6 h. Western blot analysis was performed using
30 lg of the cell lysates and HIF-1b (ARNT) antibody (top panel:
WB). For northern blot (NB) analysis, wild-type mouse hepa1c1c7
cells, the BpRc1 variant cell line and BpRc1 cells reconstituted with
Arnt were exposed to hypoxic conditions for 16 h; 20 lg of total
RNA from the treated cells was transferred onto a nitrocellulose
membrane. Each blot was hybridized with the indicated [a-
32
P]-
labeled probes. Information on the probes is presented in Table S3.
S. M. Choi et al. Arnt-dependent gene expression in hypoxia
FEBS Journal 275 (2008) 5618–5634 ª 2008 The Authors Journal compilation ª 2008 FEBS 5627
A
Hypoxia – + – + – +
sh RNA – Control HIF - 1α
α
3T3 - L1
14
12
10
8
6
4
2
0
BSG mRNA
l e v e l A N R m e v i t a l e R
) S 8 1 /
G
S B
(
Hypoxia – + – + – +
sh RNA – Control HIF - 1α
α
3T3 - L1
14
12
10
8
6
4
2
0
P4HA1 mRNA
l e
v
e l A N
R
m
e v i t
a l
e R
) S 8 1 / 1 A H 4 P (
Hypoxia – + – + – +
sh RNA – Control HIF - 1α
α
3T3 - L1
60
50
40
30
20
10
0
IER3 mRNA
l e v e l A N R m e v i t a l e R
) S 8 1 / 3 R E I
(
Hypoxia – + – + – +
sh RNA – Control HIF - 1α
α
3T3 - L1
100
80
60
40
20
0
BNIP3 mRNA
l e v e l A N R m e v i t a l e R
) S 8 1 / 3 P I N B (
Hypoxia – + – + – +
sh RNA – Control HIF - 1α
α
3T3 - L1
8
6
4
2
0
CCNG2 mRNA
l e v e l A N R
m
e v i t
a
l e R
) S 8 1 / 2 G N C C (
Hypoxia – + – + – +
sh RNA – Control HIF - 1α
α
3T3 - L1
2.5
2.0
1.5
1.0
0.5
0
SUI1 - RS1 mRNA
l
e v e l
A
N R
m
e v i t
a l
e R
1 I U
S (
- ) S 8
1 /
1
S
R
Hypoxia – + – + – +
sh RNA – Control HIF - 1α
α
3T3 - L1
7
6
5
4
3
2
1
0
VEGF mRNA
l e v e l A N R m e v i t a l e R
) S 8 1 / F G E V (
Hypoxia – + – + – +
sh RNA – Control HIF - 1α
α
3T3 - L1
18
15
12
9
6
3
0
PTPN16 mRNA
l e v e l A N R
m
e v i t
a l
e R
) S 8 1 / 6
1
N
P T
P (
Hypoxia – + – + – +
sh RNA – Control HIF - 1α
α
3T3 - L1
16
12
8
4
0
NDR1 mRNA
l e v
e
l A
N
R m
e
v i t a l
e
R
) S 8 1 / 1 R D N (
B
3T3 - L1
sh RNA – Control HIF - 1α
α
Hypoxia – + – + – +
- HIF - 1
- 14 - 3 - 3
B W
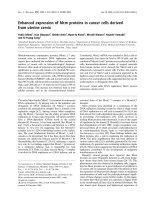
Fig. 4. mRNA levels of hypoxia-regulated genes analyzed by Q-PCR. HIF-1a knockdown 3T3-L1 cells and control 3T3-L1 cells were gener-
ated using the retroviral system as described in Experimental procedures. (A) Level of HIF-1a protein by shRNA in 3T3-L1 cells. The cells
were incubated in 1% O
2
for 16 h. Western blot (WB) analysis was performed using HIF-1a antibody (Novus Biochemicals, Littleton, CO,
USA), and anti-14-3-3c (Upstate Biotechnology, Lake Placid, NY, USA) was used as loading control. (B, C) The cells were incubated under
hypoxia for 16 h. The mRNA levels of the indicated genes were analyzed by Q-PCR and normalized to the 18S rRNA levels. Values are
reported as the average ± standard deviation of three independent experiments. Statistical analysis of the Q-PCR data was evaluated using
one-way ANOVA.
Arnt-dependent gene expression in hypoxia S. M. Choi et al.
5628 FEBS Journal 275 (2008) 5618–5634 ª 2008 The Authors Journal compilation ª 2008 FEBS
Our results identified IER3 and BSG as HIF-1 target
genes. Both IER3 and BSG were induced by hypoxia
in wild-type hepa1c1c7 cells and 3T3-L1 cells, but were
not induced in either Arnt- or HIF-1a-defective cells.
In contrast with our findings, previous microarray
analysis of hypoxic embryonic stem cells has demon-
strated that IER3 is induced by hypoxia in both
HIF-1a
) ⁄ )
and HIF-2 a
) ⁄ )
embryonic stem cells [24].
However, IER3, also known as the immediate early
response gene X-1 (IEX-1), is a stress-inducible protein
involved in the regulation of both cell proliferation
and apoptosis in a cell type-dependent fashion. Expres-
sion of IER3 ⁄ IEX-1 is tightly regulated by a number
of transcription factors, including p53, Sp1, c-Myc,
c ⁄ EBP, USF and NF-j B, and may therefore be regu-
lated in response to a variety of signals [22,25].
The second HIF-1 target gene identified, BSG (or
CD147), was originally identified as a tumor surface
receptor capable of inducing matrix metalloproteinase
(MMP) expression in fibroblasts [26]. Antibodies to
BSG have been shown to decrease MMP expression,
leading to an inhibition of tumor cell invasion [27].
Cyclophilin A, a ligand of BSG, is also induced in
response to hypoxia⁄ reoxygenation and leads to the
induction of a neuroprotective effect through BSG
receptor signaling [23,28]. Our observation that
hypoxia induces BSG signaling through HIF-1 indi-
cates that BSG signaling may play a role in HIF-medi-
ated hypoxic preconditioning effects and tumor
progression.
Q-PCR analysis demonstrated that hypoxic induc-
tion of P4HA1 and PTPN16 occurred in an Arnt-
dependent manner. However, HIF-1a knockdown
partly attenuated the hypoxic induction of both genes
(Table 5). Therefore, these results, in combination with
previous findings demonstrating that HIF-1 a and HIF-
2a share common target genes and that overexpression
of both increases the expression of P4HA1 and
PTPN16, confirmed that these genes were induced by
hypoxia through both HIF-1a and HIF-2a [21,29].
Furthermore, previous studies by Hofbauer et al. [30]
have demonstrated that hypoxia induces the expression
Hypoxia – + – + – +
sh RNA – Control HIF-1α
α
3T3 - L1
2.0
1.5
1.0
0.5
0
MAD2L1 mRNA
l e v e l A N R m e v i t a l e R
) S 8 1 / 1 L 2 D A M (
4
3
2
1
0
HSP60 mRNA
l e v e l A N R m e v i t a l e R
) S 8 1 / 0 6 P S H (
C
Hypoxia – + – + – +
sh RNA – Control HIF-1α
α
3T3 - L1
9
6
3
0
FKBP4 mRNA
l e v e l A N R m e v i t a l e R
) S 8 1 / 4 P B
K
F (
Hypoxia – + – + – +
sh RNA – Control HIF-1α
α
3T3 - L1
3
2
1
0
PSMA3 mRNA
l e v e l A N R m e v i t a l e R
) S 8 1 / 3 A M S P (
Hypoxia – + – + – +
sh RNA – Control HIF-1α
α
3T3 - L1
Fig. 4. Continued.
S. M. Choi et al. Arnt-dependent gene expression in hypoxia
FEBS Journal 275 (2008) 5618–5634 ª 2008 The Authors Journal compilation ª 2008 FEBS 5629
of a number of collagen fiber-forming proteins, includ-
ing proline 4-hydroxylase a1 (P4HA1), P4HA2 and
procollagen lysyl hydroxylases, through both Arnt and
HIF-1 signaling using Arnt-defective hepatoma cells
and HIF-1a knockout embryonic fibroblast cells.
PTPN16, also known as mitogen-activated protein
kinase phosphatase-1 (MKP-1) or DUSP1, is a phos-
pho-threonine ⁄ phospho-tyrosine-specific phosphatase
which inhibits mitogen-activated protein kinase
(MAPK) activity by dephosphorylation. Consistent
with its role as a MAPK inhibitor, mice lacking
PTPN16 ⁄ MKP-1 ⁄ DUSP1 demonstrate enhanced
MAPK activity. As MAPK has been shown to stimu-
late a number of cellular processes, PTPN16 as a
MAPK antagonist can inhibit these processes. Several
studies have demonstrated that PTPN16 is involved in
the innate immune response [31], diet-induced obesity
[32] and human cancers [33]. In addition to hypoxia,
oxidative stress has been reported to increase PTPN16
protein levels in a p53-dependent manner, resulting in
decreased MAPK activity and increased cellular sus-
ceptibility to oxidative damage. Our results show that
hypoxia was unable to induce either PTPN16 or
P4HA1 genes in Arnt-defective cells, whereas hypoxia
was able to partially induce the expression of these
genes in HIF-1a knockdown cells (Table 5).
The demonstration of the induction of SUI1-RS1
and the repression of PSMA3 in response to hypoxia
in the absence of both Arnt and HIF-1a indicates that
hypoxia regulates the expression of a number of genes
in a HIF-independent manner. Human SUI1 has been
shown to be induced in response to DNA damage and
endoplasmic reticulum (ER) stress [34]. The amino
acid sequence of the murine SUI1 protein demon-
strates that it is identical to the eukaryotic translation
initiation factor 1 (eIF1). eIF1, in concert with eIF1a,
binds to the small (40S) ribosomal subunit to form the
initiation complex at the mRNA start codon. Small
ribosomes that lack eIF1 and eIF1a fail to reach the
initiation site selection [35]. Here, we demonstrate, for
the first time, that the SUI1 ⁄ eIF1 gene is induced by
hypoxia through a HIF-independent mechanism.
Severe hypoxia (less than 0.1% O
2
) or anoxia has also
been reported to trigger ER stress, leading to the
unfolded protein response and activation of the PKR-
like ER kinase (PERK), suppression of translation and
induction of several transcription factors and chaper-
one proteins, including activating transcription factor-4
(ATF-4) and its target gene, CHOP-10 ⁄ GADD153.
Both ATF-4 and CHOP-10⁄ GADD153 have been
shown to be induced by anoxia. However, their induc-
tion is independent of HIF activity [36–38]. Similarly
to ATF-4 and CHOP-10, we report that SUI1 ⁄ eIF1 is
induced by severe hypoxia (0.1% O
2
) in a HIF-inde-
pendent manner. However, the mechanisms by which
hypoxia induces the expression of these genes, and
how the induction of SUI1 ⁄ eIF1 affects translation
efficiency in response to hypoxic stress, remain
unclear.
PSMA3 ⁄ Lmpe8 is the a subunit of the 20S protea-
some. The 20S proteasome is composed of four rings,
each of which contains seven subunits. The outer rings
comprise a subunits, and the inner rings are composed
of b subunits [39]. Oligonucleotide chip analysis has
demonstrated that PSMA3 and its isoforms, PSMA2
and PSMA4, are down-regulated by antioxidants,
including BO653 and probucol. Previous studies have
determined that two antioxidant responsive elements in
the promoter region of PSMA3 are necessary for the
down-regulation of PSMA3 [40]. In the current study,
we have demonstrated that PSMA3 is repressed by
hypoxia in both an Arnt- and HIF-1a-independent
manner.
In addition to PSMA3, we have determined that
HSP60, a stress-responsive chaperone that exists in
both the mitochondria and cytosol, is repressed by
hypoxia in both an Arnt- and HIF-1a-dependent
manner. Using high-throughput proteomics screening,
Ghosh et al. [41] determined that HSP60 interacts with
apoptosis inhibitors and contributes to a broad anti-
apoptotic program in tumors. These data suggest that
HSP60 inhibitors may function as a putative antican-
cer agent by differentially inducing apoptosis in tumor
cells [41]. However, it remains to be determined
whether hypoxia decreases HSP60 protein levels in an
Arnt- and HIF-1a-dependent manner [42].
HIF is a transcriptional activator that is essential
for the hypoxic repression of several genes, including
E-cadherin, heme oxygenase 1, peroxisome prolifera-
tors-activated receptor c (PPARc) and MLH1 [43–45].
HIF has been shown to repress genes by inducing
specific transcriptional repressors, such as STRA13 ⁄ -
DEC1 ⁄ SHARP2, DEC2, SNAIL and Bach1 [44,46,47].
In addition, HIF itself functions as a transcriptional
repressor. Several research groups have reported that
HIF binding sites that are oriented on the antisense
strand are important for the hypoxic repression mecha-
nism. Consistent with these findings, previous studies
have determined that equilibrative nucleoside trans-
porter 1, PPARa and Na-K-2Cl cotransporter 1 all
contain HIF binding sites oriented on the antisense
strand of their respective promoters, and are repressed
by hypoxia [48–50].
This study further highlights the importance of HIF-
mediated regulation of cellular gene expression in both
ischemic diseases and tumors by identifying additional,
Arnt-dependent gene expression in hypoxia S. M. Choi et al.
5630 FEBS Journal 275 (2008) 5618–5634 ª 2008 The Authors Journal compilation ª 2008 FEBS
novel target genes and relating their functions to the
hypoxic response. Previous studies have demonstrated
that HIF mediates hypoxic preconditioning effects by
inducing VEGF and erythropoietin [51], whereas HIF
accelerates tumor progression by regulating lysyl oxi-
dase, E-cadherin and plasminogen activator inhibitor-1
[45]. Therefore, our results from both microarray and
Q-PCR analyses extend our understanding of the HIF
target genes, and provide a better understanding of
hypoxia-mediated signaling.
Experimental procedures
Cell lines
Mouse hepatoma hepa1c1c7 cells, the Arnt-defective BpRc1
variant and mouse preadipocyte 3T3-L1 cells were pur-
chased from the American Type Culture Collection
(ATCC) (Manassas, VA, USA) [15]. Arnt-defective BpRc1
cells reconstituted with full-length Arnt were kindly pro-
vided by J. P. Whitlock, Jr [17]. HIF-1a knockdown
3T3-L1 cells were generated using a retroviral vector system
(BD Biosciences, Palo Alto, CA, USA). An shRNA oligo-
nucleotide was generated against mouse HIF-1a and ligated
with the pSIREN-RetroQ vector to generate pSIREN-Ret-
roQ-shHIF-1a, according to the manufacturer’s instructions
(BD Biosciences). The sequence for shRNA against mouse
HIF-1a (GenBank accession number AF003695) was
5¢-GATCCGTGTGAGCTCACATCTTGATTTCAAGAG
AATCAAGATGTGA GCTCA CAT TTTTTA GATCT G-3¢.
The sequence for control shRNA was provided by BD Bio-
sciences: 5¢-GATCCGTGCGTTGCAGTACCAACTTCAA
GAGATTTTTTACGCGTG-3¢. 3T3-L1 cells were infected
with the retrovirus encoding either shHIF-1a or the control
shRNA, and selection with puromycin (2 lgÆmL
)1
) was
performed to identify the infected cells.
Microarray analysis
Wild-type mouse hepa1c1c7 and BpRc1 cells were grown to
80% confluence on a 100 mm tissue culture plate, and then
exposed to hypoxic conditions (0.1% O
2
) by incubation in
an anaerobic chamber (Model 1029, Forma Scientific, Inc.,
Marietta, OH, USA) in 5% CO
2
, 10% H
2
and 85% N
2
for
16 h at 37 °C [52]. Total RNA was isolated using an
RNeasy spin column, according to the manufacturer’s
instructions (Qiagen Inc., Valencia, CA, USA). For micro-
array analysis, two sets of RNA samples were prepared for
both normoxic and hypoxic hepa1c1c7 and BpRc1 cells.
The RNA quality of each sample was analyzed by electro-
phoresis on a denaturing agarose gel with northern blotting
(data not shown). Mouse 6K cDNA twin chips (Twin-
ChipÔ Mouse-6K, Digital Genomics Inc.), which contain
two sets of 5592 independent mouse cDNA sequences, were
used in this study. Four replicate experiments were per-
formed using two sets of RNA samples and two twin chips
that incorporated dye-reversed hybridization, according to
the instructions of the manufacturer (Digital Genomics
Inc.) [53,54]. Microarrays were processed as follows. Briefly,
cDNA probes were prepared by the reverse transcription of
total RNA (50 lg) in the presence of aminoallyl-dUTP and
6 lg of random primers (Invitrogen, San Diego, CA, USA)
for 3 h. Contaminants were removed from the cDNA
probes by a Microcon YM-30 column (Millipore, Bedford,
MA, USA). Cleaned probes were then coupled to either
Cy3 or Cy5 dye (Amersham Pharmacia Biotech, Uppsala,
Sweden). The Cy3- or Cy5-labeled cDNA probes were puri-
fied with a QIAquick PCR Purification Kit (Qiagen). Dried
Cy3- or Cy5-labeled cDNA probes were resuspended in
hybridization buffer (30% formamide, 5· SSC, 0.1% SDS,
0.1 mgÆmL
)1
salmon sperm DNA). The Cy3- or Cy5-
labeled cDNA probes were mixed, hybridized to a micro-
array slide and incubated overnight at 42 °C. The slide was
washed twice with wash solution 1 (2· SSC and 0.1% SDS)
for 5 min at 42 °C, once with wash solution 2 (0.1· SSC
and 0.1% SDS) for 10 min at room temperature and,
finally, four times with 0.1· SSC for 1 min at room temper-
ature. The slide was dried by centrifugation at 18 g for
5 min. The hybridization image was analyzed by genepix
4100A and genepix pro 3.0 software (Axon Instrument,
Union City, CA, USA) to obtain gene expression ratios
(normoxic sample versus hypoxic sample).
Data analysis
Data were normalized in an intensity-dependent manner
using a scatter plot smoother ‘lowess’ [55]. The identifica-
tion of genes with significant differences in expression levels
was performed using the significance analysis of micro-
array software program (SAM, version 1.21) [56]. SAM
estimates the percentage of genes identified by chance, the
false discovery rate (FDR) [54]. We assessed the statistical
significance of the differential expression of genes by com-
puting a q value (minimum FDR) for each gene. Genes
were considered to be differentially expressed when the fold
change between normoxia and hypoxia was determined to
be greater than 1.5 or less than 0.6, or when the q value
was less than 0.1.
Q-PCR
Total RNA was isolated using an RNeasy spin column
(Qiagen Inc.). cDNA was reverse transcribed from total
RNA (1 lg) using AMV reverse transcriptase with dNTPs
and random primers (Promega, Madison, WI, USA). For
Q-PCR, the iQÔ SYBR Green Supermix and MyiQ single
color real-time PCR detection system (Bio-Rad, Hercules,
CA, USA) was used. The expression level of 18S rRNA
S. M. Choi et al. Arnt-dependent gene expression in hypoxia
FEBS Journal 275 (2008) 5618–5634 ª 2008 The Authors Journal compilation ª 2008 FEBS 5631
(GenBank accession number X03205) was detected
using the primers 5¢-ACCGCAGCTAGGAATAATGGAA
TA-3¢ (forward) and 5¢-CTTTCGCTCTGGTCCGTCTT-3¢
(reverse), and then used for normalization. Statistical analy-
sis of the Q-PCR data was evaluated using one-way
ANOVA. Data were presented as the average ± standard
deviation with values derived from at least three experi-
ments. A value of P < 0.05 was considered to be statisti-
cally significant. For primer design, we carried out blast
searches to determine the full-length cDNA sequences of
the genes that were identified by microarray analyses. The
information for each primer used in the Q-PCR analysis of
each gene is presented in Table S2.
Acknowledgements
We thank Professor James P. Whitlock, Jr for provid-
ing BpRc1 cells reconstituted with full-length Arnt. We
thank Miss Hyun-Ju Cho and Miss Sujin Yim for tech-
nical assistance. This work was supported by a grant
(CBM-01-B-1-3) from the Center for Biological Modu-
lators of the 21st Century Frontier R&D Program, the
Ministry of Science and Technology and a grant
(R200706192003) from the Basic Research Program of
the Korean Science and Engineering Foundation,
Korea to H. Park. S. M. Choi and H. Oh are sup-
ported by a Brain Korea 21 Research Fellowship.
S. M. Choi is supported by a Seoul Science Fellowship.
References
1 Hochachka PW (1986) Defense strategies against
hypoxia and hypothermia. Science 231, 234–241.
2 Kim JW, Tchernyshyov I, Semenza GL & Dang CV
(2006) HIF-1-mediated expression of pyruvate dehydro-
genase kinase: a metabolic switch required for cellular
adaptation to hypoxia. Cell Metab 3, 177–185.
3 Papandreou I, Cairns RA, Fontana L, Lim AL &
Denko NC (2006) HIF-1 mediates adaptation to
hypoxia by actively downregulating mitochondrial oxy-
gen consumption. Cell Metab 3, 187–197.
4 Zhang H, Gao P, Fukuda R, Kumar G, Krishnamach-
ary B, Zeller KI, Dang CV & Semenza GL (2007)
HIF-1 inhibits mitochondrial biogenesis and cellular
respiration in VHL-deficient renal cell carcinoma by
repression of C-MYC activity. Cancer Cell 11, 407–420.
5 Jiang BH, Rue E, Wang GL, Roe R & Semenza GL
(1996) Dimerization, DNA binding, and transactivation
properties of hypoxia-inducible factor 1. J Biol Chem
271, 17771–17778.
6 Masson N, Willam C, Maxwell PH, Pugh CW & Ratc-
liffe PJ (2001) Independent function of two destruction
domains in hypoxia-inducible factor-alpha chains acti-
vated by prolyl hydroxylation. EMBO J 20 , 5197–5206.
7 Semenza GL (2000) HIF-1 and human disease: one
highly involved factor. Genes Dev 14, 1983–1991.
8 Hewitson KS, McNeill LA, Riordan MV, Tian YM,
Bullock AN, Welford RW, Elkins JM, Oldham NJ,
Bhattacharya S, Gleadle JM et al. (2002) Hypoxia-
inducible factor (HIF) asparagine hydroxylase is identi-
cal to factor inhibiting HIF (FIH) and is related to the
cupin structural family. J Biol Chem 277, 26351–26355.
9 Lando D, Peet DJ, Whelan DA, Gorman JJ & White-
law ML (2002) Asparagine hydroxylation of the HIF
transactivation domain: a hypoxic switch. Science 295,
858–861.
10 Wang GL, Jiang BH, Rue EA & Semenza GL (1995)
Hypoxia-inducible factor 1 is a basic-helix–loop–helix-
PAS heterodimer regulated by cellular O
2
tension. Proc
Natl Acad Sci USA 92, 5510–5514.
11 Wiesener MS, Jurgensen JS, Rosenberger C, Scholze
CK, Horstrup JH, Warnecke C, Mandriota S, Bech-
mann I, Frei UA, Pugh CW et al. (2003) Widespread
hypoxia-inducible expression of HIF-2alpha in distinct
cell populations of different organs. FASEB J 17, 271–
273.
12 Lo
¨
fstedt T, Fredlund E, Holmquist-Mengelbier L,
Pietras A, Ovenberger M, Poellinger L & Pa
˚
hlman S
(2007) Hypoxia inducible factor-2alpha in cancer.
Cell Cycle 6, 919–926.
13 Crews ST & Fan CM (1999) Remembrance of things
PAS: regulation of development by bHLH-PAS pro-
teins. Curr Opin Genet Dev 9, 580–587.
14 Maltepe E, Schmidt JV, Baunoch D, Bradfield CA &
Simon MC (1997) Abnormal angiogenesis and
responses to glucose and oxygen deprivation in mice
lacking the protein ARNT. Nature 386, 403–407.
15 Miller AG & Whitlock JP Jr (1981) Novel variants in
benzo(a)pyrene metabolism. Isolation by fluorescence-
activated cell sorting. J Biol Chem 256, 2433–2437.
16 Hankinson O (1979) Single-step selection of clones of a
mouse hepatoma line deficient in aryl hydrocarbon
hydroxylase. Proc Natl Acad Sci USA 76, 373–376.
17 Ko HP, Okino ST, Ma Q & Whitlock JP Jr (1996)
Dioxin-induced CYP1A1 transcription in vivo: the aro-
matic hydrocarbon receptor mediates transactivation,
enhancer–promoter communication, and changes in
chromatin structure. Mol Cell Biol 16, 430–436.
18 Seidel SD & Denison MS (1999) Differential gene
expression in wild-type and arnt-defective mouse hepa-
toma (Hepa1c1c7) cells. Toxicol Sci 52, 217–225.
19 Fong CJ, Burgoon LD & Zacharewski TR (2005) Com-
parative microarray analysis of basal gene expression
in mouse Hepa-1c1c7 wild-type and mutant cell lines.
Toxicol Sci 86, 342–353.
20 Wang F, Shi S, Zhang R & Hankinson O (2006) Identi-
fying target genes of the aryl hydrocarbon receptor
nuclear translocator (Arnt) using DNA microarray
analysis. Biol Chem 387, 1215–1218.
Arnt-dependent gene expression in hypoxia S. M. Choi et al.
5632 FEBS Journal 275 (2008) 5618–5634 ª 2008 The Authors Journal compilation ª 2008 FEBS
21 Wang V, Davis DA, Haque M, Huang LE & Yarchoan
R (2005) Differential gene up-regulation by hypoxia-
inducible factor-1alpha and hypoxia-inducible factor-
2alpha in HEK293T cells. Cancer Res 65, 3299–3306.
22 Sung FL, Hui EP, Tao Q, Li H, Tsui NB, Dennis Lo
YM, Ma BB, To KF, Harris AL & Chan AT (2007)
Genome-wide expression analysis using microarray
identified complex signaling pathways modulated by
hypoxia in nasopharyngeal carcinoma. Cancer Lett 253,
74–88.
23 Seko Y, Fujimura T, Taka H, Mineki R, Murayama K
& Nagai R (2004) Hypoxia followed by reoxygenation
induces secretion of cyclophilin A from cultured rat car-
diac myocytes. Biochem Biophys Res Commun 317,
162–168.
24 Hu CJ, Iyer S, Sataur A, Covello KL, Chodosh LA &
Simon MC (2006) Differential regulation of the tran-
scriptional activities of hypoxia-inducible factor 1 alpha
(HIF-1alpha) and HIF-2alpha in stem cells. Mol Cell
Biol 26, 3514–3526.
25 Huang YH, Wu JY, Zhang Y & Wu MX (2002) Syner-
gistic and opposing regulation of the stress-responsive
gene IEX-1 by p53, c-Myc, and multiple NF-kap-
paB ⁄ rel complexes. Oncogene 21, 6819–6828.
26 Biswas C, Zhang Y, DeCastro R, Guo H, Nakamura
T, Kataoka H & Nabeshima K (1995) The human
tumor cell-derived collagenase stimulatory factor
(renamed EMMPRIN) is a member of the immuno-
globulin superfamily. Cancer Res 55, 434–439.
27 Kanekura T, Chen X & Kanzaki T (2002) Basigin
(CD147) is expressed on melanoma cells and induces
tumor cell invasion by stimulating production of matrix
metalloproteinases by fibroblasts. Int J Cancer 99, 520–
528.
28 Boulos S, Meloni BP, Arthur PG, Majda B, Bojarski C
& Knuckey NW (2007) Evidence that intracellular
cyclophilin A and cyclophilin A ⁄ CD147 receptor-medi-
ated ERK1 ⁄ 2 signalling can protect neurons against
in vitro oxidative and ischemic injury. Neurobiol Dis 25,
54–64.
29 Holmquist-Mengelbier L, Fredlund E, Lo
¨
fstedt T,
Noguera R, Navarro S, Nilsson H, Pietras A, Vallon-
Christersson J, Borg A, Gradin K et al. (2006) Recruit-
ment of HIF-1alpha and HIF-2alpha to common target
genes is differentially regulated in neuroblastoma: HIF-
2alpha promotes an aggressive phenotype. Cancer Cell
10, 413–423.
30 Hofbauer KH, Gess B, Lohaus C, Meyer HE, Kats-
chinski D & Kurtz A (2003) Oxygen tension regulates
the expression of a group of procollagen hydroxylases.
Eur J Biochem 270, 4515–4522.
31 Liu Y, Shepherd EG & Nelin LD (2007) MAPK phos-
phatases – regulating the immune response. Nat Rev
Immunol 7, 202–212.
32 Wu JJ, Roth RJ, Anderson EJ, Hong EG, Lee MK,
Choi CS, Neufer PD, Shulman GI, Kim JK & Bennett
AM (2006) Mice lacking MAP kinase phosphatase-1
have enhanced MAP kinase activity and resistance to
diet-induced obesity. Cell Metab 4, 61–73.
33 Liao Q, Guo J, Kleeff J, Zimmermann A, Buchler MW,
Korc M & Friess H (2003) Down-regulation of the
dual-specificity phosphatase MKP-1 suppresses tumori-
genicity of pancreatic cancer cells. Gastroenterology 124,
1830–1845.
34 Sheikh MS, Fernandez-Salas E, Yu M, Hussain A,
Dinman JD, Peltz SW, Huang Y & Fornace AJ Jr
(1999) Cloning and characterization of a human geno-
toxic and endoplasmic reticulum stress-inducible cDNA
that encodes translation initiation factor 1 (eIF1(A121 ⁄
SUI1)). J Biol Chem 274, 16487–16493.
35 Fletcher CM, Pestova TV, Hellen CU & Wagner G
(1999) Structure and interactions of the translation initi-
ation factor eIF1. EMBO J 18, 2631–2637.
36 Carriere A, Carmona MC, Fernandez Y, Rigoulet M,
Wenger RH, Penicaud L & Casteilla L (2004) Mito-
chondrial reactive oxygen species control the transcrip-
tion factor CHOP-10 ⁄ GADD153 and adipocyte
differentiation: a mechanism for hypoxia-dependent
effect. J Biol Chem 279, 40462–40469.
37 Ameri K, Lewis CE, Raida M, Sowter H, Hai T &
Harris AL (2004) Anoxic induction of ATF-4 through
HIF-1-independent pathways of protein stabilization in
human cancer cells. Blood 103, 1876–1882.
38 Rzymski T, Paantjens A, Bod J & Harris AL (2008)
Multiple pathways are involved in the anoxia response
of SKIP3 including HuR-regulated RNA stability,
NF-kappaB and ATF4. Oncogene 27, 4532–4543.
39 Nandi D, Woodward E, Ginsburg DB & Monaco JJ
(1997) Intermediates in the formation of mouse 20S
proteasomes: implications for the assembly of precursor
beta subunits. EMBO J 16, 5363–5375.
40 Takabe W, Mataki C, Wada Y, Ishii M, Izumi A,
Aburatani H, Hamakubo T, Niki E, Kodama T &
Noguchi N (2000) Gene expression induced by BO-653,
probucol and BHQ in human endothelial cells.
J Atheroscler Thromb 7, 223–230.
41 Ghosh JC, Dohi T, Kang BH & Altieri DC (2008)
Hsp60 regulation of tumor cell apoptosis. J Biol Chem
283, 5188–5194.
42 Gupta S & Knowlton AA (2002) Cytosolic heat shock
protein 60, hypoxia, and apoptosis. Circulation 106,
2727–2733.
43 Nakamura H, Tanimoto K, Hiyama K, Yunokawa M,
Kawamoto T, Kato Y, Yoshiga K, Poellinger L, Hiy-
ama E & Nishiyama M (2008) Human mismatch repair
gene, MLH1, is transcriptionally repressed by the
hypoxia-inducible transcription factors, DEC1 and
DEC2. Oncogene 27, 4200–4209.
S. M. Choi et al. Arnt-dependent gene expression in hypoxia
FEBS Journal 275 (2008) 5618–5634 ª 2008 The Authors Journal compilation ª 2008 FEBS 5633
44 Yun Z, Maecker HL, Johnson RS & Giaccia AJ (2002)
Inhibition of PPAR gamma 2 gene expression by the
HIF-1-regulated gene DEC1 ⁄ Stra13: a mechanism for
regulation of adipogenesis by hypoxia. Dev Cell 2 , 331–
341.
45 Rankin EB & Giaccia AJ (2008) The role of hypoxia-
inducible factors in tumorigenesis. Cell Death Differ 15,
678–685.
46 Imai T, Horiuchi A, Wang C, Oka K, Ohira S, Nikaido
T & Konishi I (2003) Hypoxia attenuates the expression
of E-cadherin via up-regulation of SNAIL in ovarian
carcinoma cells. Am J Pathol 163, 1437–1447.
47 Kitamuro T, Takahashi K, Ogawa K, Udono-Fujimori
R, Takeda K, Furuyama K, Nakayama M, Sun J,
Fujita H, Hida W et al. (2003) Bach1 functions as a
hypoxia-inducible repressor for the heme oxygenase-1
gene in human cells. J Biol Chem 278, 9125–9133.
48 Eltzschig HK, Abdulla P, Hoffman E, Hamilton KE,
Daniels D, Schonfeld C, Loffler M, Reyes G, Duszenko
M, Karhausen J et al. (2005) HIF-1-dependent repres-
sion of equilibrative nucleoside transporter (ENT) in
hypoxia. J Exp Med 202, 1493–1505.
49 Narravula S & Colgan SP (2001) Hypoxia-inducible fac-
tor 1-mediated inhibition of peroxisome proliferator-
activated receptor alpha expression during hypoxia.
J Immunol 166, 7543–7548.
50 Ibla JC, Khoury J, Kong T, Robinson A & Colgan SP
(2006) Transcriptional repression of Na-K-2Cl cotrans-
porter NKCC1 by hypoxia-inducible factor-1. Am J
Physiol Cell Physiol 291, C282–C299.
51 Choi YK & Kim KW (2008) Blood–neural barrier: its
diversity and coordinated cell-to-cell communication.
BMB Rep 41 , 345–352.
52 Choi SM, Choi K-O, Lee N, Oh M & Park H (2006)
The zinc chelator, N,N,N¢,N¢-tetrakis (2-pyridylmethyl)
ethylenediamine, increases the level of nonfunctional
HIF-1alpha protein in normoxic cells. Biochem Biophys
Res Commun 343, 1002–1008.
53 Lee M, Kwon J, Kim SN, Kim JE, Koh WS, Kim EJ,
Chung MK, Han SS & Song CW (2003) cDNA micro-
array gene expression profiling of hydroxyurea, paclit-
axel, and p-anisidine, genotoxic compounds with
differing tumorigenicity results. Environ Mol Mutagen
42, 91–97.
54 Yoon SJ, Choi DH, Lee WS, Cha KY, Kim SN & Lee
KA (2004) A molecular basis for embryo apposition
at the luminal epithelium. Mol Cell Endocrinol 219, 95–
104.
55 Yang YH, Dudoit S, Luu P, Lin DM, Peng V, Ngai J
& Speed TP (2002) Normalization for cDNA micro-
array data: a robust composite method addressing
single and multiple slide systematic variation.
Nucleic Acids Res 30, e15.
56 Tusher VG, Tibshirani R & Chu G (2001) Significance
analysis of microarrays applied to the ionizing radiation
response. Proc Natl Acad Sci USA 98, 5116–5121.
Supporting information
The following supplementary material is available:
Table S1. Numbers of hypoxia-induced and hypoxia-
repressed genes identified by microarray analyses.
Table S2. Sequences of the primers used for Q-PCR.
Table S3. Probes used in northern analyses.
This supplementary material can be found in the
online version of this article.
Please note: Wiley-Blackwell is not responsible for
the content or functionality of any supplementary
material supplied by the authors. Any queries (other
than missing material) should be directed to the corre-
sponding author for the article.
Arnt-dependent gene expression in hypoxia S. M. Choi et al.
5634 FEBS Journal 275 (2008) 5618–5634 ª 2008 The Authors Journal compilation ª 2008 FEBS